FET - Bulls Preparing for a Comeback?FET has completed a clean correction after its previous strong impulse move, retracing all the way back into the support zone around 0.23–0.28, which has been acting as a key demand area for weeks.
Price bounced from that zone and is now attempting to reclaim structure, signaling that buyers might be preparing to take control again.
For now, the market structure is simple:
Impulse upward ➝ Correction ➝ Potential new impulse.
If the bulls manage to hold above the orange zone and break the descending correction trendline, the next impulsive leg toward 0.50 becomes the most likely scenario.
However, if FET breaks back below 0.23, the bullish setup would fail and deeper downside would be expected.
We are now at the stage where the market decides whether the bulls fully take over… or if this bounce is just a pause before another dip. 🤔
⚠️ Disclaimer: This is not financial advice. Always do your own research and manage risk properly.
📚 Stick to your trading plan regarding entries, risk, and management.
Good luck! 🍀
All Strategies Are Good; If Managed Properly!
~Richard Nasr.
Token

DCR - The Calm Before the Next Impulse!📈DCR has recently surged in a parabolic manner, posting one of its strongest rallies in months. However, after such a vertical move, a correction phase was inevitable, and that’s exactly what we’re seeing now.
📉At the moment, price is retracing within a clear descending channel, approaching a massive confluence zone marked by the demand area and the lower red trendline. This intersection represents a key area of interest to look for potential long setups.
⚔️If buyers manage to defend this zone, DCR could soon resume its next impulsive leg upward, potentially breaking out of the correction structure and extending the broader bullish momentum.
⚠️ Disclaimer: This is not financial advice. Always do your own research and manage risk properly.
📊All Strategies Are Good; If Managed Properly!
~Richard Nasr

ZEC - Roadmap to $500!💪Zcash has been on fire lately, outperforming over 90% of altcoins in the market. After months of accumulation, the bulls have finally taken control, driving ZEC into a strong impulsive rally that shows no signs of exhaustion yet.
📈 From a technical perspective , ZEC is trading within a well-defined rising channel, maintaining a clean bullish structure of higher highs and higher lows. The recent breakout above the previous all-time high around $372 confirms strong bullish momentum.
🏹As long as the channel’s lower boundary continues to act as dynamic support, the next logical target for the bulls sits around the $500 round number, which aligns with the upper boundary of the channel, a major confluence zone.
In the short term, a minor pullback toward the $370–$400 region wouldn’t be surprising and could offer new long opportunities before the next bullish leg kicks in.
⚠️ Disclaimer: This is not financial advice. Always do your own research and manage risk properly.
All Strategies Are Good; If Managed Properly!
~Richard Nasr

NEAR - Patience at the Pivot, Power at the Bounce!📦NEAR has been stuck within a big range for months. After failing at the mid-range, price is grinding lower, and I’d prefer one more liquidity sweep into the blue support zone to reset late longs and load smart risk.
⚔️If buyers defend 2.00 and we then reclaim 2.20 → 2.30 (H4 close back above the pink structure), I’ll look for trend-following longs toward 2.70, then 3.10–3.40 (major resistance).
Plan:
🏹Wait for the dip into support, hunt for a wick + strong close/reclaim, and let the squeeze do the heavy lifting back into the range highs.
📚All Strategies Are Good; If Managed Properly!
~Richard Nasr

SUI - Oversold and Testing a Major Intersection Zone!🏹SUI has reached a critical technical intersection, where the lower boundary of the long-term channel meets the bottom of the descending red structure. Historically, this area has acted as a launchpad for reversals, with multiple reactions from the same channel base in the past.
After weeks of heavy downside pressure, SUI now looks deeply oversold, both technically and structurally. The confluence between the horizontal support zone and the diagonal trendline adds strength to this level, making it a high-probability area for a short-term relief rally.
📈As long as the price holds above this support intersection , the next potential wave could target the upper red channel first, followed by the upper blue boundary near $4.5 if momentum continues to build.
If this level breaks decisively, it would signal a structural shift — but for now, bulls still have a chance to step in from this confluence zone.
📊All Strategies Are Good; If Managed Properly!
~Richard Nasr

Your Token, My Analysis — Let’s Do This!Hey Traders!
Hope you're all enjoying an amazing weekend !
Want me to analyze your favorite token next?
Just drop your request below using this format
Request Format:
Project Name: Bitcoin
Token Symbol: BTC ( BINANCE:BTCUSDT )
Important Rules:
I’ll analyze only the first 10 requests.
One request per person — so choose wisely!
I’ll reply directly under your comment .
If this sounds good, smash that Like button , Share with your friends , and let’s find the next big move together !
Here’s to your success — health, wealth, and great trades!

UDSUSD – FVG’s Not Filled, Trend Ain’t Done YetHey There Guys,
Post-BOS, the market’s still pushing with upside momentum.
That upper +FVG hasn’t been filled yet, so the trend’s not showing signs of fatigue.
The Strong Buy Zone below is still in play—if liquidity gets pulled down there, buyers could step in hard.
As long as we don’t get a daily close below the main support zone, dips are still buying opportunities.
I will share updates here.
Every like you send is my biggest motivation to keep sharing these setups. Big thanks to everyone backing me.

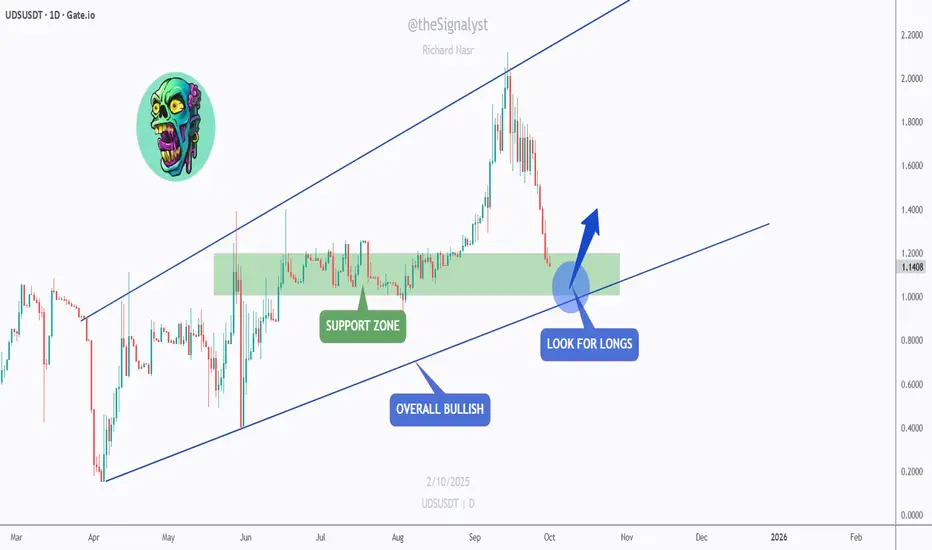
UDS - Confluence Reload Zone at Prior Base!UDS is still overall bullish inside a rising channel.
After a sharp markup, price pulled back into the previous consolidation base (green zone), which now overlaps with the channel’s lower boundary — a classic confluence area.
Key levels
Support: 1.05–1.15 (prior base / channel low)
Resistance: 1.30 → 1.45 (recent swing supply)
Why it matters
- Structure remains up while higher-timeframe channel holds.
- Pullback into old range highs + trendline = a spot where bulls often reload.
Scenarios
- Bullish 📈 Hold the green zone and print a higher low → continuation toward 1.30, then 1.45 if momentum persists.
- Bearish 📉 Daily close below the channel low → deeper correction before buyers try again.
⚠️ Disclaimer: This is not financial advice. Always do your own research and manage risk properly.
📚 Stick to your trading plan regarding entries, risk, and management.
Good luck! 🍀
All Strategies Are Good; If Managed Properly!
~Richard Nasr
WLD – Impulse, Correction, and What’s Next!Worldcoin (WLD) has just completed a massive impulse leg to the upside, followed by a sharp correction phase. Price is now retracing toward a strong demand zone, where bulls may look to re-enter.
⚡ Impulse Move: A parabolic run recently pushed WLD into new highs.
📉 Correction: Price is currently retracing in a controlled downward channel.
🟠 Demand Zone: The $1.40 – $1.50 area is a key zone where buyers previously stepped in strongly.
🚀 Potential Next Impulse: If this demand holds, WLD could launch the next bullish leg, potentially aiming back above $2.00 and beyond.
📌 The coming sessions will be crucial: will the demand zone hold and trigger another impulse, or will sellers break it for a deeper retracement?
This is an educational analysis, not financial advice. Always apply proper risk management when trading.
📚 Stick to your trading plan regarding entries, risk management, and trade execution.
Good luck!
All Strategies Are Good; If Managed Properly!
~Richard Nasr

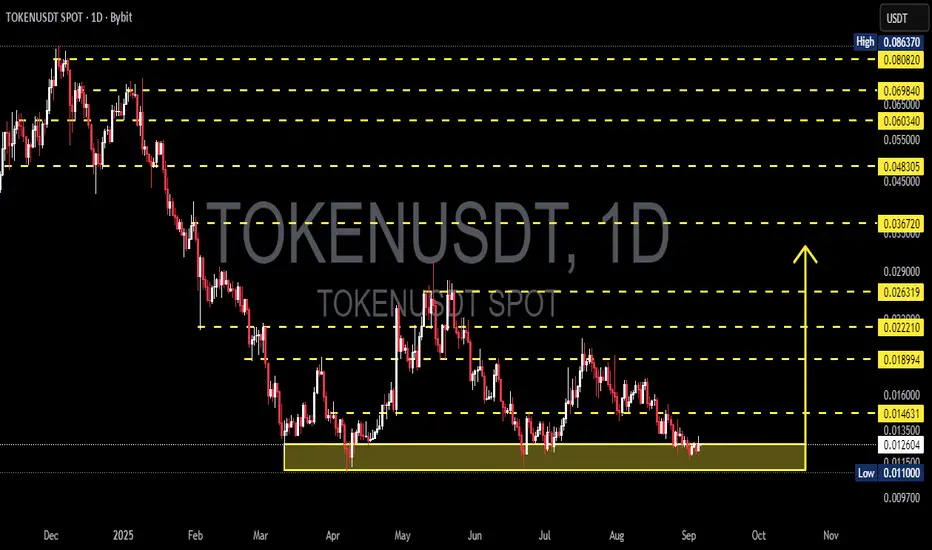
TOKENUSDT — This the Start of Accumulation or Anothe Breakdown?Full Analysis
TOKENUSDT is now trading at a decisive area: the major support zone between 0.0110 – 0.0146 USDT (highlighted in yellow). This zone has been tested multiple times since March 2025, making it a crucial demand area. How price reacts here will define the next big move: either a strong rebound or a deep continuation of the downtrend.
Market Structure
Primary trend: still bearish since the peak near 0.086 USDT (early 2025).
Lower highs sequence: sellers remain in control.
Multi-touch support: shows strong tug-of-war between buyers and sellers.
If this support holds, a potential triple bottom / accumulation base could form. But if it breaks, expect further downside.
---
Bullish Scenario 🟢
Confirmation: Daily close above 0.01463 USDT with strong volume.
Potential pattern: Base formation → higher low structure.
Upside targets:
Target 1: 0.01899 USDT (first resistance).
Target 2: 0.02221 USDT (minor supply zone).
Target 3: 0.02632 – 0.03672 USDT (major resistance cluster).
If momentum strengthens across the crypto market, price could extend toward 0.0483 – 0.0603 USDT.
Bullish takeaway: A rebound from this support may mark the start of a medium-term trend reversal.
---
Bearish Scenario 🔴
Confirmation: Daily close below 0.01100 USDT signals breakdown.
Downside targets:
Initial target: 0.00970 USDT (nearest historical low).
Extended target: below 0.009 if sellers dominate.
Bearish takeaway: Losing this critical support could trigger further capitulation and push the market to fresh lows.
---
Key Notes for Traders
1. Volume matters → Breakouts or breakdowns without strong volume often fail.
2. Wait for daily close → Avoid rushing entries based on intraday wicks.
3. Risk management first → Set clear stop loss (below support for longs, above resistance for shorts).
4. Multi-timeframe approach → Use daily for trend, H4/H1 for entry timing.
5. Watch BTC correlation → Altcoins often mirror Bitcoin’s momentum.
---
“TOKENUSDT is at a crossroads! After a prolonged downtrend from early 2025 highs, price is consolidating at the key support 0.0110 – 0.0146 USDT. This is the make-or-break zone: will buyers step in and spark a rebound toward 0.01899 – 0.02221 and beyond? Or will sellers break it down and drag price to 0.00970 USDT?
Volume and daily close confirmation will decide the next big move. Stay disciplined with stop losses and seize the opportunity—because the biggest moves often start at critical levels like this.”
---
#TOKENUSDT #CryptoAnalysis #Altcoin #SupportResistance #TechnicalAnalysis #BullishScenario #BearishScenario #CryptoTrading #SwingTrading
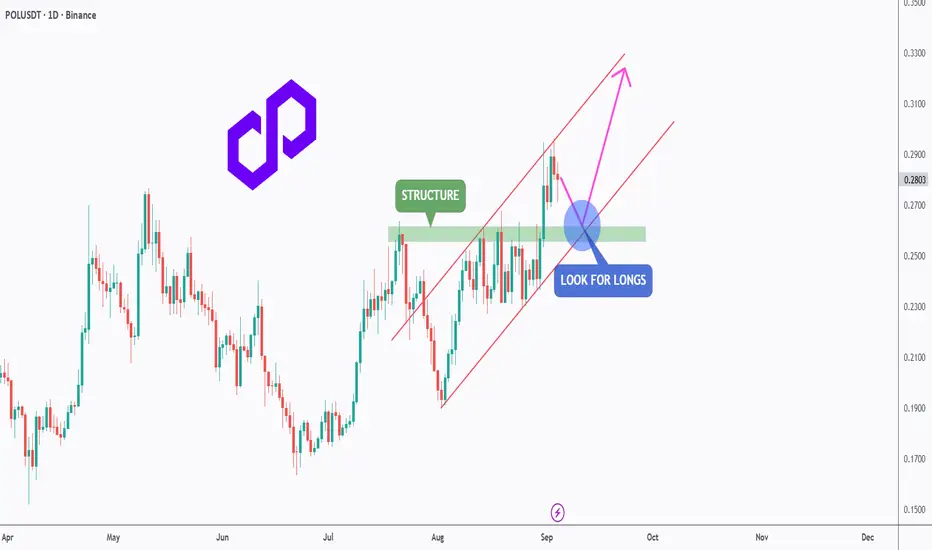
POL - Retest the Channel, Reload for the Next Leg!POLUSDT has been trading inside a clean ascending channel 📈, respecting both support and resistance levels.
After a strong push upward, price is now pulling back toward the previous structure zone around 0.26 – 0.27, which aligns perfectly with the lower bound of the channel.
This area forms a strong confluence (structure + channel support) 🔑, making it an ideal spot to look for long opportunities. As long as this zone holds, bulls 🐂 could regain control and push price toward the next resistance levels in the 0.32.
Patience here is key ⏳ — waiting for confirmation before entering can set up a high-probability continuation trade.
⚠️ Disclaimer: This is not financial advice. Always do your own research and manage risk properly.
📚 Always follow your trading plan regarding entry, risk management, and trade management.
Good luck!
All Strategies Are Good; If Managed Properly!
~Richard Nasr
SOL - Retest the Zone, Reload the Longs!Solana continues to trade within a well-defined ascending channel on the daily timeframe. After a strong bullish leg, price is now pulling back toward the highlighted support zone, which also aligns with the lower bound of the short-term channel.
As long as this area holds, it offers an attractive spot to look for fresh long opportunities. A confirmed bounce here could set the stage for continuation higher toward the channel’s upper boundary.
The structure remains bullish, and dips into demand are where the best risk-to-reward setups lie. Keep an eye on this zone for the next move.
⚠️ Disclaimer: This is not financial advice. Always do your own research and manage risk properly.
📚 Stick to your trading plan regarding entries, risk management, and trade execution.
Good luck!
All Strategies Are Good; If Managed Properly!
~Richard Nasr

(SHIB) shiba inu "boxes" yearlyWhat's the deal with shiba inu? There is so much talk about it, yet the chart looks less than the comparison to what XRP looks like, for instance. XRP has a huge following, but so does Shiba Inu. Shiba Inu even has haters due to so many people talking about the revelation that Shiba Inu will win in the end. This year, Shiba Inu did not do much of anything unless you count all that has gone on with the website and the company. As for the chart graphs pictures, the look is one that feels like there could be a predictable end to the year brewing. Or is there?

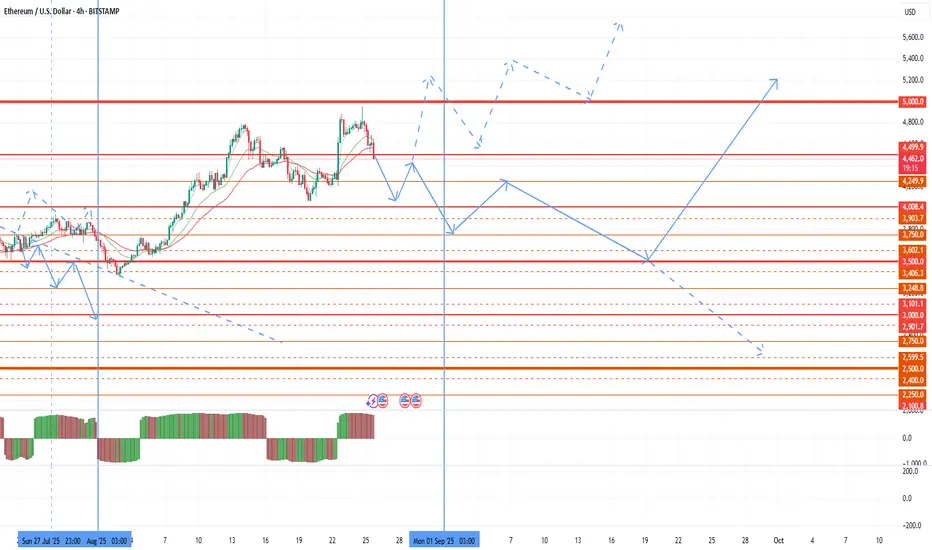
Attention, seasonal sales!Today we have moved on to the seasonal sales period, and I want to review the market situation once again. As I wrote in my last review, in order to continue active trading, I am waiting for another delisting and assignment of the monitoring tag, after which we can identify more reliable and attractive tools for speculators. However, this year binance continues to make the footsteps. After ether's growth was too fast to form a trend, a significant pullback was prevented in July. This prevents further purchases and consolidation above 5k. At the same time, there was no delisting and assignment of the monitoring tag, which preserves the threat of drawdown for altcoins and reduces the activity of buyers. As a result, the seasonal August purchases were repaid.
The next seasonal wave of market growth is from the end of September to the beginning of November. In the next three weeks, it is worth preparing for a bear attack and, hopefully, another assignment of the monitoring tag, after which it will be possible to identify altcoins that are safe for operation.
Before the closing of the current monthly candle, there is still a possibility of the last bull attack in the second half of the week with a possible 5k takeover, however, only with a clear signal, which may be negative data on US GDP or a sharp rise in brent oil above $ 70 followed by a breakout of the last monthly candle for EUR/USD. But for now, for 3-4 weeks, the probability of a retest of 3500 on ether prevails at least, followed by a resumption of growth from the end of September if the bulls hold 3500.
As expected, fan tokens have shown themselves to be the most interesting and confident in such a market picture due to strong oversold conditions, but today I have also finished work with them before the likely seasonal decline.
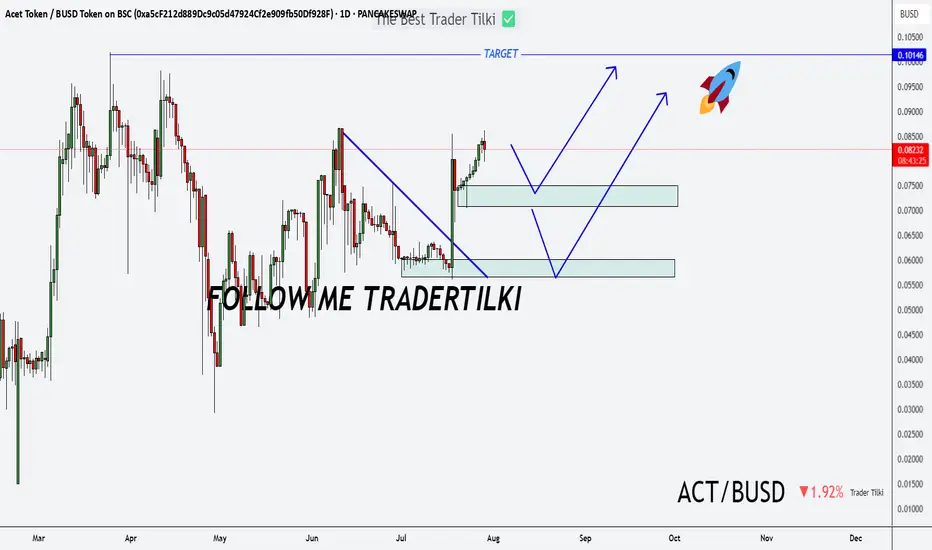
Act Bust on My Radar: Long-Term Vision, Short-Term Target!Hey folks 👋
I’ve put together a solid analysis for a promising token: **Act Bust**.
Whether it hits my entry level or not, I’ll be holding this token long-term.
Right now, the target is set at **0.10146**—once we get there, I’ll update you all.
Stay tuned, and trade smart 💼🚀
INJ - Back Bullish!Hello TradingView Family / Fellow Traders. This is Richard, also known as theSignalyst.
📈INJ has been overall bullish trading within the rising wedge pattern marked in blue.
This week, INJ has been retesting the lower bound of the wedge.
Moreover, the green zone is a strong demand.
🏹 Thus, the highlighted blue circle is a strong area to look for buy setups as it is the intersection of the lower blue trendline and green demand.
📚 As per my trading style:
As #INJ approaches the blue circle zone, I will be looking for trend-following bullish reversal setups (like a double bottom pattern, trendline break , and so on...)
📚 Always follow your trading plan regarding entry, risk management, and trade management.
Good luck!
All Strategies Are Good; If Managed Properly!
~Richard Nasr

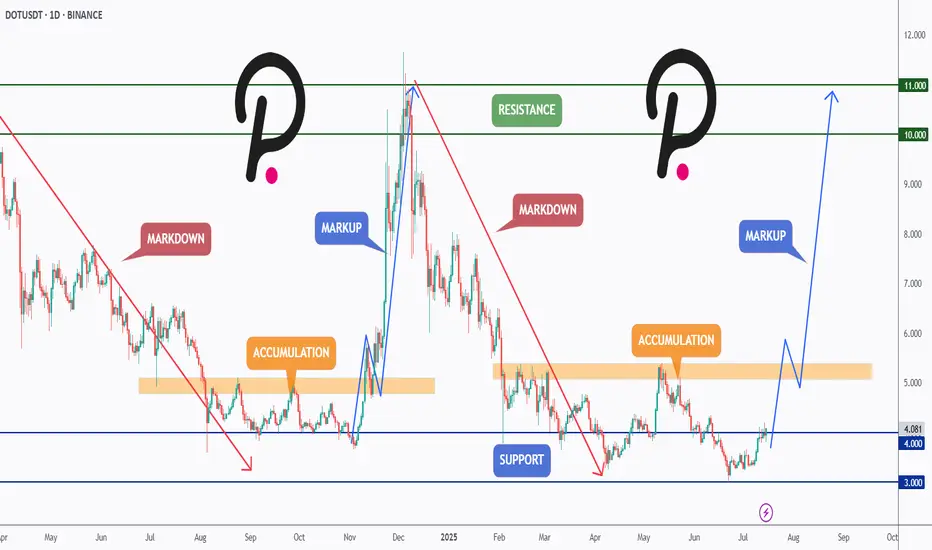
DOT Reloading for Takeoff ?CRYPTOCAP:DOT has been following a textbook Wyckoff cycle — moving from markdown into accumulation, followed by a sharp markup, then another markdown, and once again settling into a fresh accumulation zone.
After retesting the major support at $4 and holding above it, DOT is showing early signs of bullish momentum. If this structure continues, we could be preparing for another markup phase with potential targets at the $6, $10, and even $11 resistance zones.
This setup mirrors the previous cycle — will history repeat itself?
📍 Key Levels:
Support: $4.00 & $3.00
Resistance: $6.00, $10.00, and $11.00
Let me know your thoughts in the comments 👇
📚 Always follow your trading plan regarding entry, risk management, and trade management.
Good luck!
All Strategies Are Good; If Managed Properly!
~Richard Nasr
TOKENUSDT Forming Bullish WaveTOKENUSDT is currently displaying a promising bullish wave pattern that is catching the attention of traders looking for steady and reliable gains in the crypto market. The pair has shown consistent volume, indicating strong market participation and growing investor interest. While the expected gain of 10% to 20% may seem modest compared to some high-flying altcoins, this setup offers a more stable opportunity for those who prefer lower-risk trades with a clear technical structure.
The current price action suggests that TOKENUSDT is forming higher highs and higher lows, which is a classic sign of a bullish wave continuation. Many traders appreciate this pattern for its clear entry and exit levels, making it easier to manage risk and lock in profits. As the crypto market remains volatile, having a well-structured pair like TOKENUSDT in your watchlist can help diversify your trading portfolio and balance out more aggressive plays.
With a healthy support zone and steady upward momentum, TOKENUSDT has the potential to break through minor resistance levels and deliver the projected gains in the near term. Investors should watch for confirmation candles and spikes in buying volume to validate this bullish scenario. This crypto pair’s relative stability and clear pattern make it an appealing choice for swing traders and trend followers alike.
✅ Show your support by hitting the like button and
✅ Leaving a comment below! (What is You opinion about this Coin)
Your feedback and engagement keep me inspired to share more insightful market analysis with you!

TOKENUSDT 1D AnalysisTOKEN ~ 1D Analysis
#TOKEN This is the lowest support for now. Buy gradually from here with a short term target of at least 15%+ from this support.

Monthly Candle volatility growthThe market remains extremely sluggish in the seasonal flat, but there is a possibility of increased volatility this week and next. In this regard, I would like to consider the market situation and the likely prospects. First of all, in the medium term, the probability of a flat of about 100k for bitcoin and 2500 for ether prevails until the opening of the new half-year. There are no sufficient arguments for a significant break and trend towards 210k for bitcoin and 5k for ether. In addition, strong statistics for the United States began to be released, which increases the likelihood of a retest of 1900-2100 on ether and 85-90k on bitcoin. That is, until August, I am still more likely to expect a flat of 95-110k and 2250-2750 under an optimistic scenario. With a more negative picture, there remains the possibility of a major drawdown of the market until the retest of the loyalties of the first quarter on the tops.
A significant spike and bullish trend may be facilitated by the cancellation of Trump's duties voluntarily or in court, a truce in Ukraine, or the consolidation of brent above $ 69-70 while maintaining growth. In the event of a resumption of duties or a collapse of oil below $ 60, the probability of a fall in the crypt will become extremely high.
Against the background of the closing of the last bullish monthly candle and above 2500 on ether, we have technical signals for continued purchases. This week, there is a possibility of a major wave of purchases in the first half of the month with an attempt to move. However, strong US statistics are likely to continue to dampen growth attempts. Starting next week, it is worthwhile to carefully consider the volume of positions in the work due to the high probability of a market drawdown in the second half of the month. At the end of the week, I will assess the probability of maintaining purchases in the second half of the month, depending on the statistics released this week and the dynamics of oil.
To date, I am still considering the most oversold coins for scalping that have not been assigned the chess fio adx monitoring tag with possible growth waves of up to 70-100% from current levels. Fan tokens with a growth potential of up to 100-200% remain in a highly undervalued position, among which I work with atm acm city porto Lazio alpine juv. For storing funds in the medium term, quick looks interesting with the main long-term support at 0.020-21. The cos slf data pivx token can also show growth waves of up to 30-40%.
As I wrote earlier, large-cap coins, against the background of a seasonal flat and likely sales, may continue to fall slowly until August, in the absence of major growth in the tops or the index of dominance of altcoins.

XVG - Privacy is Important!Hello TradingView Family / Fellow Traders. This is Richard, also known as theSignalyst.
📈XVG has been overall bullish trading within the rising channel marked in blue and it is currently retesting the lower bound of the channel.
Moreover, the red zone is a strong structure.
🏹 Thus, the highlighted blue circle is a strong area to look for buy setups as it is the intersection of structure and lower blue trendline acting as a non-horizontal support.
📚 As per my trading style:
As #XVG approaches the blue circle zone, I will be looking for bullish reversal setups (like a double bottom pattern, trendline break , and so on...)
📚 Always follow your trading plan regarding entry, risk management, and trade management.
Good luck!
All Strategies Are Good; If Managed Properly!
~Rich

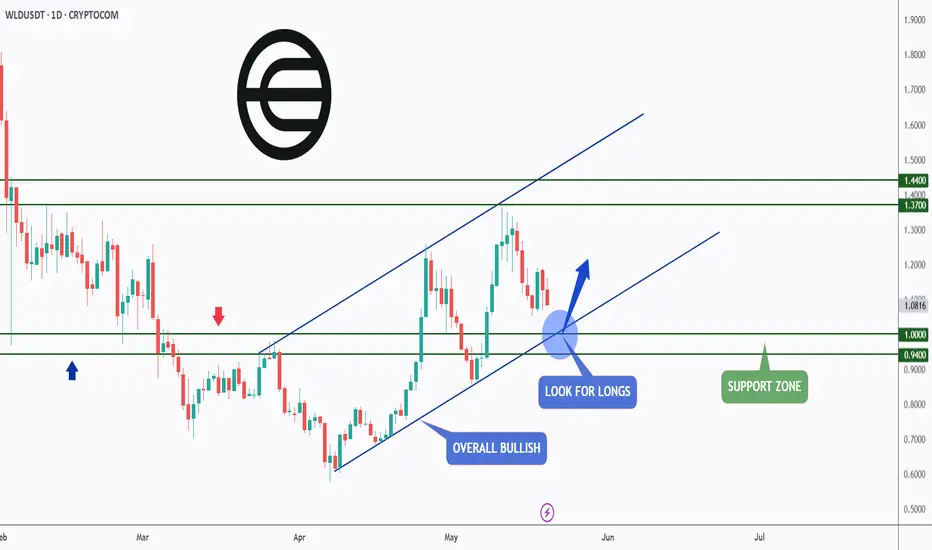
WLD - AI Cycle Is Back!Hello TradingView Family / Fellow Traders. This is Richard, also known as theSignalyst.
📈WLD has been in a correction phase. However it is still overall bullish long-term trading within the rising channel marked in blue.
Moreover, the green zone is a strong support and round number $1.
🏹 Thus, the highlighted blue circle is a strong area to look for buy setups as it is the intersection of support and lower blue trendline acting non-horizontal support.
📚 As per my trading style:
As #WLD retests the blue circle zone, I will be looking for bullish reversal setups (like a double bottom pattern, trendline break , and so on...)
📚 Always follow your trading plan regarding entry, risk management, and trade management.
Good luck!
All Strategies Are Good; If Managed Properly!
~Rich