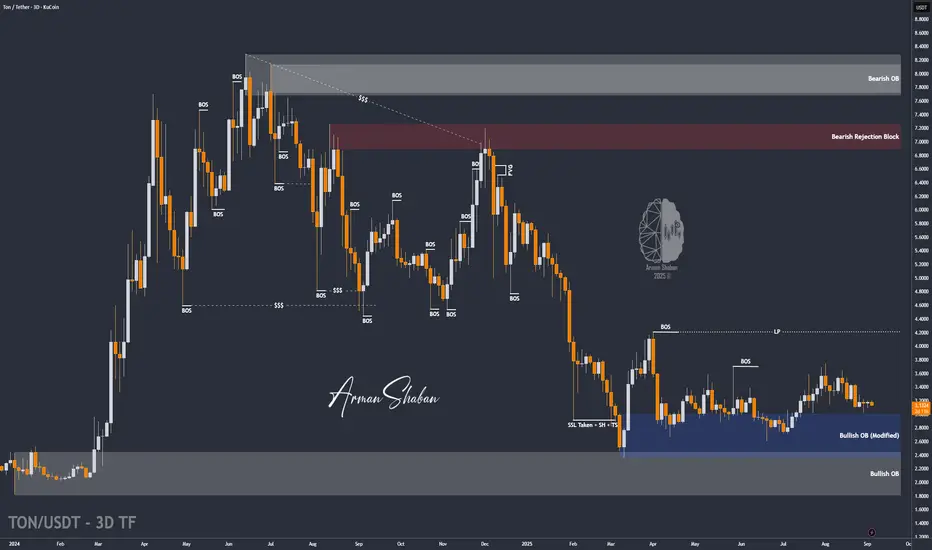
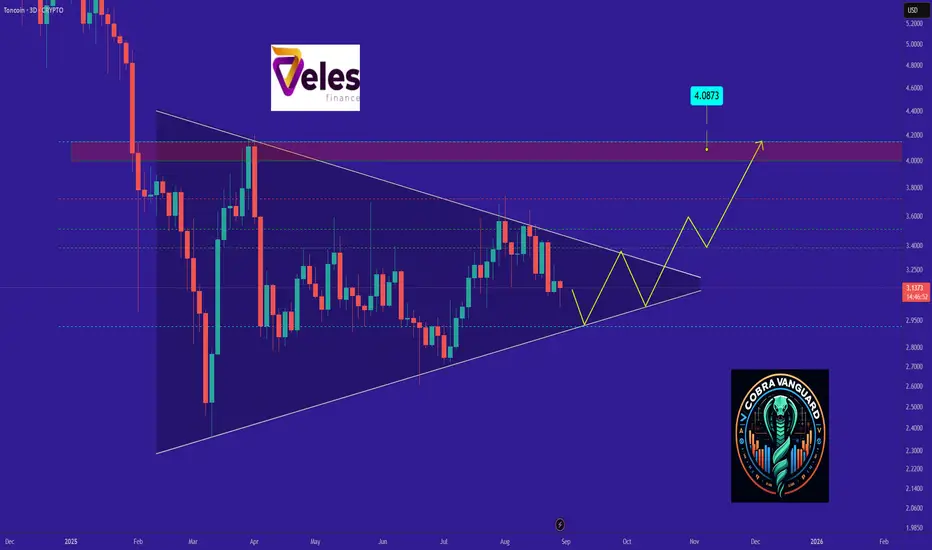
TON/USDT | TON Gearing Up for a Bullish Wave – Key Targets AheadBy analyzing the TON Coin chart on the 3-day timeframe, we can see that the price is currently consolidating around the key level of $3.13. This stabilization suggests that a strong bullish wave may be on the horizon.
The potential upside targets for this move are $3.63, $3.75, $4.20, and $4.68.
Keep an eye on this zone — momentum could kick in soon!
Please support me with your likes and comments to motivate me to share more analysis with you and share your opinion about the possible trend of this chart with me !
Best Regards , Arman Shaban
Tonusdt
#TON/USDT | TON Testing Wedge Breakout Amid Key Support#TON
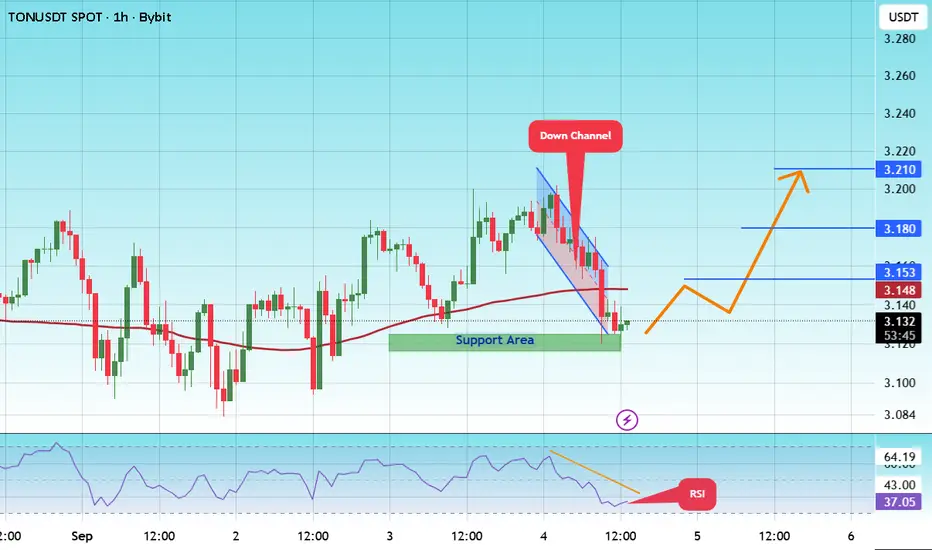
The price is moving within a descending channel on the 1-hour frame and is expected to break and continue upward.
We have a trend to stabilize above the 100 moving average once again.
We have a downtrend on the RSI indicator that supports the upward move with a breakout.
We have a support area at the lower boundary of the channel at 3.12, acting as strong support from which the price can rebound.
We have a major support area in green that pushed the price higher at 3.12.
Entry price: 3.12
First target: 3.15
Second target: 3.18
Third target: 3.21
To manage risk, don't forget stop loss and capital management.
When you reach the first target, save some profits and then change the stop order to an entry order.
For inquiries, please comment.
Thank you.
TradeCityPro | TON Testing Wedge Breakout Amid Key Support🙏 Welcome to TradeCity Pro!
In this analysis I want to review the TON coin for you. One of the popular crypto coins that with a market cap of 8.09 billion dollars is ranked 22 on CoinMarketCap.
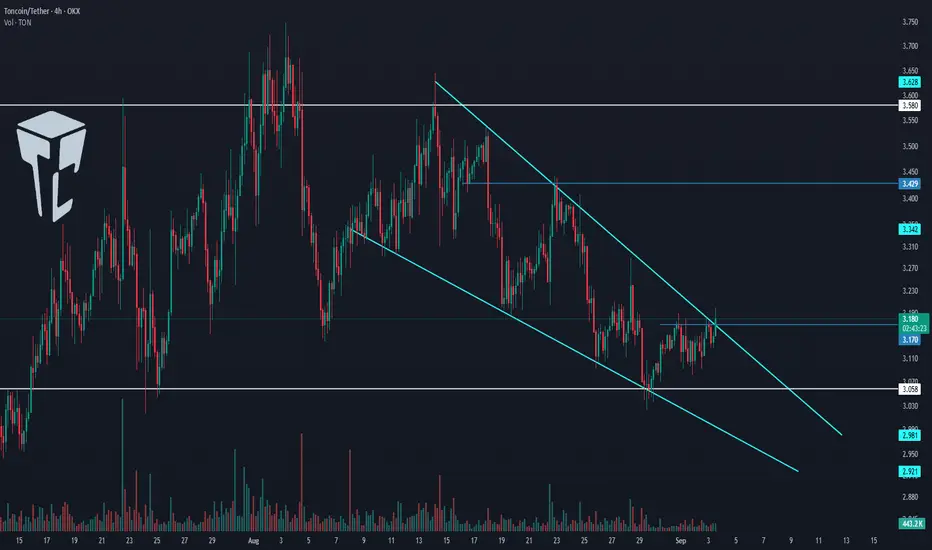
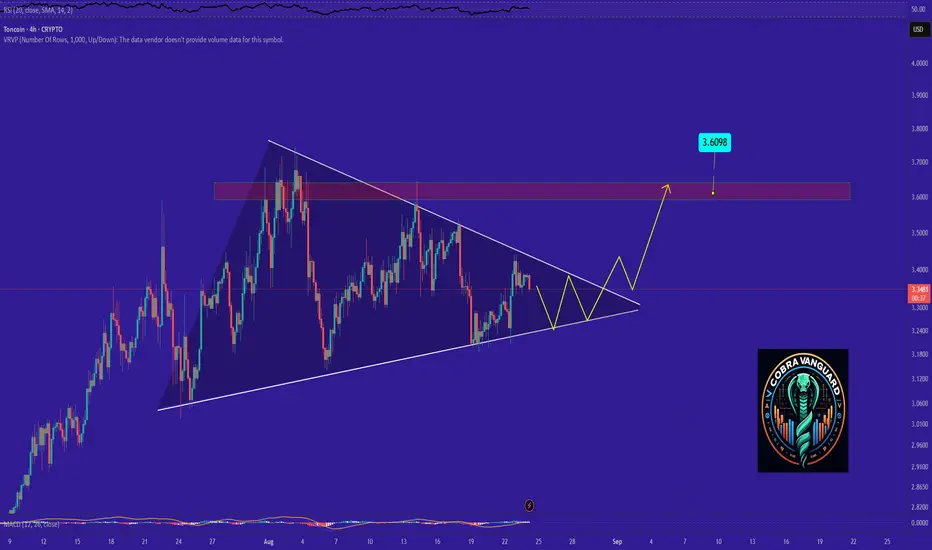
⏳ 4-Hour Timeframe
In the 4-hour timeframe this coin has formed a descending wedge and has reached the support of 3.058.
📊 Currently the price has reached the top of the wedge and if 3.170 is broken its upward movement can begin.
🧩 Considering that the price has reached the end of this wedge the reduction in volume is logical and with the breakout of the wedge whether from above or below a lot of volume will enter the market.
📈 If the wedge is broken from above and the 3.17 trigger is activated I will try to open a long position. Breaking this level can start a new upward leg in higher cycles.
🔔 In case of rejection from the top of the wedge and moving towards the 3.058 support if this level breaks the price can start a downward leg and even break the wedge from below.
📝 Final Thoughts
Stay calm, trade wisely, and let's capture the market's best opportunities!
This analysis reflects our opinions and is not financial advice.
Share your thoughts in the comments, and don’t forget to share this analysis with your friends! ❤️
TON/USDT — Descending Triangle at 0.618 Fibonacci Support!🔎 Overview
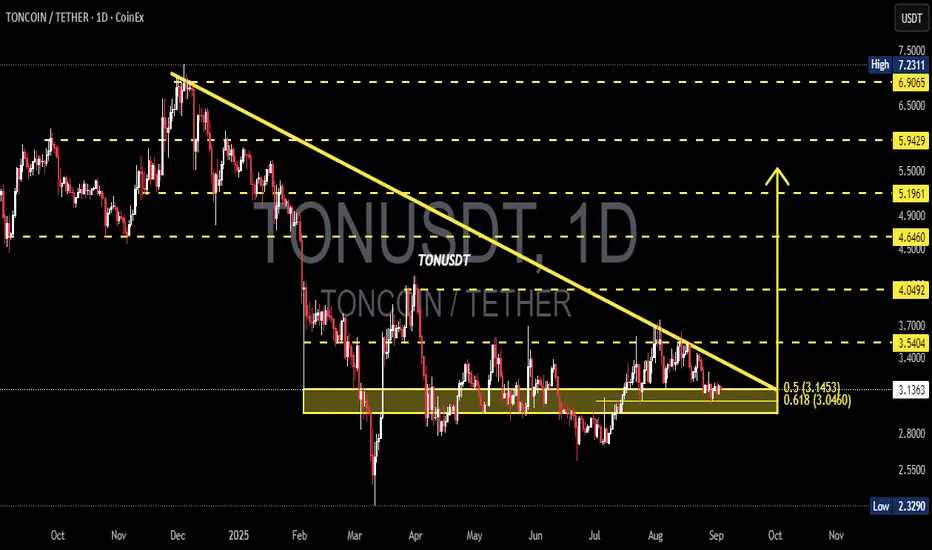
TON is currently standing at a make-or-break moment. The daily chart shows a Descending Triangle pattern, where price has been consistently pressured by a downward trendline from the early-year highs, while being strongly defended by the key support zone around 3.04 – 3.14 USDT (Fibonacci 0.5–0.618).
This setup reflects a battle between buyers accumulating at demand and sellers pressing from above. Such compression usually leads to a strong breakout or breakdown as price approaches the triangle’s apex.
---
📌 Key Technical Levels
Current Price: 3.1365 USDT
Main Support Zone:
0.618 Fib = 3.0460
0.5 Fib = 3.1453
First Resistance / breakout zone: 3.5404
Next Resistances: 4.0492 → 4.6460 → 5.1961 → 5.9429
Major Downside Support: 2.3290 (previous low)
---
🟢 Bullish Scenario (Breakout Potential)
1. Bullish confirmation occurs if price holds above 3.046 and breaks the descending trendline with a strong daily close + high volume.
2. Further validation: a close above 3.5404 will likely open the path toward 4.05 and 4.64.
3. With strong momentum, extended targets lie around 5.19 – 5.94, and eventually the major high near 7.23.
4. Narrative: A bullish breakout from a descending triangle often signals a trend reversal from accumulation.
---
🔴 Bearish Scenario (Breakdown Risk)
1. If price fails to hold above 3.0460 and closes below on the daily chart, the descending triangle confirms a bearish continuation.
2. First downside target: 2.80–2.60, with ultimate support near 2.3290.
3. If breakdown comes with strong volume, panic selling could accelerate the move lower.
4. Narrative: A bearish breakdown usually extends the prior downtrend, pushing price back to previous cycle lows.
---
📐 Pattern & Market Sentiment
Descending Triangle: A consolidation pattern within a downtrend; statistically bearish but can turn bullish if breakout volume is significant.
Volume Factor: Confirmation is critical. Breakouts without volume often lead to fake moves.
Golden Ratio Support (0.5–0.618 Fib): A historically strong support and reversal area — losing it would shift momentum back to the bears.
---
📢 Conclusion
TON stands right above its final line of defense (0.618 Fib). If this zone holds and the descending trendline is broken, bulls could ignite a move toward 3.54 – 4.05+. But if 3.046 fails, bears may drag TON back to the 2.32 lows.
In short: TON is at a “do or die” stage — expect a major breakout or breakdown soon.
---
TON/USDT is trapped inside a descending triangle with a critical support zone at Fibonacci 0.5–0.618 (3.14–3.04).
📉 Breakdown below 3.046 → risk of drop to 2.32
📈 Breakout above 3.54 → potential rally to 4.05 – 4.64
A decisive move is near — watch the volume for confirmation!
#TON #TONUSDT #Crypto #Altcoin #TradingView #TechnicalAnalysis #Fibonacci #DescendingTriangle #Breakout #SupportResistance #ChartPattern
TONUSDT 1H🔎 **Chart Context**
* Pair: **TON/USDT**
* Timeframe: **1H (Intraday)**
* Current price: **3.161**
* The market has been **range-bound** between **3.08 – 3.20**, with failed breakout attempts toward **3.286**.
* The chart projection suggests potential **downside continuation** after repeated rejections at resistance.
---
### 📊 **Key Observations**
1. **Market Structure**
* Recent swing high: **3.286**, sharp rejection.
* Lower highs forming: **3.208 → 3.204 → 3.188**, indicating **bearish pressure**.
* Supports tested multiple times at **3.093 – 3.111**, weakening with each touch.
2. **Support Zones**
* **3.093 – 3.111**: Current intraday support, repeatedly tested.
* **3.021 – 3.035**: Secondary support, next liquidity pool.
* **2.880 – 2.920**: Larger demand block (highlighted gray zone), key downside target if breakdown occurs.
3. **Resistance Zones**
* **3.180 – 3.200**: Immediate resistance, strong supply zone.
* **3.240 – 3.286**: High resistance cluster, capped prior rallies.
4. **Moving Averages**
* Price is trading **below intraday EMAs**, confirming **bearish bias**.
* The EMAs are acting as dynamic resistance across **3.18 – 3.20 zone**.
---
### 📈 **Bullish Scenario (Less Likely / Relief Rally)**
* TON defends **3.093 support** once more.
* Relief rally path:
* **TP1:** 3.180
* **TP2:** 3.200 (intraday supply)
* Only a sustained close above **3.200–3.240** would open the way for **3.286 retest**.
---
### 📉 **Bearish Scenario (Higher Probability)**
* Repeated failures at **3.188–3.200 resistance** combined with EMA pressure suggest further downside.
* Breakdown path:
* Break below **3.093** → sweep **3.021 – 3.035**
* Continuation target: **2.880 – 2.920 demand zone**
* This aligns with the projected chart path showing a dip toward the **2.9 region**.
---
### ⚡ **Trading Plan**
* **Short Setup (Preferred):**
* Entry: Rejection from 3.180 – 3.200 supply zone.
* TP1: 3.093
* TP2: 3.021 – 3.035
* TP3: 2.880 – 2.920
* Stop: Above 3.240
* **Long Setup (Countertrend):**
* Entry: Bounce confirmation at 3.093 – 3.021 zone.
* TP: 3.180 – 3.200
* Stop: Below 3.000

TON Market Update📊 CRYPTOCAP:TON Market Update
CRYPTOCAP:TON is showing signs of a potential Double Bottom pattern forming 📈
👉 However, this bullish setup will only be confirmed if price breaks out above the red resistance zone 🔴
⚠️ Without a confirmed breakout, sellers could still defend this zone and reject price.
👉 If breakout occurs, it would validate the Double Bottom and signal bullish continuation ✅

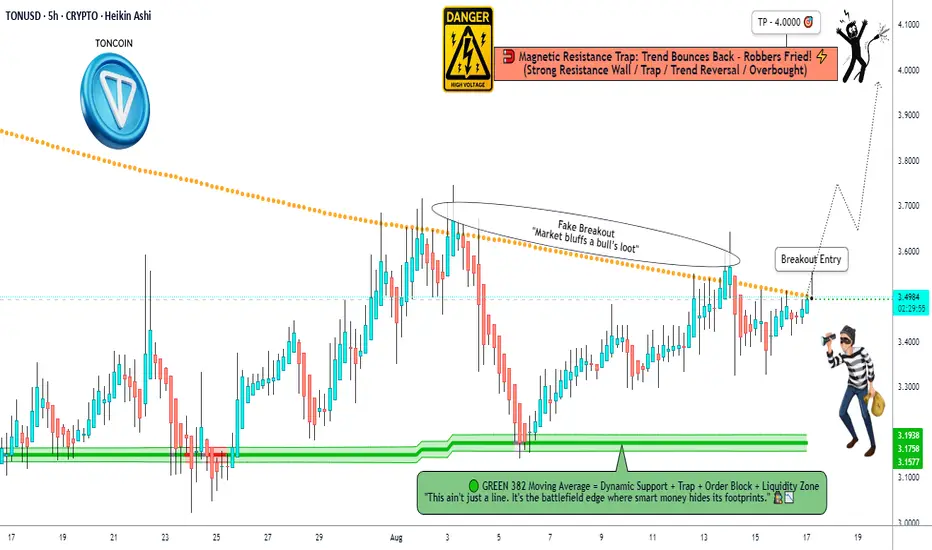
TON/USD Market Trap or Treasure? Decide Before 4.000!🚨TON/USD "TONCOIN vs U.S DOLLAR" Crypto Heist Plan 🚨
💎 Hello Thief OG’s, Money Grabbers & Market Shadows!
Today’s mission is locked 🔐 – we’re breaking into the TON/USD vault with a Bullish Heist Strategy.
🎯 Plan of Attack
Asset: TON/USD "TONCOIN vs U.S DOLLAR"
Mode: Bullish 🟢 (Heist in progress)
Entry (Thief Layers):
💰 Layer 1 @3.4900
💰 Layer 2 @3.4500
💰 Layer 3 @3.4000
💰 Layer 4 @3.3600
(You can add more layers – the deeper the vault, the sweeter the loot!)
Stop Loss (SL) 🛑: @3.2600 – This is the Thief Emergency Exit.
🔐 Adjust based on your own strategy & risk appetite.
Target (Escape Point) 🏆: @4.0000
⚡ “High Voltage Zone” ahead – escape with your loot before the alarms ring!
🕵️♂️ Thief Strategy Style
This is not a single-door entry – we’re layering multiple buy limit orders, stacking our positions like a true market bandit. 📊
Stay sharp – once the bags are full, we run with the profit! 🏃♂️💨
⚠️ Heist Rules for OG’s
Only rob the long side – trend is with the bulls. 🐂
Use trailing SL to protect stolen money 💵.
Don’t get caught in news traps – avoid new entries during 🔔 big announcements.
💥 Boost this plan 💥 if you’re riding with the Thief Crew!
Together, we rob the market – layer by layer, vault by vault. 💰🚀
📌 Disclaimer: This is a Thief Trading style heist plan, not financial advice. Trade with your own risk management.
TON 1D Analysis – Key Triggers Ahead💀 Hey , how's it going ? Come over here — Satoshi got something for you !
⏰ We’re analyzing TON on the 1-Day timeframe timeframe .
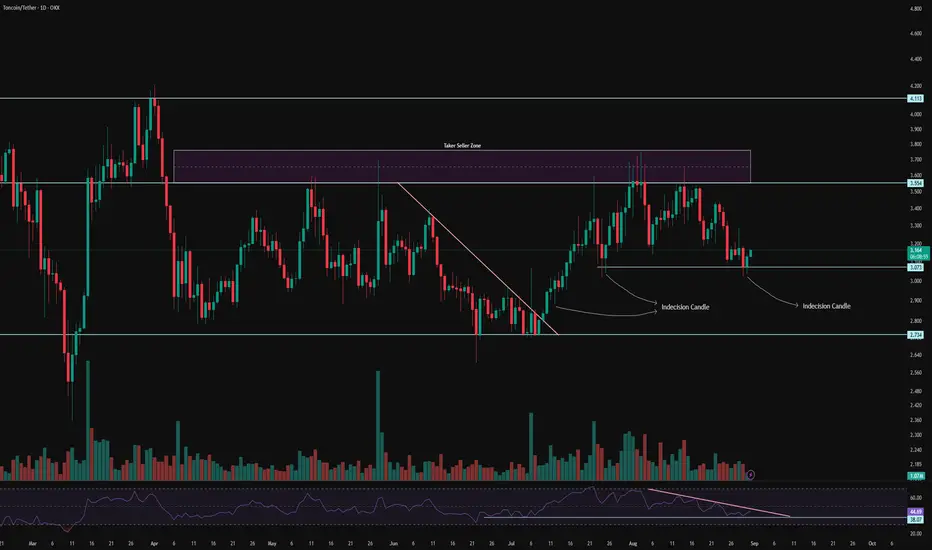
👀 On the daily timeframe of Toncoin, we can see that Toncoin has very high credibility in the crypto space, and recently even Snoop Dogg and Toncoin did an NFT drop together which was amazing. Toncoin is in a range with a box structure, with the top of this box at the $3.553 area and the bottom of this box at the $2.734 area. The price of Toncoin has been fluctuating inside this price box for about 150 days so far.
⚙️ This time, since we are analyzing the beloved coin of hearts, we try to use all the technicals we know. Our key RSI level is at 38, and a descending trendline has been drawn on this oscillator as well, which shows compression and reduced volatility. This means that Toncoin can soon break out of this compressed volatility. With increased volatility in the upcoming week, Toncoin could move upward.
🕯 Looking at Toncoin’s volume in the daily timeframe, we can see that after breaking its trendline, Toncoin broke out of its compression and showed a significant increase in volume for the bullish trend. The size and volume of green candles are larger compared to the red ones, and 50% of Toncoin holders are still keeping their coins and haven’t sold. The one-day indecision candles for Toncoin have been respected by buyers and each time have pushed the price upward.
💎💰 On the daily timeframe of TONBTC, we can see that after breaking its descending trendline, Toncoin experienced an upward trend and moved 25% higher, then it was rejected from the seller ticker area and moved toward the midline of its box. From this area, it has been supported by two indecision candles, but a compressed range structure has formed. With a breakout from this compression, Toncoin can experience other price levels.
🔔 To determine the alert zones for Toncoin, we look at the 4-hour multi-timeframe. On the 4-hour timeframe of Toncoin, we can see that a short-term resistance has formed at the $3.177 price level. With a breakout of this area, Toncoin can experience a short-term price recovery. This area seems to be a good level to observe price behavior.
❤️ Disclaimer : This analysis is purely based on my personal opinion and I only trade if the stated triggers are activated .
we shall see a good amount of increase in TON price !The triangle pattern will break in the direction it is breached, and the price will move in that direction. In my opinion, the price could be Bullish and may up to $4.
TONCOIN ; Will the pump price finally be fixed?Hello friends
Well, you see that after the decline we had, the price has reached the range that we have specified for you.
In this range, the price once attacked the ceiling of the range, but the failure was fake, which we have also specified.
Now, in this movement, the buyers must see again whether the range will finally be broken or not?
In the event of a valid failure of the trading range, the price can easily move to the specified resistances.
*Trade safely with us*

TON It will grow soon...The triangle pattern will break in the direction it is breached, and the price will move in that direction. In my opinion, the price could be Bullish and may up to $3.6.
Multiple altcoins · The 2025 bull market is onBIOUSDT:
Here we have three weeks closing green and the highest volume ever as Bitcoin retraces. No altcoin can grow this strongly if Bitcoin is now in a bear market. No altcoin would start a bullish wave if Bitcoin is entering correction mode. The only time the altcoins grow is when Bitcoin is rising or sideways within a bull market, at other times the altcoins drop. Seeing bullish altcoins confirms a bullish Bitcoin.
BTCUSDT:
Bitcoin has been red seven days, since 14-August. Is this the start of a major correction or a period of consolidation before higher? Consolidation before higher. The proof are the altcoins.
Here Bitcoin is still trading above EMA89. Last time this level worked as support.
Bitcoin can easily move sideways within a wide range, $100,000 to $120,000, and still support major bullish action across the entire market.
Bitcoin can also consolidate between $110,000 and $120,000. $112,000 is still holding as support. Above this price, Bitcoin is bullish even short-term.
ZECUSDT:
20-August is a higher low vs 7-April and then it goes bullish, a strong breakout with two full green candles. This candles are coupled with high volume, the highest since April.
The move broke EMA89 and EMA55 as resistance. MA200 was also conquered and immediately confirmed as support.
Two strong green days while Bitcoin is moving down. It reveals what is coming for Bitcoin.
HTUSDT:
HuobiToken (HT) goes up more than 280% since 20-August. The same 20-Aug. we just saw with Zcash. Is this the latest higher low date? Let's continue.
SKLUSDT:
Here we have the highest (buy) volume week ever last week as SKLUSDT broke above EMA55. This is happening after a new all-time low. Think about it.
The market bottoms and from the bottom we have the strongest buying ever and this is also coupled with the break of a long-term resistance level. We can easily say Skale Network hit bottom and is ready to grow. While Bitcoin retraces, here we have another very strong bullish breakout, this only happens within a bull market.
Toncoin:
Clearly, a long-term rising trend. TONUSDT is trading above all the short-term moving averages; EMA8/13/21 weekly, the bulls are in.
There are many pairs like this, hundreds literally.
Remember we also saw the big ones: Cardano, Chainlink, XRP, Solana and Ethereum. Look at where Binance Coin is at right now and don't forget Tron, it is all going up.
The smaller projects are yet to catch up, yet to move; the entire market is yet to grow, but here we have proof enough that shows the 2025 bull market is on.
Namaste.

HODL BASKETHello friends
You see the meme coin Natcoin on the weekly time frame that has an important resistance and a good support.
Now, to buy this currency, we must wait for a valid break of the resistance and then the price can move to the specified targets.
Note that the specified support is very important and for the price to rise, both the support and the resistance need to be maintained.
Be sure to observe risk and capital management.
*Trade safely with us*

A rise above 3.725 could start a new bullish wave
Hello, fellow traders!
Follow me to get the latest information quickly.
Have a great day.
-------------------------------------
The original TON coin (token) failed, and this is the TON coin that was acquired and rebuilt.
Therefore, there are currently two TON coins, so it's recommended to verify them before trading.
This TON coin was acquired and rebuilt by Coinbase Ventures.
-
(TONUSDT 1D chart)
If the price holds above 3.725, there's a possibility of an upward trend as it breaks above the 4.059-4.668 range.
Therefore, the key question is whether it can find support at 3.440-3.725 and continue upward.
If not,
1st: 3.161
2nd: 2.641-2.900
Check for support near the 1st and 2nd levels above.
If possible, it's best to confirm that the price holds above the M-Signal indicator on the 1W chart before entering a trade.
-
(1W chart)
If the price rises above 3.725, there's a possibility of a sharp rise as there are no support or resistance levels.
Currently, the volume profile is forming in the 5.770-6.391 range, so there's a possibility that it will rise to that level.
-
Thank you for reading.
I wish you successful trading.
--------------------------------------------------
- Here's an explanation of the big picture.
(3-year bull market, 1-year bear market pattern)
I'll explain more in detail when the bear market begins.
------------------------------------------------------

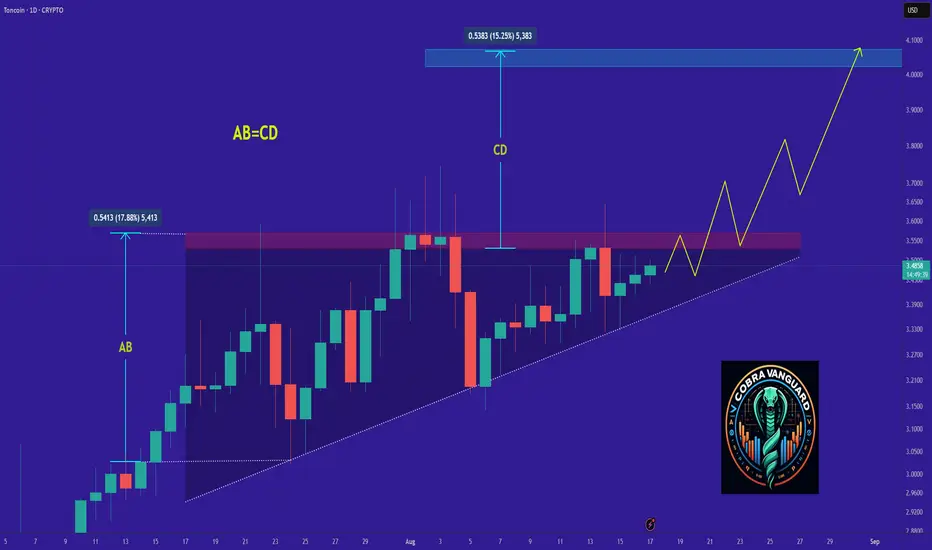
TON's Situation, A Comprehensive Analysis !!!The price on the Daily timeframe is within an ascending triangle, which can be promising. If the price breaks this pattern with bullish candles, it could easily rise by the distance of AB=CD .
Best regards CobraVanguard.💚
TONCOIN could move 60% from here the key levels to watchCRYPTOCAP:TON is holding above a strong support zone at $2.40–$2.70, showing buyers are defending this level well.
Price is moving higher without facing major resistance immediately ahead.
If momentum continues, it could aim for the $5.00–$5.50 zone next, while a drop below $2.40 would weaken the bullish outlook.
DYOR, NFA

#TON/USDT#TON
The price is moving within an ascending channel on the 1-hour frame, adhering well to it, and is on its way to break it strongly upwards and retest it.
We have support from the lower boundary of the ascending channel, at 3.05.
We have a downtrend on the RSI indicator that is about to break and retest, supporting the upside.
There is a major support area in green at 3.03, which represents a strong basis for the upside.
Don't forget a simple thing: ease and capital.
When you reach the first target, save some money and then change your stop-loss order to an entry order.
For inquiries, please leave a comment.
We have a trend to hold above the 100 Moving Average.
Entry price: 3.20.
First target: 3.40.
Second target: 3.53.
Third target: 3.70.
Don't forget a simple thing: ease and capital.
When you reach your first target, save some money and then change your stop-loss order to an entry order.
For inquiries, please leave a comment.
Thank you.

Toncoin · Updated Targets · $11.95, $17.88 & $23.82 (PP: 600%)The consolidation period can continue with varied price swings, it is a mistake to think that bullish action must develop the following day. Yes, it has been going for more than six months but there tends to be a period of 8-10 months between each bullish wave. Minor or major. There is always a pause in between cycles.
We are looking at Toncoin on the weekly timeframe. Notice how the action is happening below EMA55. This is a bearish signal. TONUSDT is consolidating and we know it will grow but the long-term bullish bias is not yet confirmed. We know it will grow based on past experience, marketwide action and dozens of reversal signals.
Toncoin will grow, a massive bullish cycle. I updated the targets as promised and these are still conservative but stronger than the previous set.
These numbers work long-term and for the life of the project as long as the action is happening below. So these are always good.
Toncoin as TONUSDT is aiming first at $4.62 followed by $6. The dynamics around these levels can be similar to what we saw with XRPUSDT.
The last high, $8.28, can break easily once bullish momentum is strong. There can always be a retrace and some consolidation followed by additional growth. Late 2025 and we start to hit our targets.
You will see Toncoin easily trading at $11.95. Additional targets with a high probability to hit in the coming months are $17.88 and $23.82. Total profits potential goes beyond 600% to the final target.
Thank you for reading.
Namaste.

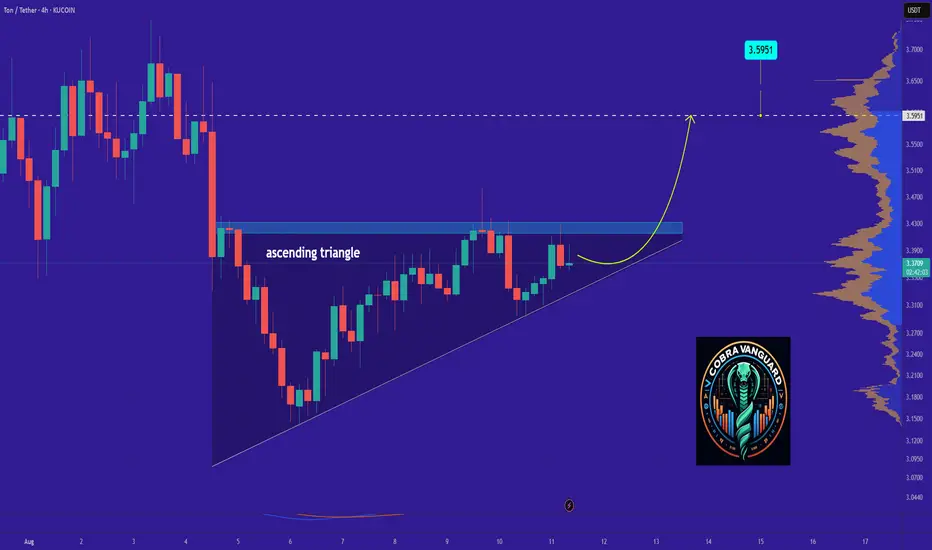
TON is bullish now and many Traders don't see it !The price on the 4h timeframe is within an ascending triangle, which can be promising. If the price breaks this pattern with bullish candles, it could easily rise by the distance of AB=CD .
Best regards CobraVanguard.💚
TON Setup – Pullback to Support After 15% SurgeToncoin (TON) has climbed over 15% since our last trade. Price is now pulling back into a key support zone, potentially forming a base for the next upward leg.
📌 Trade Setup:
• Entry Zone: $3.20 – $3.30
• Take Profit Targets:
o 🥇 $3.60
o 🥈 $4.00
• Stop Loss: $3.08
TON : Does the TON ecosystem have growth potential?Hello friends🙌
✅Given the decline we had in the entire market, TON was no exception and had a decline that has plunged the market into fear as to whether the decline will continue or whether the price will finally grow.
✅Well, as you can see, there is still no sign of serious buyers on the chart, and we are planning based on observations, not assumptions...
✅In this chart, the price is likely to move to the support area specified by Fibonacci and buyers will show their support, but what is the best way?
✅The best way to buy safely and with capital and risk management is in steps, where we have specified the purchase steps for you and the goals are also specified.
🔥Follow us for more signals🔥
*Trade safely with us*
TONCOIN - Technical pictureTechnical picture
All key indicators, including RSI (≈56), STOCH, MACD, ADX and others, signal Buy. There is not a single "Sell" signal or
Moving averages on all timeframes (from MA5 to MA200) also give a stable Buy, without "Sell" signals
Pivot levels:
Current Pivot: $3.4271
Resistance: $3.4436 (R1), then $3.4629 and $3.4794
Conclusion: the overall sentiment is confidently bullish.
Additional signals:
Analysis by indicators: 1 Sell, 7 Neutral, 17 Buy - final signal: Strong Buy
Among the oscillators - 5 Buy signals, 5 Neutral, 0 Sell.
Moving Averages: 12 Buy, 2 Neutral, 1 Sell
Chart Shapes and Patterns
According to OKX Europe, Toncoin has exited a descending triangle, which often indicates a trend reversal
Support: $2.60 and $3.00. Resistance: $3.50 and $3.70
Upside Potential and Key Levels
Cryptodamus's final article emphasizes that the $4.00 zone (100-day MA) is key: a break above it could open the way to $5.48, and a failure to $2.90
Binance Square outlines immediate targets: $3.95-4.00, then $4.20-4.30, and a possible move to $4.50+ if the $3.91 level is broken

TON is bearish now and many Traders don't see it !The fact that most cryptocurrencies are bearish while Toncoin hasn't seen a significant drop yet is somewhat suspicious, and sooner or later, the price is likely to fall. I expect the price to be bearish by the start of the new week.
