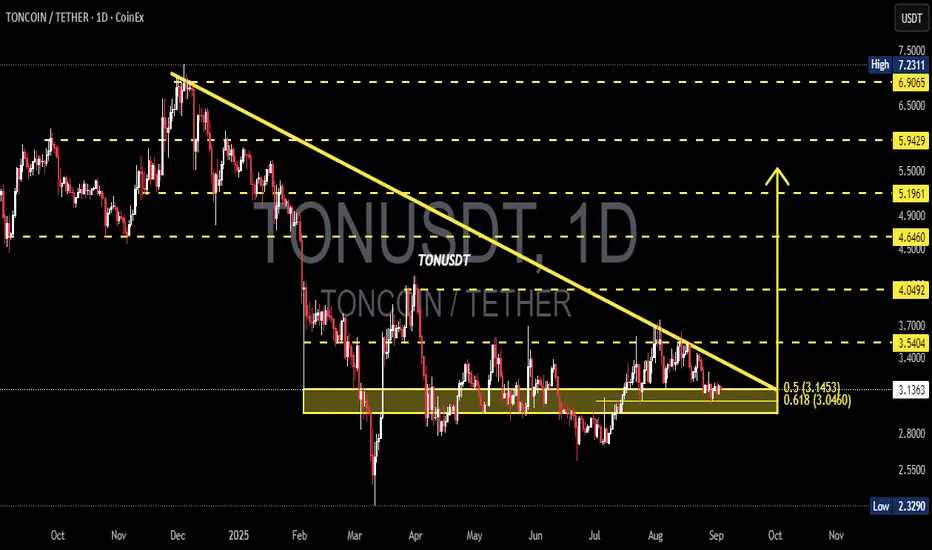
TON/USDT — Descending Triangle at 0.618 Fibonacci Support!🔎 Overview
TON is currently standing at a make-or-break moment. The daily chart shows a Descending Triangle pattern, where price has been consistently pressured by a downward trendline from the early-year highs, while being strongly defended by the key support zone around 3.04 – 3.14 USDT (Fibonacci 0.5–0.618).
This setup reflects a battle between buyers accumulating at demand and sellers pressing from above. Such compression usually leads to a strong breakout or breakdown as price approaches the triangle’s apex.
---
📌 Key Technical Levels
Current Price: 3.1365 USDT
Main Support Zone:
0.618 Fib = 3.0460
0.5 Fib = 3.1453
First Resistance / breakout zone: 3.5404
Next Resistances: 4.0492 → 4.6460 → 5.1961 → 5.9429
Major Downside Support: 2.3290 (previous low)
---
🟢 Bullish Scenario (Breakout Potential)
1. Bullish confirmation occurs if price holds above 3.046 and breaks the descending trendline with a strong daily close + high volume.
2. Further validation: a close above 3.5404 will likely open the path toward 4.05 and 4.64.
3. With strong momentum, extended targets lie around 5.19 – 5.94, and eventually the major high near 7.23.
4. Narrative: A bullish breakout from a descending triangle often signals a trend reversal from accumulation.
---
🔴 Bearish Scenario (Breakdown Risk)
1. If price fails to hold above 3.0460 and closes below on the daily chart, the descending triangle confirms a bearish continuation.
2. First downside target: 2.80–2.60, with ultimate support near 2.3290.
3. If breakdown comes with strong volume, panic selling could accelerate the move lower.
4. Narrative: A bearish breakdown usually extends the prior downtrend, pushing price back to previous cycle lows.
---
📐 Pattern & Market Sentiment
Descending Triangle: A consolidation pattern within a downtrend; statistically bearish but can turn bullish if breakout volume is significant.
Volume Factor: Confirmation is critical. Breakouts without volume often lead to fake moves.
Golden Ratio Support (0.5–0.618 Fib): A historically strong support and reversal area — losing it would shift momentum back to the bears.
---
📢 Conclusion
TON stands right above its final line of defense (0.618 Fib). If this zone holds and the descending trendline is broken, bulls could ignite a move toward 3.54 – 4.05+. But if 3.046 fails, bears may drag TON back to the 2.32 lows.
In short: TON is at a “do or die” stage — expect a major breakout or breakdown soon.
---
TON/USDT is trapped inside a descending triangle with a critical support zone at Fibonacci 0.5–0.618 (3.14–3.04).
📉 Breakdown below 3.046 → risk of drop to 2.32
📈 Breakout above 3.54 → potential rally to 4.05 – 4.64
A decisive move is near — watch the volume for confirmation!
#TON #TONUSDT #Crypto #Altcoin #TradingView #TechnicalAnalysis #Fibonacci #DescendingTriangle #Breakout #SupportResistance #ChartPattern
Tonusdtidea
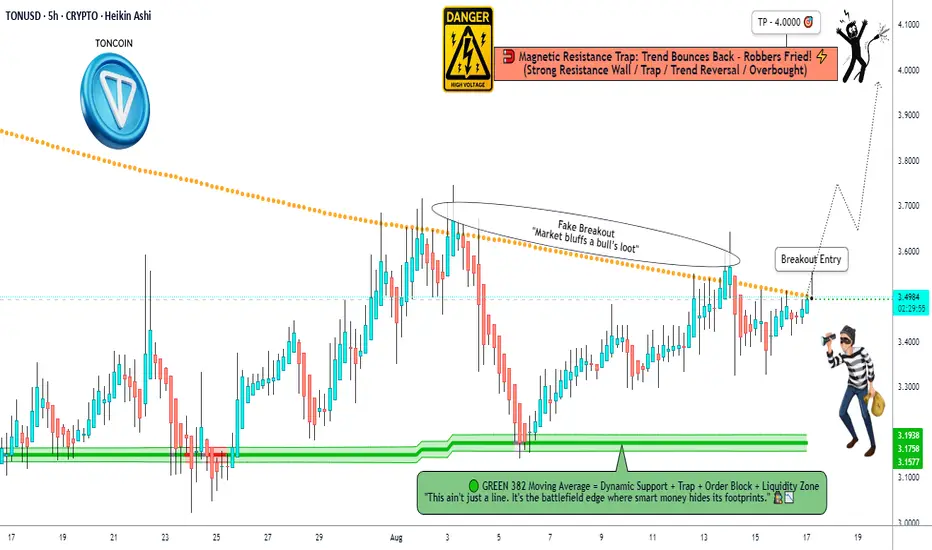
TON/USD Market Trap or Treasure? Decide Before 4.000!🚨TON/USD "TONCOIN vs U.S DOLLAR" Crypto Heist Plan 🚨
💎 Hello Thief OG’s, Money Grabbers & Market Shadows!
Today’s mission is locked 🔐 – we’re breaking into the TON/USD vault with a Bullish Heist Strategy.
🎯 Plan of Attack
Asset: TON/USD "TONCOIN vs U.S DOLLAR"
Mode: Bullish 🟢 (Heist in progress)
Entry (Thief Layers):
💰 Layer 1 @3.4900
💰 Layer 2 @3.4500
💰 Layer 3 @3.4000
💰 Layer 4 @3.3600
(You can add more layers – the deeper the vault, the sweeter the loot!)
Stop Loss (SL) 🛑: @3.2600 – This is the Thief Emergency Exit.
🔐 Adjust based on your own strategy & risk appetite.
Target (Escape Point) 🏆: @4.0000
⚡ “High Voltage Zone” ahead – escape with your loot before the alarms ring!
🕵️♂️ Thief Strategy Style
This is not a single-door entry – we’re layering multiple buy limit orders, stacking our positions like a true market bandit. 📊
Stay sharp – once the bags are full, we run with the profit! 🏃♂️💨
⚠️ Heist Rules for OG’s
Only rob the long side – trend is with the bulls. 🐂
Use trailing SL to protect stolen money 💵.
Don’t get caught in news traps – avoid new entries during 🔔 big announcements.
💥 Boost this plan 💥 if you’re riding with the Thief Crew!
Together, we rob the market – layer by layer, vault by vault. 💰🚀
📌 Disclaimer: This is a Thief Trading style heist plan, not financial advice. Trade with your own risk management.
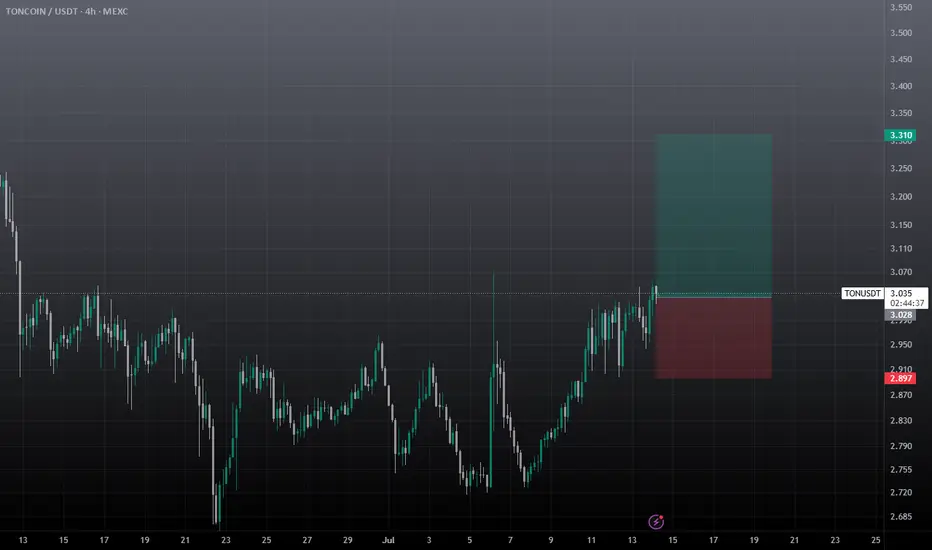
Ton USDT Buy Setup / Long SetupTon entry at current market price 3.305 , SL if 1 day closes below the mentioned zone. Otherwise holding ton for breakout towards 4-4.5$. use low risk amount as BTC can retrace.

Ton USDT Intraday Setup / Long SetupTake with tight SL, an easy 2RR, take it at cmp (Current Market Price), While if you holding spot bag, it can easily hit 4.5-5$ mark in this week. Best Of Luck
TONCOIN Preparing for Liftoff from the Golden Zone! Potential UpDetailed Breakdown:
🔶 Major Support Zone (Golden Accumulation Area):
TON is currently trading within a strong support zone between 2.839 - 2.300, which previously acted as a key resistance throughout 2023. This zone now serves as a high-probability accumulation area.
🔶 Double Bottom Structure & Reversal Potential:
The price action is forming a potential double bottom pattern, often signaling a major reversal after a prolonged downtrend. This is also supported by sideways consolidation on the support with decreasing selling momentum.
🔶 Bullish Targets (Based on Fibonacci & Historical Resistance):
If a bounce occurs from this golden support area, TON could rally towards the following key resistance levels:
🎯 Target 1: 3.247
🎯 Target 2: 4.087
🎯 Target 3: 4.798
🎯 Target 4: 5.879
🎯 Target 5: 6.865
🎯 Target 6: 7.932
🎯 Ultimate Target (ATH): 8.283
🔶 Maximum Potential Upside:
From the current level (around 2.839) to the all-time high (8.283), TON presents a +190% upside opportunity in a full bullish scenario.
Trading Strategy:
✅ Buy Zone: Accumulate within the golden support box (2.3 - 2.8 USDT)
🔁 Additional Entry: Upon breakout confirmation above 3.25 USDT
❌ Stop Loss: Below 2.2 USDT with strong bearish volume
📈 Take Profit Levels: Use resistance levels as partial TP targets
Conclusion:
TONCOIN is positioned at a technically significant support area, offering a high-risk-reward opportunity for swing traders and mid-term investors. A bullish reaction from this zone could initiate a strong multi-wave rally. Watch for breakout confirmation with volume before entering aggressively.
#TON #TONCOIN #CryptoBreakout #AltcoinSetup #TONUSDT #SwingTrade #BullishPattern #CryptoSignals #FibonacciLevels #TechnicalAnalysis

TONUSDT 1D AnalysisTON ~ 1D Analysis
#TON Buy back gradually from here with a short term target of at least 15%+, Long term target $8
TONUSDT 1D AnalysisTON ~ 1D Analysis
#TON Buy after successfully breaking this resistance line with a short term target of at least 15%+ from here.

TONUSDT 3DTON ~ 3D Analysis
#TON Buy back when testing this support with a short -term target of at least 20%+.

TON Forms Inverse Head & Shoulders – Breakout Imminent?CRYPTOCAP:TON is forming a textbook Inverse Head & Shoulders pattern, a strong bullish reversal signal. The price is currently testing the neckline around the $3.90–$4.00 zone. A successful breakout and daily close above this level could confirm the pattern and trigger a move toward the $4.80–$5.20 resistance area.
Bullish Confirmation: Neckline breakout with volume.
Invalidation : close below 3.5
DYOR, NFA

TONUSDT 3DTON ~ 3D Analysis
#TON Support blocks that you might be able to consider to start buying again from here, with a short -term target of at least 15%+.

TONUSDT 2DTON ~ 2D Analysis
#TON Buy gradually from here. This is a very good buy place for now. With a short -term target of at least 15%+.

TONUSDT 3DTON ~ 3D
#TON If you still have Conviction on this coin,. buy gradually within this support block with a target of at least 20%+

A big TON by MastaCrypta!Aiming for smol scalps. Going above the orange line gone, coming to the yellow line - yess, cominh to the white line, OHHHHYEAHHH

TONUSDT 3DTON ~ 3D
#TON This is a bullish pattern,. Buy gradually inside this pattern,. with a target of at least 20%+ from here. it is only a matter of time that this resistance line is successfully penetrated.

TONUSDTTON ~ 1D
#TON You can pay attention to this Support Block. Maybe a small purchase on this support Block is very interesting with a target of 20%++

TONUSDTTON ~ 1D ✅
#TON You can pay attention to this Support Block. Maybe a small purchase on this support Block is very interesting with a target of 20%++

TON Looking to Close the Gap! This Trade Setup Takes AdvantageTON is showing great support along the ascending support line. The last three bars are confirmation bars supporting the bias that the pattern will continue. We're approaching previous highs from early 2023/2022 around $2.70, a resistance zone that stands in the way of the bullish price action.
How do we trade this?
The price currently trending upward and showing support along the ascending support line. RSI is above the moving average and there's a gap to the top of the resistance zone. But what about the resistance zone? From a trade management perspective, we have a 1:2 Risk/Reward ratio and the probability of profit on our side. It's reasonable to long here, setting a protective stop around $2.27 and a take profit around $2.70.
Key Points
1. Ascending Triangle, Long Bias.
2. Multiple Buy Signal bars on Support.
3. Gap to Previous High of $2.70, Top of Resistance Zone.
4. RSI around 55 and above the moving average, supports Long BIAS.
You are solely responsible for your trades, trade at your own risk!
Let us know what you think in the comment section below!

TONUSDT Elliott Waves Analysis (LONGTERM)Hello friends.
Please support my work by clicking the LIKE button👍(If you liked). Also i will appreciate for ur activity. Thank you!
Everything on the chart.
Entry: market and lower
Targets: 2 - 3 - 3.5
after first target reached move ur stop to breakeven
Stop: ~0.8 (depending of ur risk). ALWAYS follow ur RM .
RR: 1 to 5
risk is justified
Good luck everyone!
Follow me on TRADINGView, if you don't want to miss my next analysis or signals.
It's not financial advice.
Dont Forget, always make your own research before to trade my ideas!
Open to any questions and suggestions
