Top-5 tips for Top-Down Multiple Time Frame Analysis Trading
I am trading multiple time frame analysis for many years. After reviewing trading ideas from various traders on Tradingview, I noticed that many traders are applying that incorrectly
In this article, I will share with you 5 essential tips , that will help you improve your multiple time frame analysis and top-down trading.
The Order of Analysis Matters
Multiple time frame analysis is also called top-down analysis for a reason. When you trade with that, you should strictly start your analysis with higher time frames and then dive lower, investigating shorter-term time frames.
Unfortunately, most of the traders do the opposite . They start from a lower time frame and finish on a higher one.
Above are 3 time frames of EURGBP pair: daily, 4h, 1h.
To execute multiple time frames analysis properly, start with a daily, then check a 4h and only then the hourly time frame.
Limit the Number of Time Frames
Executing multiple time frame analysis, many traders analyse a lot of time frames.
They may start from a weekly and finish on 5 minute time frame, going through 5-8 time frames.
Remember that is it completely wrong . For execution of a multiple time frame analysis, it is more than enough to analyse 3 or even 2 time frames. Adding more time frames will overwhelm your analysis and make it too complex.
Analyse Particular Time Frames
Your multiple time frame analysis should be consistent and rule-based. It means that you should strictly define the time frames that you analyse.
For example, for day trading, my main trading time frames are daily, 4h, 1h. I consistently analyse ONLY these trading time frames and I look for day trades only analysing this combination of time frames.
Higher is the time frame, stronger the signal it provides
Trading with multiple time frame analysis, very often you will encounter controversial signals: you may see a very bullish pattern on a daily and a very bearish confirmation on 30 minutes time frame.
Always remember that the higher time frames confirmations are always stronger , and their accuracy and probability is always higher.
Above there are 2 patterns:
a head and shoulders pattern on a daily time frame with a confirmed neckline breakout, and an inverted head and shoulders pattern on a 4h time frame with a confirmed neckline breakout.
2 patterns give 2 controversial signals:
the pattern on a daily is very bullish and the pattern on a 4h is very bearish.
The signal on a daily time frame will be always stronger ,
so it is reasonable to be on a bearish side here.
You can see that the price dropped after a retest of a neckline of a head and shoulders on a daily, completely neglecting a bullish pattern on a 4H.
Each Time Frame Should Have Its Purpose
You should analyse any particular time frame for a reason.
You should know exactly what you are looking for there and what is the purpose of your analysis.
For example, for day trading, I analyse 3 time frames.
On a daily, I analyse the market trend and key levels.
On a 4H time frame, I analyse candlesticks.
On an hourly time frame, I look for a price action pattern as a confirmation.
On GBPAUD on a daily, I see a test of a key horizontal resistance.
On a 4H time frame, the price formed a doji candle.
On an hourly, I spotted a double top, giving me a bearish confirmation.
These trading tips will increase the accuracy of your multiple time frame analysis. Study them carefully and adopt them in your trading.
❤️Please, support my work with like, thank you!❤️
I am part of Trade Nation's Influencer program and receive a monthly fee for using their TradingView charts in my analysis.
Topdownanalysis
Top-Down Analysis Strategy: How I Open and Manage TradesLearn how I use top-down analysis from senior to junior timeframes to find high-probability entry points and confidently follow through on trades.
On the weekly chart, I identify point A and the presumed point B — this is my idea. Then, gradually shifting through the timeframes, I need to confirm this idea. I get confirmation when volume appears on the chart.
On the daily chart, I note the formation of a new trading range, which arises as a result of the interaction of the price with the key level. I determine the POI in the form of a daily FVG — my idea is confirmed, and the price is ready to move towards point B.
I also note the daily SNR as a potential zone of interest. If the price reacts to the SNR, it will mean that I am working in a strong trend. If the reaction occurs on the FVG, the movement simply continues along the trend.
If you are interested in the topic of working in ranges, write in the comments — I will definitely cover it.
As a result of the daily SNR test, the price confirms the presence of volume through the formation of a 4-hour True SNR. You can open a position from it with a limit order with a target beyond point B and fix the risk/profit ratio at 1:2.
If you found this article interesting and my method useful, I would appreciate your support — please like, share, and help promote this article so that it reaches more traders.

XAUUSD - Top Down Analysis8th consecutive week of gains. The previous metal is due for a pullback but I have no way of managing risk when it comes to short selling. So if I were to short it, it would be a quick scalp and somewhat of a gamble. Trade it at your own risk.

GBPUSD Q3 W40 D29 Y25 – Full Top Down Analysis+3% Return📊 GBPUSD Q3 W40 D29 Y25 – Full Top Down Analysis ✅ +3% Return
📉 Daily: 50 EMA confirming short bias
⏳ 4H: 50 EMA + Order Block in line with structure (LLs & LHs)
🧩 4H → 1H / 15’: Order Block refinement across lower TFs
🔑 1H: Break of Structure (BOS)
⏱ 15’: Order Block reaction → Short entry
🕔 5’: Order Block formed at highs after 15’ short move
⏱ 1’: BOS before retest of 5’ Order Block
🎯 Execution: Sell Limit triggered
💰 Result: 1:3 RRR secured → +3% banked
— FRGNT 🚀
🔍 Analysis Approach:
I’m applying Smart Money Concepts, focusing on:
Identifying Points of Interest on the Higher Time Frames (HTFs) 🕰️
Using those POIs to define a clear trading range 📐
Refining those zones on Lower Time Frames (LTFs) 🔎
Waiting for a Break of Structure (BoS) for confirmation ✅
This method allows me to stay precise, disciplined, and aligned with the market narrative, rather than chasing price.
💡 My Motto:
"Capital management, discipline, and consistency in your trading edge."
A positive risk-to-reward ratio, paired with a high win rate, is the backbone of any solid trading plan 📈🔐
⚠️ Losses?
They’re part of the mathematical game of trading 🎲
They don’t define you — they’re necessary, they happen, and we move forward 📊➡️
🙏 I appreciate you taking the time to review my Daily Forecast.
Stay sharp, stay consistent, and protect your capital
— FRNGT 🚀
FX:GBPUSD

GBPJPY - Top Down Analysis== IN SUMMARY ==
Basically just waiting for the PCE report from the US to be released.
As of recently the US has been continuing to show signs of economic improvement including yesterday's GDP, Initial Jobless Claims and the early PCE report.
If today's report shows inflation still hot, I'm expecting the Yen to strengthen, US equities to decline and the British Pound to also decline.
Furthermore, Trump did announce yesterday a 100% tariff on branded pharmaceutical imports, effective October 1, which could add further inflationary pressure and weigh on global risk assets like equities while bolstering the USD in the short term.
This move, part of his broader tariff escalation, risks amplifying supply chain disruptions but aligns with the resilient US data we've seen—Q2 GDP revised up to 3.8% annualized growth (from 3.3%), driven by strong consumer spending and a narrowing trade deficit.
Initial Jobless Claims also dropped sharply to 218K for the week ending September 20, signaling a tight labor market and low layoff risks.

BTCUSD - Top Down AnalysisClear as day Bitcoin is going higher. Just remember information and opinions contained in this video are for educational purposes only.
That's it - That's all - Trade Safe

USD/JPY - Forecast 🕰 Weekly View
Price is ranging under 148–150 weekly resistance while holding above the 142–144 weekly demand zone. If demand continues to hold, we could see a push back toward the 156–158 target. A clean break below 142 would invalidate this outlook.
📉 Daily Structure
Major Resistance: 148–150 supply block
Major Support: 142–144 demand zone
Price is coiling between mid-range weak support and overhead resistance, building liquidity for the next move.
⏱ 8H Breakdown
On the 8H, price is capped under the descending trendline. Refined demand sits around 144–145. A sweep into this level could fuel the next bullish continuation. Breakout above 150 opens the road directly into 156–158.
🔎 Outlook
Short-term pullback still possible → but overall structure favors a mid-term bullish continuation targeting 156–158.
Bias: Short-term pullback → mid-term bullish.

EURCHF Full Top Down Analysis,Weekly - 1' Q3 W37 D9 Y25EURCHF Full Top Down Analysis,Weekly - 1' Q3 W37 D9 Y25
Full EURCHF ANALYSIS

DXY Top-Down Analysis: Market Structure & Directional Bias This video demonstrates a top-down analysis of DXY. I'll show you how to identify market structure, value areas, directional bias, and key support and resistance levels. You'll learn to analyze the market from weekly to hourly timeframes using Heikin-Ashi candles and the 200 EMA.

GU-Wed-23/07/25 TDA-Cluster of PMI news now, watch out!Analysis done directly on the chart!
Premise:
A simple idea plan (like Tradingview public posts) won't describe everything.
No one can predict how market will move, it's always good to react to how it moves.
It gives an idea of how price might move, but no one come from FUTURE.
So I always encourage people to openly and actively discuss in real time.
I don't give signals blindly, people should learn
and understand the skill.
Following blindly signals you won't know how to
manage the trade, where precisely put sl and tp,
lot size and replicate the move over time.
That's why you need active real time discussions.
Trading is not get rich quick scheme!
Active in London session!
Not financial advice, DYOR.
Market Flow Strategy
Mister Y

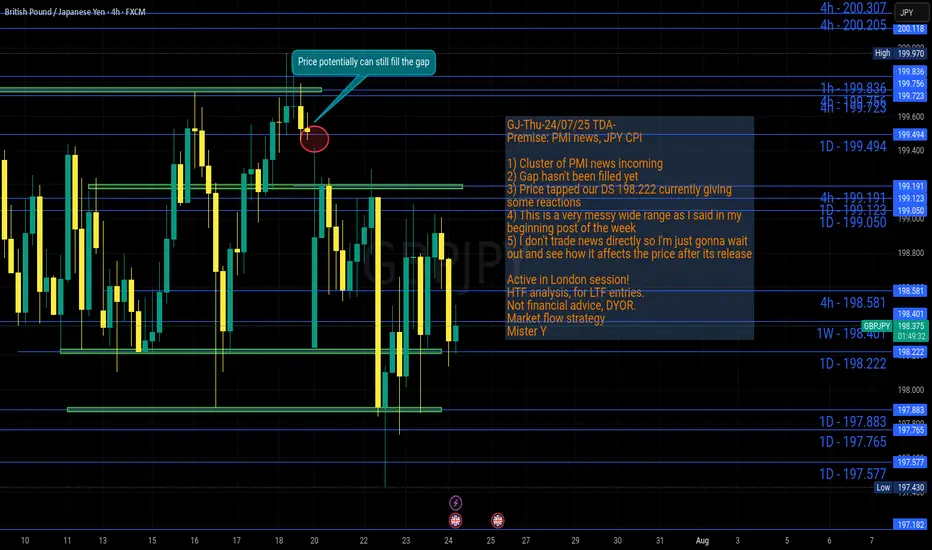
GJ-Thu-24/07/25 TDA-Messy wide range, gap hasn't been filled yetAnalysis done directly on the chart!
Premise:
A simple idea plan (like Tradingview public posts) won't describe everything.
No one can predict how market will move, it's always good to react to how it moves.
It gives an idea of how price might move, but no one come from FUTURE.
So I always encourage people to openly and actively discuss in real time.
I don't give signals blindly, people should learn
and understand the skill.
Following blindly signals you won't know how to
manage the trade, where precisely put sl and tp,
lot size and replicate the move over time.
That's why you need active real time discussions.
Trading is not get rich quick scheme!
Active in London session!
Not financial advice, DYOR.
Market Flow Strategy
Mister Y
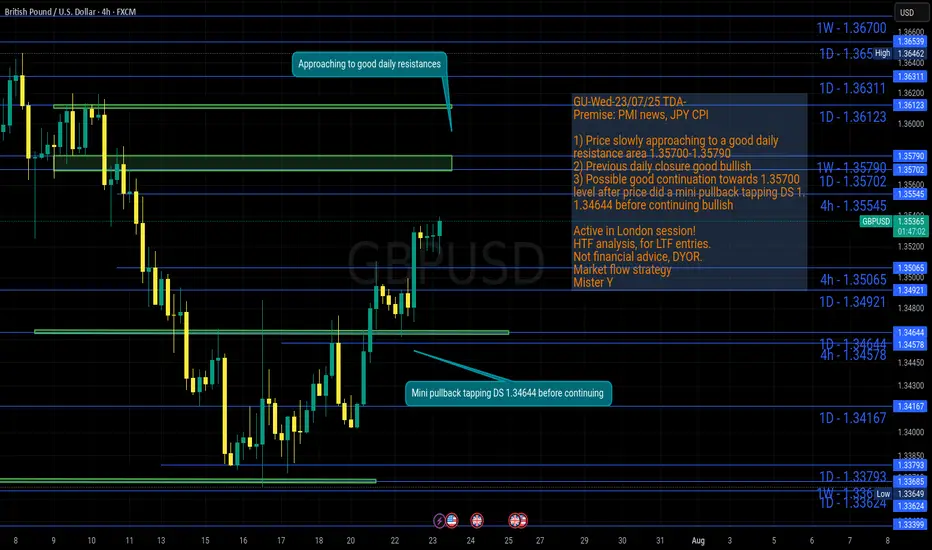
GU-Wed-23/07/25 TDA-GU approaching to a good resistance zoneAnalysis done directly on the chart!
Premise:
A simple idea plan (like Tradingview public posts) won't describe everything.
No one can predict how market will move, it's always good to react to how it moves.
It gives an idea of how price might move, but no one come from FUTURE.
So I always encourage people to openly and actively discuss in real time.
I don't give signals blindly, people should learn
and understand the skill.
Following blindly signals you won't know how to
manage the trade, where precisely put sl and tp,
lot size and replicate the move over time.
That's why you need active real time discussions.
Trading is not get rich quick scheme!
Active in London session!
Not financial advice, DYOR.
Market Flow Strategy
Mister Y
GJ-Wed-23/07/25 TDA-Gap hasn't been filled yet!Analysis done directly on the chart!
Premise:
A simple idea plan (like Tradingview public posts) won't describe everything.
No one can predict how market will move, it's always good to react to how it moves.
It gives an idea of how price might move, but no one come from FUTURE.
So I always encourage people to openly and actively discuss in real time.
I don't give signals blindly, people should learn
and understand the skill.
Following blindly signals you won't know how to
manage the trade, where precisely put sl and tp,
lot size and replicate the move over time.
That's why you need active real time discussions.
Trading is not get rich quick scheme!
Active in London session!
Not financial advice, DYOR.
Market Flow Strategy
Mister Y

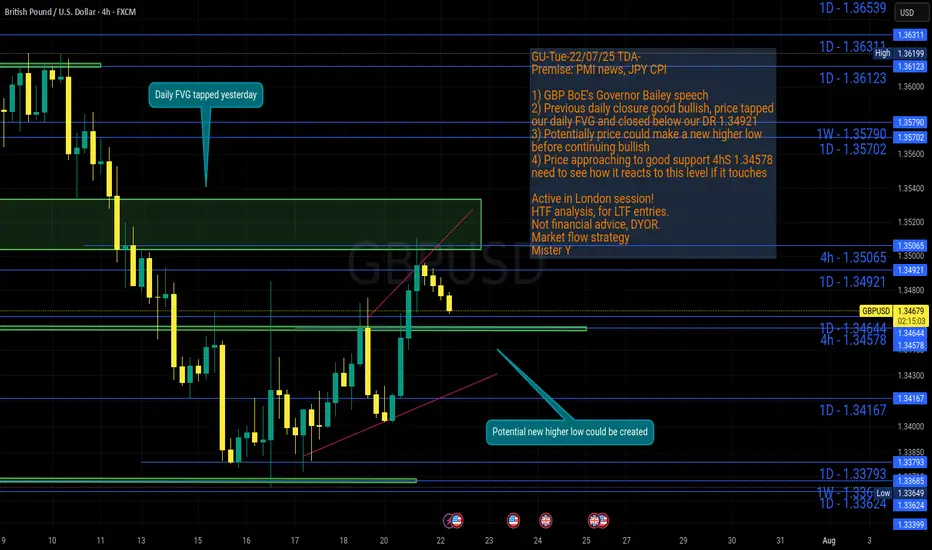
GU-Tue-22/07/25 TDA-Potential new higher low before continue?Analysis done directly on the chart!
Price gave a good bullish closure on daily candle yesterday,
if bullish trend continues, there's a good probability for price
to create a new higher low before continuing up.
Monitor and react to how price move from level to level.
Premise:
A simple idea plan (like Tradingview public posts) won't describe everything.
No one can predict how market will move, it's always good to react to how it moves.
It gives an idea of how price might move, but no one come from FUTURE.
So I always encourage people to openly and actively discuss in real time.
I don't give signals blindly, people should learn
and understand the skill.
Following blindly signals you won't know how to
manage the trade, where precisely put sl and tp,
lot size and replicate the move over time.
That's why you need active real time discussions.
Trading is not get rich quick scheme!
Active in London session!
Not financial advice, DYOR.
Market Flow Strategy
Mister Y
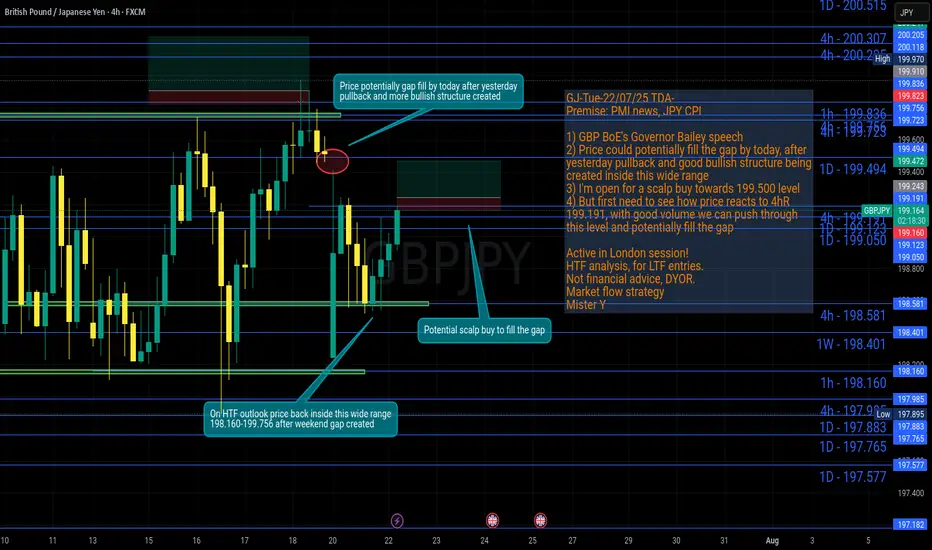
GJ-Tue-22/07/25 TDA-Potential scalp buy to fill the gap!Analysis done directly on the chart!
Weekend gaps in the majority of times (if not all the time) at some point
will be filled.
Premise:
A simple idea plan (like Tradingview public posts) won't describe everything.
No one can predict how market will move, it's always good to react to how it moves.
It gives an idea of how price might move, but no one come from FUTURE.
So I always encourage people to openly and actively discuss in real time.
I don't give signals blindly, people should learn
and understand the skill.
Following blindly signals you won't know how to
manage the trade, where precisely put sl and tp,
lot size and replicate the move over time.
That's why you need active real time discussions.
Trading is not get rich quick scheme!
Active in London session!
Not financial advice, DYOR.
Market Flow Strategy
Mister Y
GU-Mon-21/07/25 TDA-More consolidation,are we about to breakout?Analysis done directly on the chart!
Nothing lasts forever, the longer it consolidates
the easier the breakout will be.
Premise:
A simple idea plan (like Tradingview public posts) won't describe everything.
No one can predict how market will move, it's always good to react to how it moves.
It gives an idea of how price might move, but no one come from FUTURE.
So I always encourage people to openly and actively discuss in real time.
I don't give signals blindly, people should learn
and understand the skill.
Following blindly signals you won't know how to
manage the trade, where precisely put sl and tp,
lot size and replicate the move over time.
That's why you need active real time discussions.
Trading is not get rich quick scheme!
Active in London session!
Not financial advice, DYOR.
Market Flow Strategy
Mister Y

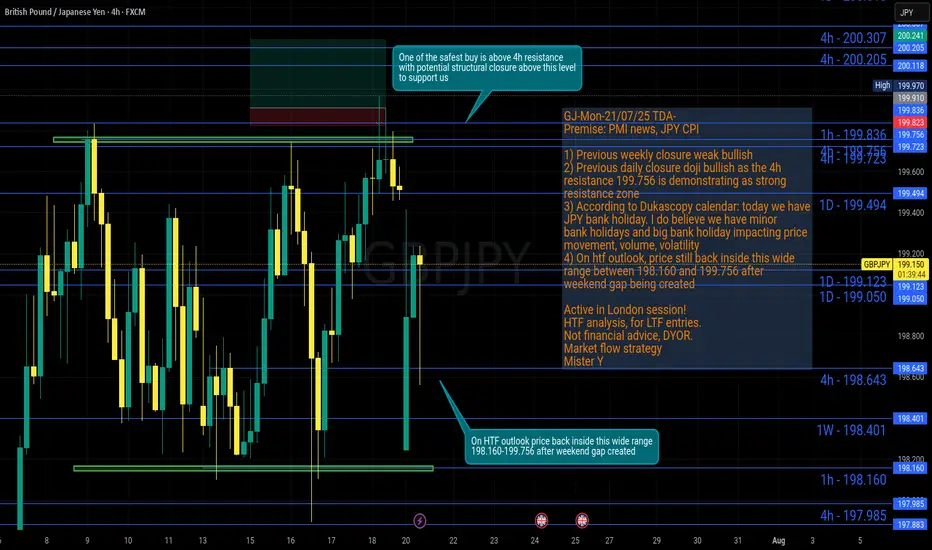
GJ-Mon-21/07/25 TDA-Wide range GJ, weekend gap at open!Analysis done directly on the chart!
We have big bank holidays and minor bank holidays.
Surely minor bank holidays impact less the price
Premise:
A simple idea plan (like Tradingview public posts) won't describe everything.
No one can predict how market will move, it's always good to react to how it moves.
It gives an idea of how price might move, but no one come from FUTURE.
So I always encourage people to openly and actively discuss in real time.
I don't give signals blindly, people should learn
and understand the skill.
Following blindly signals you won't know how to
manage the trade, where precisely put sl and tp,
lot size and replicate the move over time.
That's why you need active real time discussions.
Trading is not get rich quick scheme!
Active in London session!
Not financial advice, DYOR.
Market Flow Strategy
Mister Y
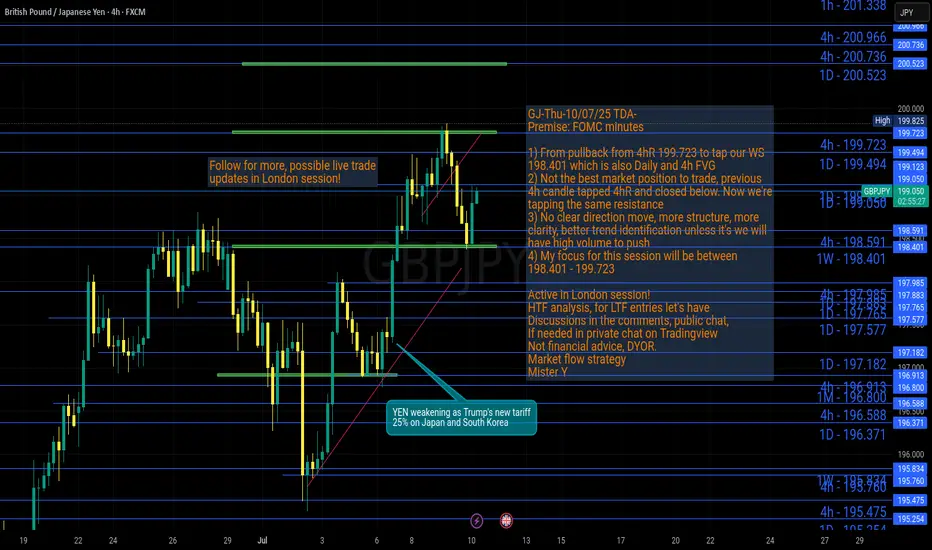
GJ-Thu-10/07/25 TDA-GJ pull back,good support created.Now what? Analysis done directly on the chart
Follow for more, possible live trades update!
I often share my live trades in Tradingview public chat in London session, stay tuned!
Houses aren't built over night, it takes brick by brick, one step at a time.
Same for trading, one step at a time. You make mistakes, you learn, you improve.
You make more mistakes, you learn more, you should improve more.
If it's easy, everyone will do it realistically.
Premise:
A simple idea plan (like Tradingview public posts) won't describe everything.
No one can predict how market will move, it's always good to react to how it moves.
It gives an idea of how price might move, but no one come from FUTURE.
So I always encourage people to openly and actively discuss in real time.
For example discussing on Tradingview public chat (and more).
I don't give signals blindly, people should learn
and understand the skill.
Following blindly signals you won't know how to
manage the trade, where precisely put sl and tp,
lot size and replicate the move over time.
That's why you need active real time discussions.
Trading is not get rich quick scheme!
Active in London session!
Not financial advice, DYOR.
Market Flow Strategy
Mister Y
GU-Thu-10/07/25 TDA-GU resuming bullish trend?Analysis done directly on the chart
Follow for more, possible live trades update!
I often share my live trades in Tradingview public chat in London session, stay tuned!
For every trade I take, no matter if it's a loss or win, I always
do post trade analysis. It really helps to understand and
improve. You get to know or try to figure out why price
at this time specifically moved this way or that way.
Premise:
A simple idea plan (like Tradingview public posts) won't describe everything.
No one can predict how market will move, it's always good to react to how it moves.
It gives an idea of how price might move, but no one come from FUTURE.
So I always encourage people to openly and actively discuss in real time.
For example discussing on Tradingview public chat (and more).
I don't give signals blindly, people should learn
and understand the skill.
Following blindly signals you won't know how to
manage the trade, where precisely put sl and tp,
lot size and replicate the move over time.
That's why you need active real time discussions.
Trading is not get rich quick scheme!
Active in London session!
Not financial advice, DYOR.
Market Flow Strategy
Mister Y

GU-Wed-09/07/25 TDA-Daily support (DS) 1.35702 is holding strongAnalysis done directly on the chart
Follow for more, possible live trades update!
I often share my live trades in Tradingview public chat in London session, stay tuned!
One of the basic concept of trading: Parts of candlestick
-The body
-The bottom wick
-The upper wick
Generally speaking, waiting for body closure above or below
certain levels gives higher probability of a certain move to
continue.
But it depends also on the timeframe you are considering:
-The 5m-15m body closure optimal for lower timeframe
-The 1h-4h body closure optimal for higher timeframe
-Etc...
These are all general considerations, in fact as a trader you
should evaluate each case based on market conditions and more.
Premise:
A simple idea plan (like Tradingview public posts) won't describe everything.
No one can predict how market will move, it's always good to react to how it moves.
It gives an idea of how price might move, but no one come from FUTURE.
So I always encourage people to openly and actively discuss in real time.
For example discussing on Tradingview public chat (and more).
I don't give signals blindly, people should learn
and understand the skill.
Following blindly signals you won't know how to
manage the trade, where precisely put sl and tp,
lot size and replicate the move over time.
That's why you need active real time discussions.
Trading is not get rich quick scheme!
Active in London session!
Not financial advice, DYOR.
Market Flow Strategy
Mister Y

GJ-Wed-09/07/25 TDA-Asian push, price hit our 4hR 199.723Analysis done directly on the chart
Follow for more, possible live trades update!
I often share my live trades in Tradingview public chat in London session, stay tuned!
When you have a specific trading time during the day,
it's can be frustrating when moves happen outside of
your trading time. But remember this is part of the game,
we will never catch every single move on the chart.
Don't force the entries, learn to get used to it.
Premise:
A simple idea plan (like Tradingview public posts) won't describe everything.
No one can predict how market will move, it's always good to react to how it moves.
It gives an idea of how price might move, but no one come from FUTURE.
So I always encourage people to openly and actively discuss in real time.
For example discussing on Tradingview public chat (and more).
I don't give signals blindly, people should learn
and understand the skill.
Following blindly signals you won't know how to
manage the trade, where precisely put sl and tp,
lot size and replicate the move over time.
That's why you need active real time discussions.
Trading is not get rich quick scheme!
Active in London session!
Not financial advice, DYOR.
Market Flow Strategy
Mister Y

GU-Tue-08/07/25 TDA-GU stagnant ahead of tomorrow's FOMC minutesAnalysis done directly on the chart
Follow for more, possible live trades update!
I often share my live trades in Tradingview public chat in London session, stay tuned!
Green flags, Red flags when you follow someone in trading:
Red flags:
-Always and only share winning trades
-No track records
-A lot of marketing campaign, offering paid courses and more but
with no proof of real trading skills
(I'm not against paid course etc... Just to keep in mind)
-Just sharing buy or sell but without explaining the confluences,
the setups, the reasons, the lot size, how risk manage the trade...
-Simply don't even know where to put sl and tp in advance
Green flags:
-Do live streaming in real time
-Keeping transparent about trade setups, ideas,
about wins and losses
-Share live track record of an account
These are just some signs (could be more green and red flag signs),
and should not be used as effective methods.
If you have more of green flags or red flags ideas, comment down below!
Premise:
A simple idea plan (like Tradingview public posts) won't describe everything.
No one can predict how market will move, it's always good to react to how it moves.
It gives an idea of how price might move, but no one come from FUTURE.
So I always encourage people to openly and actively discuss in real time.
For example discussing on Tradingview public chat (and more).
I don't give signals blindly, people should learn
and understand the skill.
Following blindly signals you won't know how to
manage the trade, where precisely put sl and tp,
lot size and replicate the move over time.
That's why you need active real time discussions.
Trading is not get rich quick scheme!
Active in London session!
Not financial advice, DYOR.
Market Flow Strategy
Mister Y

GJ-Tue-08/07/25 TDA-Trump's new tariff 25% on Japan, YEN weakAnalysis done directly on the chart
Follow for more, possible live trades update!
I often share my live trades in Tradingview public chat in London session, stay tuned!
Trump's new tariff 25% on Japan and South Korea has Yen weakening
further more significantly. Historically JXY is at minimum levels, where
BoJ can possibly intervene and buy back YEN and strengthening it.
Possibly causing massive dump on GJ like 100-200-300 pips move
within minutes. Always be careful and stay up to date to recent global
events and more.
Premise:
A simple idea plan (like Tradingview public posts) won't describe everything.
No one can predict how market will move, it's always good to react to how it moves.
It gives an idea of how price might move, but no one come from FUTURE.
So I always encourage people to openly and actively discuss in real time.
For example discussing on Tradingview public chat (and more).
I don't give signals blindly, people should learn
and understand the skill.
Following blindly signals you won't know how to
manage the trade, where precisely put sl and tp,
lot size and replicate the move over time.
That's why you need active real time discussions.
Trading is not get rich quick scheme!
Active in London session!
Not financial advice, DYOR.
Market Flow Strategy
Mister Y
