GU-Tue-3/06/25 TDA-DR 1.35577 tapped, GU consolidatingAnalysis done directly on the chart
Follow for more, possible live trades update!
Consistency, build solid confidence in your
execution, management. It's not easy, but
if your plan is to stay for the long term. With
discipline, consistently showing off, patience,
dedication, study, learn, apply. You'll eventually
get there!
Not financial advice, DYOR.
Market Flow Strategy
Mister Y
Topdownanalysis

GJ-Tue-3/06/25 TDA-From htf outlook, GJ quite messy zoneAnalysis done directly on the chart
Follow for more, possible live trades update!
More structure, more clarity, better trend identification.
On htf outlook, GJ is sitting in a complicated area.
Not a bad idea to risk low and preserve your capital with
this market condition and market positioning until more
clarity is shown.
Not financial advice, DYOR.
Market Flow Strategy
Mister Y

GU-Mon-2/06/25 TDA-GU pushing up, possible breakout buy!Analysis done directly on the chart
Follow for more, possible live trades update!
Breakout trade:
It's always good to wait for candle closure above
or below certain levels (depending on if you are buying
or selling). Then have lower timeframe structure to
put good sl and be able to manage properly.
Always know beforehand where to put your sl and tp.
Not financial advice, DYOR.
Market Flow Strategy
Mister Y

GJ-Mon-2/06/25 TDA-GJ in ranging zone!Analysis done directly on the chart
Follow for more, possible live trades update!
My idea is the higher time frame you trade,
the more fundamental analysis you need to be
good at to actually be consistently profitable
trader. And viceversa if you trade lower timeframe
it's more technical analysis but always keeping
in mind the higher timeframe picture, doing the
top down analysis and having the basic necessary
knowledge on fundamental analysis.
Tips for basic fundamental knowledge:
1) Use economic calendar ( I recommend
FXstreet calendar for macroeconomic events
and Financial Juicy for flash news, real live updates)
2) Stay up to date with global news, war, tariffs etc.
As these are key factors that will influence price
currencies.
Not financial advice, DYOR.
Market Flow Strategy
Mister Y

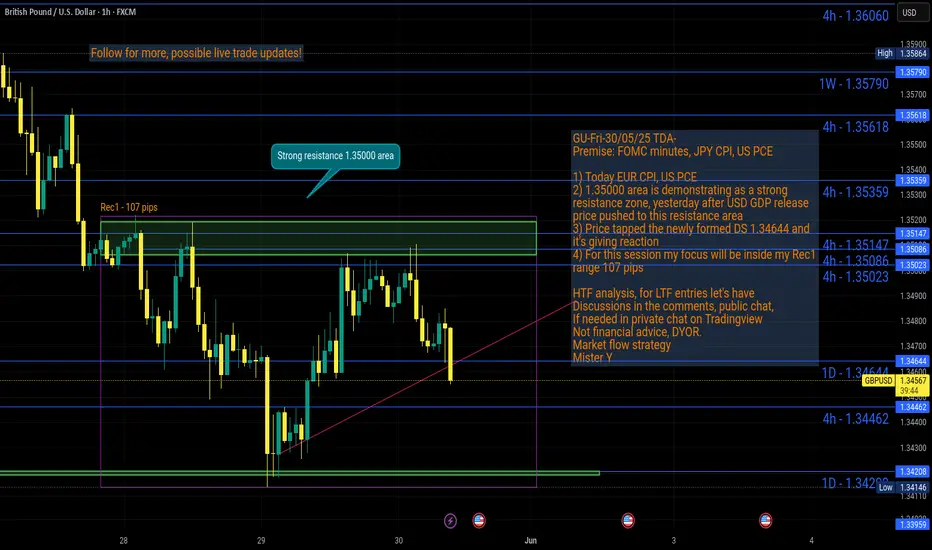
GU-Fri-30/05/25 TDA-Strong resistance 1.35000 zone! Analysis done directly on the chart
Follow for more, possible live trades update!
I trade zone to zone, from support to resistance,
and vice versa. Once I see price entering my
zone of interest, I see how candle reacts to the
level.
Not financial advice, DYOR.
Market Flow Strategy
Mister Y
GJ-Fri-30/05/25 TDA-Massive dump on GJ, now what?Analysis done directly on the chart
Follow for more, possible live trades update!
Time to reset, recharge!
Just like you train your body, it needs
recovery time.
Also your brain needs recovery time.
Not financial advice, DYOR.
Market Flow Strategy
Mister Y

GU-Thu-29/05/25 TDA-Zone of conflict of interest, Bull and Bear!Analysis done directly on the chart
Follow for more, possible live trades update!
Predicting the market is impossible, you react
to how price is forming and telling you the volume
strength, potential push/consolidation/pullback.
Not financial advice, DYOR.
Market Flow Strategy
Mister Y

GJ-Thu-29/05/25 TDA-Possible buy above 4hR 196.283Analysis done directly on the chart
Follow for more, possible live trades update!
Asian session gave a good push, if you feel
missing out (FOMO). Don't worry, opportunities
will always be there.
Not financial advice, DYOR.
Market Flow Strategy
Mister Y

GU-Wed-28/05/25 TDA-Heavy pump and dump pre FOMC minutes!Analysis done directly on the chart
Follow for more, possible live trades update!
Multitasking is good once you have mastered
each single task because you have practiced,
trained your subconscious mind so much that
your brain subconsciously automatically act
accordingly.
And this is where developing good
pattern recognition on how price is moving will
help you enhance your trading skills!
It requires time, a lot but a lot of dedication,
accepting the fact that your not good enough yet.
Trick your mind by thinking you are always two
steps behind. (even if you see good results!)
And learn from your mistakes: Journaling!
Do before, during, after trade analysis!
Not financial advice, DYOR.
Market Flow Strategy
Mister Y

GJ-Wed-28/05/25 TDA-GJ pulling back ahead of FOMC minutes!Analysis done directly on the chart
Follow for more, possible live trades update!
Today's FOCUS: market positioning
You can have good trade idea, BUT
you still get stopped out with loss or
break even (BE). And one of the reasons
why is your market positioning.
To solve this problem one of the good
ways is to understand firstly the higher
timeframe structure.
Ask yourself:
Am I inside the range?
Is price is breaking out of range?
ETC...
Comment down below if this was useful!
Not financial advice, DYOR.
Market Flow Strategy
Mister Y

GJ-Tue-27/05/25 TDA-4hFVG respected, possible upside continue!Analysis done directly on the chart
Follow for more, possible live trades update!
Consolidation, structure, breakout
Again
Consolidation, structure, breakout
Market is fractal, it repeats itself again
and again. But to understand it deeply,
it's not easy at all.
Not financial advice, DYOR.
Market Flow Strategy
Mister Y

GU-Tue-27/05/25 TDA-Great pullback, good structure is forming!Analysis done directly on the chart
Follow for more, possible live trades update!
Consistency, show up daily is not easy. Many
in fact will quit. If you want to really get good
at something you need to put into hard work.
Short cuts will benefit short term, but long term
it will cost you!
Not financial advice, DYOR.
Market Flow Strategy
Mister Y

GJ-Mon-26/05/25 TDA-Big range, possible scalping buy! Analysis done directly on the chart
Follow for more, possible live trades update!
There are periods when price will push smoothly,
others when price give little pushes and not so
clean. Understanding and reacting to how good
the volume is and price readiness is important to
create a consistent edge in your system.
Not financial advice, DYOR.
Market Flow Strategy
Mister Y

GU-Mon-26/05/25 TDA-WR 1.35790 hit, some pullback now?Analysis done directly on the chart
Follow for more, possible live trades update!
I can't, you can't. Nobody can catch every single
move on the chart. Knowing when there are higher
probabilities to win, it's a key to your long term edge.
Not financial advice, DYOR.
Market Flow Strategy
Mister Y

Market Analysis For DXY: Week of May 26thFurther downside momentum looks like a strong possibility this week with liquidity and imbalances resting in short-term zones.

GU-Fri-23/05/25 TDA-Bullish closures, Breakout buy is on!Analysis done directly on the chart
Follow for more, possible live updates!
Plan, wait, execute.
It's easy to write, but difficult to do.
It requires surely experience, just put in
the work, track your progress and don't
give up.
Not financial advice, DYOR.
Market Flow Strategy
Mister Y

GJ-Fri-23/05/25 TDA-Wide consolidation incoming?Analysis done directly on the chart
Follow for more, possible live updates!
Not everyday is a good trading day,
you are not forced to take trades every
single day. More trades is not equal
to better results.
Not financial advice, DYOR.
Market Flow Strategy
Mister Y

GU-Thu-22/05/25 TDA-Strong resistance DR 1.34325!Analysis done directly on the chart
Follow for more, possible live update!
The daily resistance 1.34325 has been tested as
a strong resistance, price could possibly start to
fail and create a possibility for reversal setups.
On the other hand, with more bullish structure and
bullish closures we'll likely to continue higher towards
1.35000 and more.
Not financial advice, DYOR.
Market Flow Strategy
Mister Y

GJ-Thu-22/05/25 TDA-Multiple 4hS tapped, PMI news incoming!Analysis done directly on the chart
Follow for more, possible live updates!
Multiple 4hS tapped, PMI news incoming,
the PMI releases will determine how price
will move today.
Not financial advice, DYOR.
Market Flow Strategy
Mister Y

GU-Wed-21/05/25 TDA-GBP CPI higher than expected, Bullish!Analysis done directly on the chart
Follow for more, possible live trades update!
Risk management. You can take bad trades but
you can recover with good risk management.
The profitable strategy alone isn't enough to
succeed in this game.
Not financial advice, DYOR.
Market Flow Strategy
Mister Y

GJ-Wed-21/05/25 TDA-Still consolidation GJ!Analysis done directly on the chart
Follow for more, possible live trades update!
I have two pairs to monitor. (GU and GJ)
It helps me focus on scalping better
If one is consolidating, I can opt for
the other one to trade cleaner price action
And you how many pairs do you trade?
Comment down below!
Not financial advice, DYOR.
Market Flow Strategy
Mister Y

GU-Tue-20/05/25 TDA-Strong resistances ahead of GBP CPI!Analysis done directly on the chart
Follow for more, possible live trades update!
Price action, react to how candle form and move.
Not financial advice, DYOR.
Market Flow Strategy
Mister Y

GJ-Tue-20/05/25 TDA-Uncertainty ahead of GBP CPI!Analysis done directly on the chart
Follow for more, possible live trades update!
Knowledge per se won't make you money, it is
applying the knowledge and in this case in trading
doing live trades will help you to possibly make money.
Not financial advice, DYOR.
Market Flow Strategy
Mister Y
