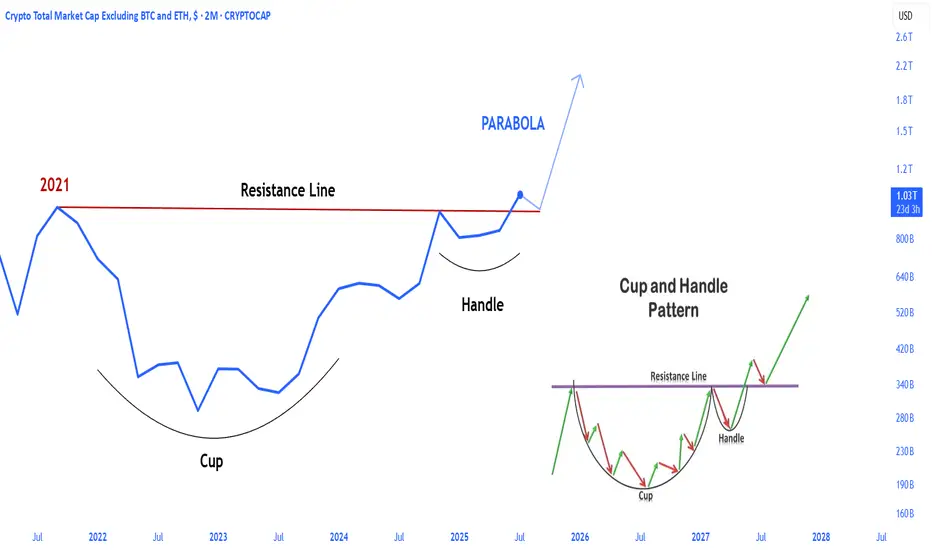
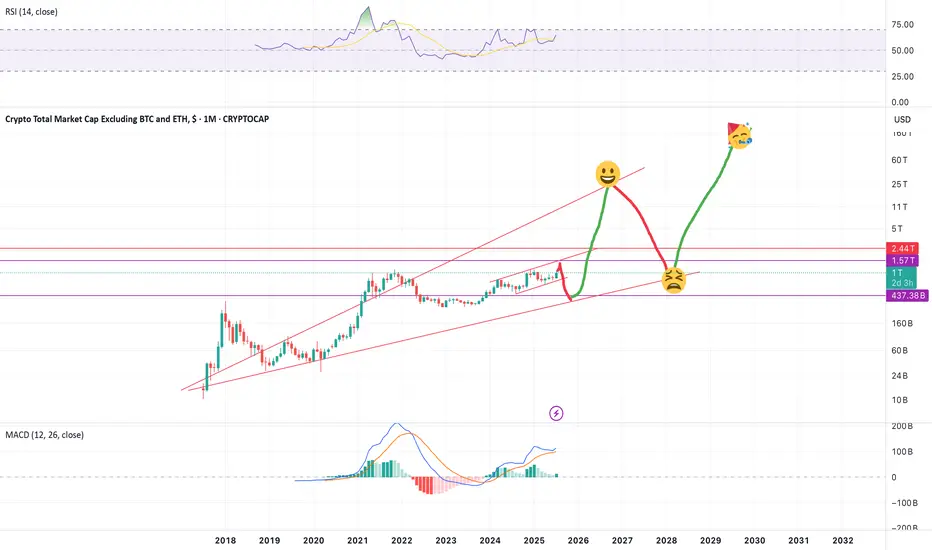
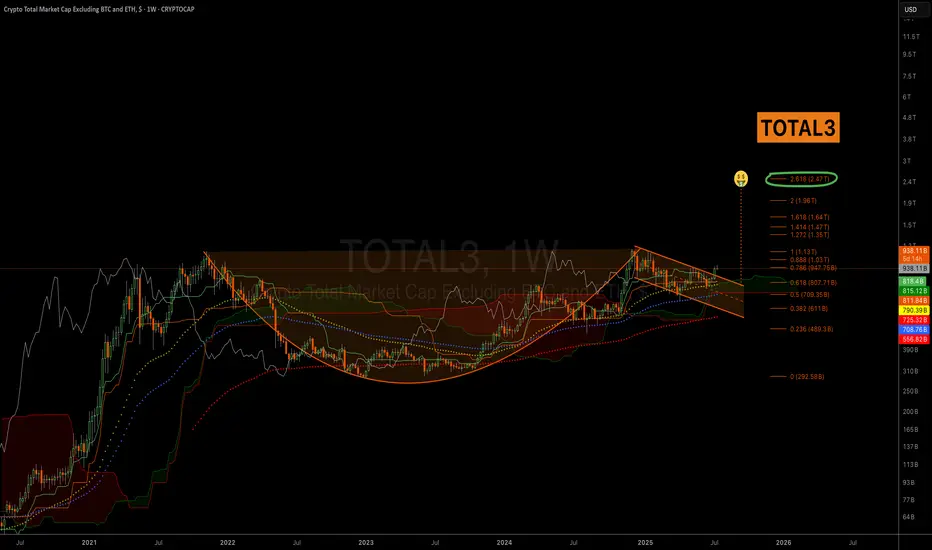
TOTAL3 & Bullish ResistanceThe cup pattern. A bowl. A curve... If you draw a straight line from the last peak, left to right, you can get the pattern neckline, the base. When this resistance is being challenged it means the market is ready to move ahead. The more that it is challenged, the weaker it becomes.
See here the long-term TOTAL3 index chart. Very strong volume. Strong bullish conditions. Trading above all moving averages, everything looks great.
'Resistance' is being faced at the right end of the pattern, just as it happened back in November 2024. This is a bullish pattern. There can be a drop, retrace at resistance, followed by additional growth. The way the chart looks now we are aiming at a repeat of 2024. A rising line. Straight up.
While we have a steady rise since 7-April this is part of a period of bullish consolidation, the real breakout is yet to happen. The bigger portion of the bullish move is yet to show up. The best is yet to come.
Everything will be much better; higher prices, in the coming months.
The altcoins market will continue to grow. Market conditions will continue to improve and Bitcoin will stabilize at a high price only to continue with its eternal bull-trend.
Thank you for reading.
Namaste.
Total3

Mega Altcoins SeasonMega Altcoins Season ⏳
For the first time since 2021, signs of an ALTseason are literally there.
OTHERS + TOTAL2 + TOTAL3

$OTHERS Market Update 📢 CRYPTOCAP:OTHERS Market Update
CRYPTOCAP:OTHERS has been consolidating in my horizontal range, between $193B and $320B.
⚠️ A clear Head & Shoulders pattern is forming — one of the most reliable bearish setups. At the same time, both RSI and MACD are in overbought territory, increasing the probability of a correction.
📉 Main Scenario:
A breakdown of support looks likely, with a retrace toward $260B. I don’t expect it to fall much lower.
✅ This reset would be healthy, clearing short-term exhaustion and setting up for a longer, more sustainable rally.
✅ It would also create great buying opportunities, especially for altcoins that haven’t pumped yet, like CRYPTOCAP:PEPE and $SUI.
📊 Alternative Scenario:
CRYPTOCAP:BTC and CRYPTOCAP:ETH could continue their institutional-driven rally, preventing this retrace. But that would leave many sidelined traders without the chance to reload at lower levels.
⚖️ Key takeaway:
Patience is everything. Even if CRYPTOCAP:BTC pushes higher next week, markets often pull back unexpectedly, offering us a second chance to buy.
🚀 Watch my green zones and check my other ideas for refill opportunities.
🔎 DYOR & trade safe.
🔖 #Crypto #Altcoins #OTHERS #Bitcoin #Ethereum #Altseason #CryptoTrading #TradingView #BTC #ETH #PEPE #SUI #CryptoAnalysis

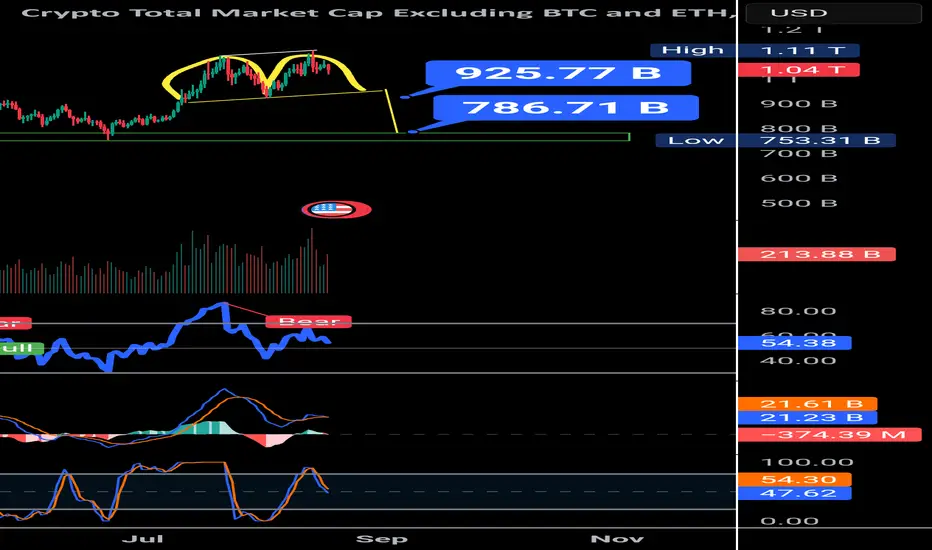
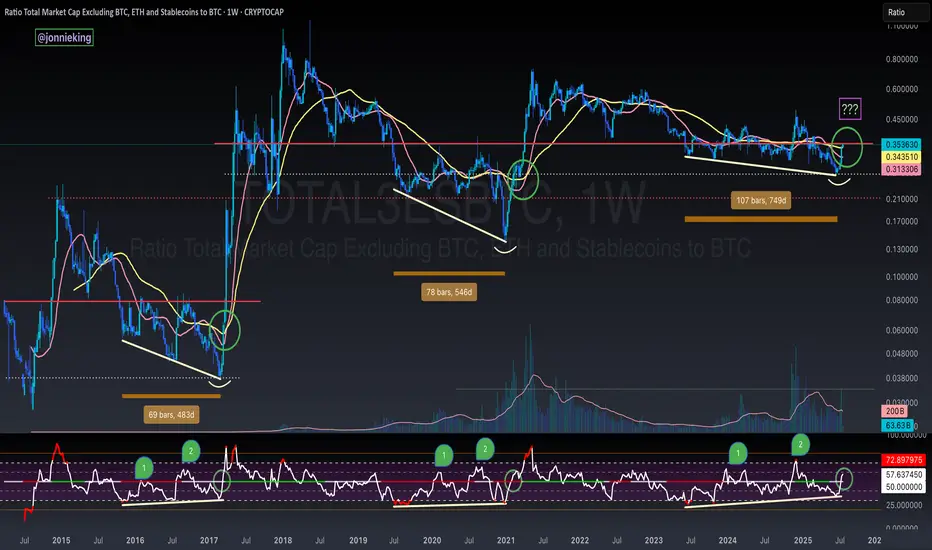
TOTAL3 double top with bearish divergenceThe TOTAL3 (altcoin market cap excluding BTC & ETH) has now climbed back to the $1T zone, almost testing its previous highs. But if we look closer, the chart is flashing a clear bearish divergence alongside a double top (M-pattern) structure.
Here’s the key takeaway:
If the pattern plays out, 950B support becomes the crucial line to watch.
A bounce at 950B could just be a healthy correction from the bearish divergence.
But if 950B breaks, the next strong support sits near 786B.
That zone could open doors for fresh altcoin accumulation opportunities. On the other hand, for those already holding, this level can also be considered a final profit-taking area before a deeper correction sets in.
Overall, the chart suggests the altcoin market is due for correction, especially with Bitcoin dominance on the rise. Patience and risk management are key here.
TICK... TOCK... ALTSEASONTICK... TOCK... ALTSEASON
OTHERS + TOTAL2 + TOTAL3 \ ALTCOINS
1380-day major resistance breakout!

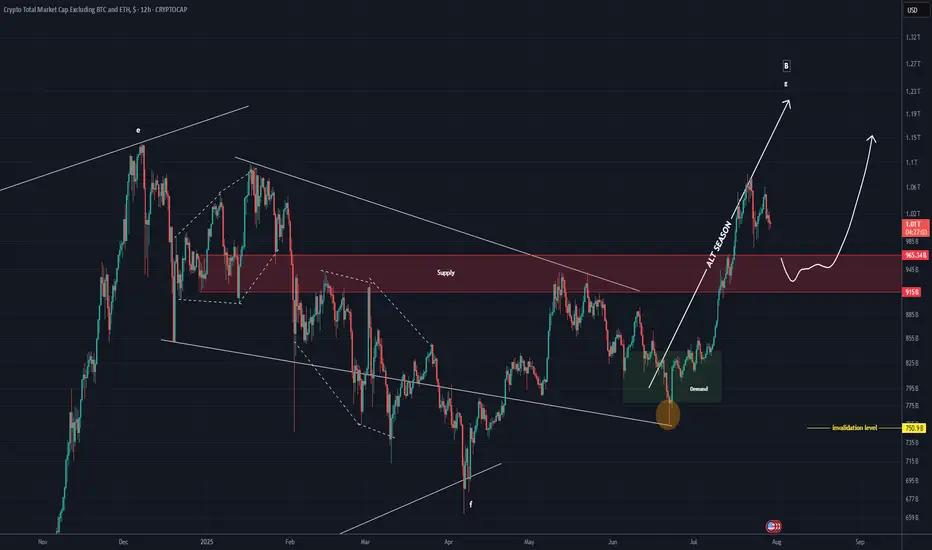
TOTAL 3 New Update (12H)This analysis is an update of the analysis you see in the "Related publications" section
This index has broken below the red zone; if a pullback to this area occurs, it may act as support again and the index could move upward
For risk management, please don't forget stop loss and capital management
Comment if you have any questions
Thank You
SOMETHING BIG IS COMING! ALTCOINSThe total3 index, an important metric for altcoins, broke out of the handle cup formation that began at the 2021 all-time high level. After the retest phase in the coming period, it will transition to a sharp rise phase.
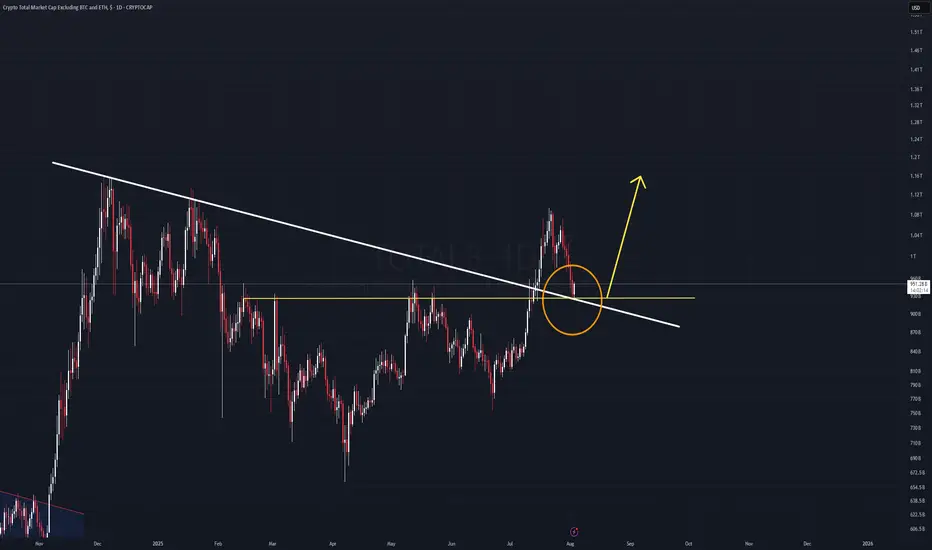
TOTAL 3 Analysis (1D)The TOTAL3 chart is currently retesting a key diagonal trendline that was broken previously. This is a classic bullish retest scenario.
If the current daily candle closes green, and is followed by a strong impulsive candle without invalidation, it could signal the start of a new leg upward, right from this zone.
The $900B market cap level remains the key support.
As long as TOTAL3 holds above this threshold, the bullish bias remains intact.
This structure could lead to momentum across the altcoin market.
Total3 Wild ride, will make Millionaires and reck Millionaires this is not a financial advise but this is how i'm playing it
an investment of $10,000 can make you millions if played right.
buckle up
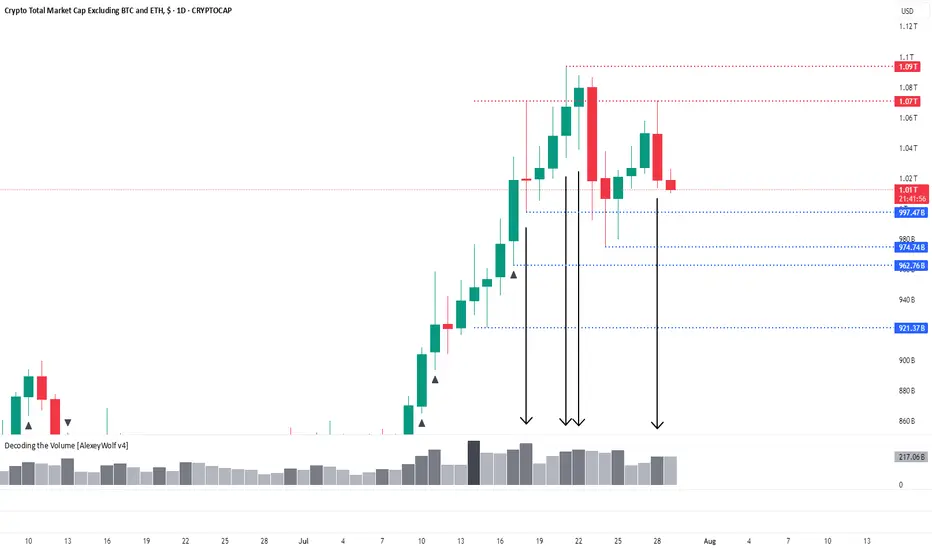
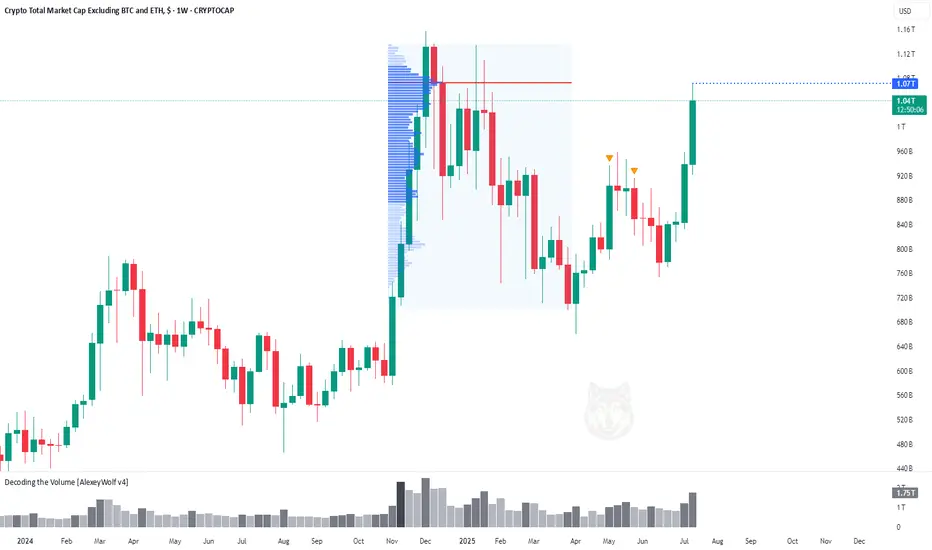
Total3: Fourth Interaction with 1.07 LevelHi traders and investors!
The altcoin market capitalization (Total3) is interacting with the 1.07T level for the fourth time — and once again, on increased volume. Yesterday’s price action formed a bearish candle after touching this level — a clear seller’s candle.
We’re now watching the 997.47B level closely. A reaction from this level could trigger a reversal in altcoins, with buyers potentially regaining initiative.
Since the last outlook, a new level has appeared at 974.74B — this could also serve as a strong support area and trigger a buyer response, aiming for a retest of the local high at 1.09T.
👉 If no bullish reaction follows at 997.47B, attention shifts to 974.74B.
👉 If that level also fails to hold, we return to the previously mentioned support zone between 921B and 963B — the optimal correction range for a potential new ATH scenario.
This analysis is based on the Initiative Analysis concept (IA).
Wishing you profitable trades!
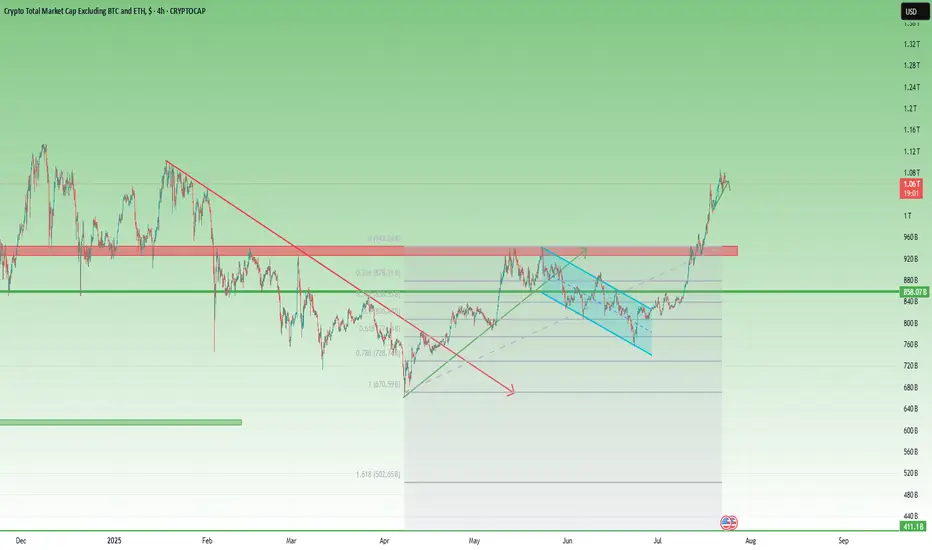
Total3 – Back Above 1T, but Will It Offer a Second Chance?📈 What happened since April?
After the sharp low in early April, Total3 began to recover steadily.
Toward the end of the month, it broke above the falling trendline that had been holding since January — a key technical shift.
This triggered a strong recovery rally, pushing total altcoin capitalization (excluding BTC & ETH) to the 930–940B resistance zone.
📉 Then came the pullback…
Price printed a double top near resistance, followed by a drop — but not a bearish one.
Instead, the correction was orderly, forming a bullish flag, with the low landing right on the 61.8% Fibonacci retracement. Classic healthy structure.
🚀 The latest breakout
Earlier this month, Total3 launched a very impulsive leg up, reclaiming the 1 trillion level with strength.
At the time of writing, we’re trading back above 1T, and momentum remains on the bulls’ side.
However, the chart does look a bit overextended in the short term, suggesting a correction could follow soon.
🧭 Trading Plan – Will We Get a Retest?
The textbook play would be to wait for a deep pullback toward previous support levels.
BUT – I don’t believe we’ll get a full retest of the breakout. Altcoins may stay elevated or correct only modestly.
Instead, I’ll be watching the 1T zone and slightly below — that’s where I’ll look to load up on interesting altcoins.
📌 Conclusion:
Total3 has broken structure, reclaimed key levels, and is showing classic bullish continuation behavior.
The market may not offer you the perfect entry — but small dips near 1T could be all we get before another move higher. 🚀
Be prepared. Don’t wait for perfection in a market because rarely gives it.
ALT SEASON Cycle Finale Special | SOL/ETH & TOTAL3Our last analysis of BTC.D ⬇️ and ETH/BTC ⬆️ () is now playing out, and we are entering the final stage of the 4-year crypto cycle -- ESCAPE VELOCITY for the rest of the crypto market.
As money flows up the risk curve, expecting SOL to outperform ETH from here, and the rest of the crypto market to outperform majors.
Welcome to the cycle finale special!
TOTAL3 / BTC - ALT SEASON BREAKOUT - Bullish Divergence SpottedBULLISH DIVERGENCE on CRYPTOCAP:TOTAL3 against CRYPTOCAP:BTC 🏁
You will see every time the RSI passed 50 on the Weekly chart in the post-Halving year it signaled Alt Season 🚀
This coincided with 3 tests of this level at 50, with the 3rd test being the real breakout 🤌🏼
Volume confirms change in trend 🏁
AWAITING CONFIRMATION 🚨
🅾️ Close several Weeks above key neckline resistance (currently here)
🅾️ Bullish Cross on the 20 / 50WMA
Altcoin Market Hits First Target at $1.07THi traders and investors!
The market capitalization of Total3 has reached $1.07 trillion, marking the first major target for the altcoin market.
This level corresponds to the Point of Control (POC) from the previous bullish rally and the subsequent correction — a key area of traded volume and market interest.
Several factors now suggest the potential for a continued move higher. On the fundamental side, the recent signing of a pro-crypto bill by Donald Trump has boosted overall sentiment in the digital asset space, especially among altcoins. From a technical perspective, many leading altcoins are showing bullish continuation patterns.
Wishing you profitable trades!
TOTAL3 exc BTCÐTOTAL3 is at the all-time high again and pushing to break that.
according to previous cycles the 1.414% of Fibonacci retracement at $1.98T is the top & timing of before the end of November 2025

TOTAL3 - Massive Cup & Handle AccumulationImagine these coins, the way they are destroyed and at the bottoms. But then they make you not believe the projects anymore, like theyre all trash. People on youtube calling them scam coins, and sure 90% or more are. But there are projects that are good, and those are gonna get massive pumps coming up. Dont give away, because it is not longer selling at these levels, dont give away your coins for rice prices.
We start ALT Season now with 3 targets!Hello guys,
As you can see we have 3 targets🎯 green, blue, red,
which target we will reach?
It depends on the Fractal scenario on the right, So we will wait 2 clear trends,
each one has 3 tops and Clear correction between the up trends,,
Don't lose your positions and don't jump between currencies!
Also Don't burn your wallet with Future!
Spot is Enough!

Trading Altcoins for Maximum Profits · StrategyIt is a tricky market. How are you going to trade the altcoins to maximize profits? What's your plan?
Everyday there is always some odd pair that grows 100%+, and we feel attracted to this kind of action. We want to be in and we want to hold those pairs. But, there are hundreds of choices on each exchange and only 1-2 pairs breakup this strongly every few days. Quietly, behind the scenes, everything grows but slowly.
Three months down the road the entire market will be 2-3 levels up, minimum. Some pairs will be up five levels and some even more.
If we fall for the trap of trying to catch the next big move, we can miss the real bullish action that is happening every day. I mean, it is better to buy and hold 5-10 strong good pairs rather than chasing around the dream of big wins. A dream that most often than not never comes.
If you look at 22-June or 7-April, it takes months for a bullish wave to develop. All across, marketwide, it happens step by step. Every day altcoins are growing 2-3%, 5-10%, over and over, again and again.
When we jump around trying to catch the next sudden jump, we miss the safe and secure sustained daily growth. When we finally make the right move and buy the pair that is breaking up strong, there is a 50% bullish breakout but somehow this isn't enough, we want more, more, more. 50%, 70% up and yet, we do not sell, we wait for more. But the entire bullish wave, regardless of how you slice it, takes a minimum of 3 months. Then comes a retrace, fast, or a strong correction, and we sell when prices are low. A strong rise at first and we might end up with just 20-30% gains. And in this way we end up wasting months and months.
Three months later, we do have some gains; it is a bull market after all, but total growth is nothing compared to holding a strong pair long-term. The strong pairs, most of them, end up growing 700%, 800%, 1,000%. When you look at your capital and you are moving around, you see only 100 or 200% total growth. What is happening here?
If you have 2-3 years of spot trading experience, then you can definitely choose 20 good pairs and sell the few that breakup weekly, hold the rest. Each time several pairs breakup strong, collect profits and find the ones trading low. But, if you have less than 2 years experience trading spot, you are better off buying low and holding long-term. You will end up with bigger profits in the end.
There are many ways to approach the market, make no mistake, but a plan is needed to maximize profits. I will continue to share my experience so you can avoid making the same mistake I made back in the days.
I've been trading Bitcoin since 2013, altcoins starting 2015; full time Cryptocurrency since 2017 through present day.
The market is a school and will you give tons of lessons, experience is needed for success. If experience is lacking, planing ahead of time will produce the best results.
To plan, just ask yourself the following questions:
1) How long am I willing to wait after buying a pair?
2) If prices rise, will I sell? If yes, when and by how much?
3) If prices drop, will I close the position at a loss? If no, how long are you willing to wait with a losing pair? If yes, when will you close? At -10%, -20%, -50%?
Answering these questions ahead of time can help you avoid anxiety and stress. The more you prepare, the more you read; higher profits.
Namaste.

Do you believe in miracles?Others dominance is crazily undervalued way beyond anyone's imagination, it's been a crazy 4 year bear market for alts. Big question is, when will it end. Can't fathom this industry getting killed by exchanges, just look at others.d go man, crazy low.
If this were the equivalent to 2019/2020 and 2015/2016, any buy in this range is a one in a lifetime opportunity.
If this is like December 2016, well, that would save us years of struggle. Hard to tell what's going to happen but I still believe Trump will give us an extended bullrun that will peak when the FIFA world cup is on somewhere around July 4th 2026.
Great depression? this goes way beyond that, what more of a great depression do you want. Just brutal.

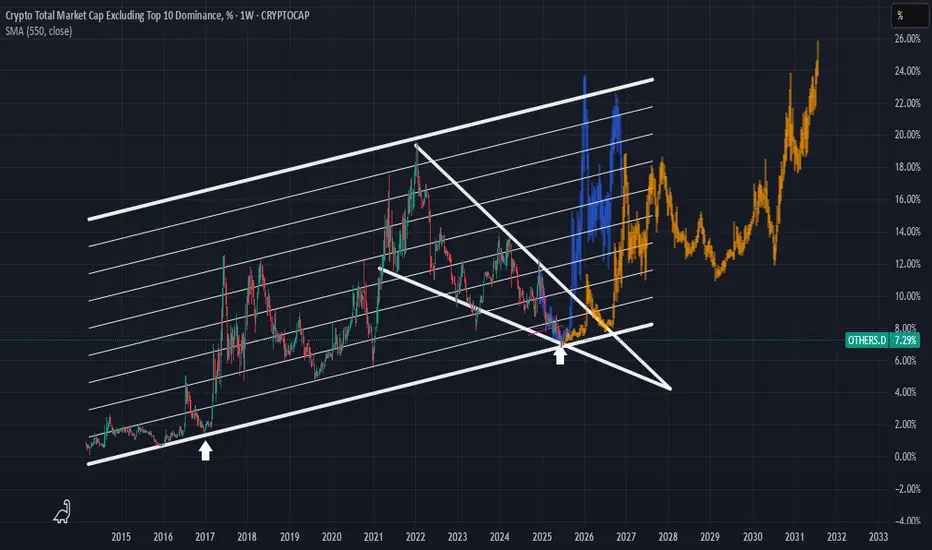
Very similar to January 2016You are looking at the Crypto Total Market Cap Excluding the Top 10 cryptocurrencies (OTHERS.D) on a weekly timeframe. This chart is often used as an "Altcoin Index" to gauge the strength of the broader cryptocurrency market beyond the major players like Bitcoin and Ethereum.
Here's my observation about being in a period similar to January 2016.
The technical analysis on this chart is built around a few key concepts:
1. Long-Term Ascending Channel: The dominant feature is a large parallel ascending channel that has contained the altcoin market cap's movements since 2015. The upper line has acted as a resistance level during bull market peaks, and the lower line has served as a major support level during bear market bottoms.
2. Historical Fractal (The "January 2016" Idea): My idea centers on a historical comparison, or a "fractal."
- The first white arrow points to a period in late 2016. At this time, the altcoin market cap found a bottom right on the support line of the ascending channel. This bottoming phase preceded the explosive 2017 bull run.
- The second white arrow points to a projected time in late 2025 / early 2026. The chart suggests that the market is currently in a similar bottoming pattern near the same long-term support line.
3. Falling Wedge: I've drawn a large falling wedge pattern starting from the peak in late 2021. This is typically a bullish reversal pattern, suggesting that the long downtrend could be nearing its end. The price is currently interacting with the apex of this wedge, a critical decision point.
4. Price Projection: The orange and blue bar patterns are copies of the price action that followed the 2016-2017 bottom. By pasting this fractal to the current time, the chart visualizes a potential future where history rhymes, leading to a massive new bull market for altcoins extending into 2027 until the end of the roaring 20s.
The Bullish Case (According to the Chart)
The argument presented by this analysis is clear:
• The altcoin market is at a historically strong support level (the bottom of the ~10-year channel).
• This is the same support level that kicked off the massive 2017 bull market.
• The market is consolidating within a falling wedge, which has a higher probability of breaking to the upside.
If this analysis holds true, the current period could be seen as a significant accumulation zone before the next major market expansion, much like the period around January 2016 was.
Important Considerations and Risks
While this is a compelling technical setup, it's crucial to maintain a balanced perspective. Here are some factors to consider:
• Past Performance is Not a Guarantee: This is the most important principle in financial markets. While historical patterns can provide valuable insight, they do not guarantee future results.
• Market Dynamics Have Changed: The cryptocurrency market of 2025 is fundamentally different from that of 2016.
• Maturity and Size: The market is significantly larger and includes substantial institutional investment, which can alter market behavior and volatility.
• Macroeconomic Factors: Global economic conditions, such as interest rates and inflation, now have a much stronger influence on the crypto market than they did in its earlier days.
• Regulatory Environment: Increased global regulatory scrutiny can introduce uncertainty and risks that were not present in the 2016-2017 cycle.
• Subjectivity of Technical Analysis: The trendlines and patterns are drawn based on an analyst's interpretation. Another analyst might draw them slightly differently, leading to a different conclusion.
Conclusion
The idea that "we're in January 2016 all over again" is a valid interpretation based on the technical patterns in this chart. The analysis points to the altcoin market being at a critical long-term support level, similar to the setup that preceded a major historical bull run.
This chart lays out a clear bullish roadmap. However, everyone should treat it as a potential scenario, not a certainty. I'll continue to monitor if the price respects these historical levels so that you guys are mindful of the broader market and macroeconomic factors that could influence the outcome.
Disclaimer: This analysis is for informational purposes only and is based on the technical analysis presented in the user-provided image. It should not be construed as financial advice. All investment decisions carry risk, and you should conduct your own research.
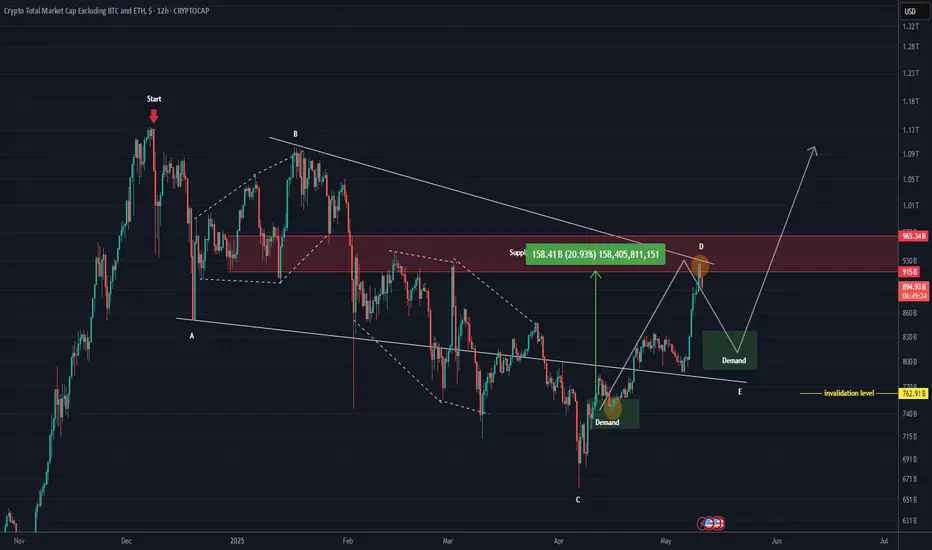
TOTAL 3 New Update (12H)This analysis is an update of the analysis you see in the "Related publications" section
TOTAL3 refers to the total crypto market cap excluding Bitcoin and Ethereum.
It pumped from the lower demand zone to the marked red box and has surged by 21%.
We now need a retracement to make the price more attractive.
If the invalidation level and the green zone hold, we could witness another bullish wave.
In this analysis, the invalidation level has been updated. A daily candle closing below this level will invalidate the setup.
Some altcoins are currently bullish, and each chart must be analyzed individually| so be cautious with your short positions.
For risk management, please don't forget stop loss and capital management
Comment if you have any questions
Thank You
Altcoins Rise Again – Off to 1.07T and 1.51T?🌊🚀 Total Market Cap (excluding BTC & ETH) is showing strength again, pushing off support and heading back into the heart of the channel.
💥 The bullish structure has been respected beautifully:
✅ Double bottom near channel base
✅ Clean bounce and new higher low
✅ Momentum building on macro trend
📈 As long as this channel holds, we're eyeing the next targets:
🔹 Mid-channel target: $1.07 Trillion
🔹 Channel top extension: $1.51 Trillion
From the "Escape" back in late 2023 to the clean retest — it’s now about confirmation and continuation.
This could be the altseason move everyone forgot about...
🛑 Long bias stays intact as long as the bottom channel support is respected.
Time to respect structure over noise.
One Love,
The FXPROFESSOR 💙
Disclosure: I am happy to be part of the Trade Nation's Influencer program and receive a monthly fee for using their TradingView charts in my analysis. Awesome broker, where the trader really comes first! 🌟🤝📈

Relation between DXY BTC TOTAL#📄 Analysis of three price charts and comparison between dates and movement
◀️ So far, the anticipated rise in alternative currencies has not occurred, and the rise that has happened is considered small and weak since the bottom of 2022
📄 In the first price chart, we see the movement of the US Dollar Index (DXY)
🔽 Each time the index breaks below the 100.00 level, it has a path to test 90.00, and this path has been achieved twice before during the periods of 2017 - 2018 and 2020 - 2021, with each time lasting approximately 320 days
◀️ At the moment we are in, there has been a break below the 100.00 level in DXY, and we are currently on day 84 of this break
⭕️ In the first break between 2017 - 2018, Bitcoin moved up by 2128%, and alternative currencies moved up by 3030%
⭕️ In the second break between 2020 - 2021, Bitcoin moved up by 608%, and alternative currencies moved up by 1668%
⭕️ In the current third break, which is still in its early stages, Bitcoin has moved up by 48%, and alternative currencies have moved up by 23%
⌛️ This period may extend into the first quarter of 2026, and it is essential to monitor developments closely with daily and weekly follow-ups
