Traders

Dogecoin investors open Dubai’s first DOGE-themed crypto eateryVirtual chain restaurant provider Rocket Kitchens has unveiled the first Dogecoin-inspired cryptocurrency burger joint in Dubai.
The restaurant named Doge Burger will also allow payments through Bitcoin, Ethereum, BNB, CRO, XRP, USDT, and Shiba Inu, local outlet Time Out Dubai reports.
On the menu, the restaurant will offer a beef burger, chicken burger, mushroom Swiss burger, a charcheese, and garden burger alongside hot dogs.
Customers can place orders through the restaurant’s website, where the cost of the burgers will range from Dhs35 to Dhs50.

A Chat With Traders: Traders And Psychology With EnochEnoch Baz, the 19-year-old, who literally pays his mama’s bills with: forex trading. Baz is a penultimate student of Architecture in Nigeria. He started forex because according to him, “it’s the only way I can work minor and earn major from home”.
Enoch is an indices fan as he says, “that’s where the money is for me (lol). Work less, earn more.”—US30 and S&P500 do the trick. Chatting with Baz made me realize his undeviating and unswerving approach to trading these pairs. “I trade against Supply and Demand zones looking to be Liquidated and Mitigated”, he utters.
The trader also advances to explain this strategy. To Enoch, It’s more of combining Zone to zone with smart money trading (institutional trading)”.
In addition, he got introduced to Forex in October 2018, after he graduated High-school—by his cousin who’s not a trader currently. Albeit, he took it seriously in 2019. Enoch started off making researches and reading multiple PDFs in his genesis.
Enoch And His Trade Management
Hello Baz, so, how do you manage a trade when in it?
Yeah, before I hop into any trade, I have 3 goals: Firstly, I close with big profits, secondly, small profits, and lastly small loss. Either way, I let my trade run. After I’m in—I go ahead with my day. I always have my risk in mind. Once I’m fine with it, It’s a good day then.
Love the simplicity I must add. However, social media has allowed us as traders to have a wider footprint outside of the forex industry, what do you think your impact is in the industry?
Well, I started my forex-focus-Instagram-account in October 2020, I’ve gotten a lot of messages regarding me leveling up individuals-forex game involuntarily from contents I post. It has been a good impact—helped people over the world know what this grind could bring.
Love the term “over the world” What is your trading plan? And what is your go-to asset class (what pair(s) would you consider are your favorites) and why do you prefer these pairs?
As for trading plan, It’s definitely the: Zone to zone ( risking just 4% of my account maximum), cos of its simplicity & direct approach to the market. I started trading XAUUSD, but currently, I trade indices like US30 & SPX500. Reason—that’s where the money is for me lol. Work less, earn more.
Enoch On Trading Techniques
Work less; Earn more. Yeah—the fun of trading the indices. Do you have a special way you trade this particular pair? If yes, can you share a tip for that pair?
Trade against Supply and Demand zones looking to be: Liquidated or Mitigated. It’s more of combining Zone to zone and smart money trading (institutional trading).
Woah. That’s a lot to take in. However, Fast one Technical, Fundamental or Sentiments? Why?
Technical. Although, fundamentals fuels the market, but only runs for a certain period. After that, we are left with the naked chart. So, Technical is king to me.
A personal question, How much money do you handle now?
Well, I handle two accounts: a $30,000 and a four figure on synthetic indexes.
That’s huge and inspiring, What are your forex weaknesses? How do you plan on going about them? Have you succeeded in doing that?
Forex weakness? Hmm. I’m thinking about that. I basically just trade my thing and what I have an edge in.
Totally threw me of with that one. The confidence. I admire that no doubt. Who is one person/academy you think Neophyte or everyone should follow and why?
Definitely—Cue banks. Following him on Instagram would give you valid reason not to quit.
Enoch In Trade environment and Work history
“Take a cue from cue”—I’ll do anything to interview him. He’s indeed a great trader. How would you describe your ideal work environment?
Love trading alone. So just me and my screens with—UK Drills music playing in the back ground.
The lone wolf. Tell me about a time you disagreed with a decision. A time you didn’t follow your trading plan. What did you do?
Took out my SL, I didn’t want to get stopped out because, it was a fundamental market on BTCUSD, short story, lost over 85% when I got back.
Ouch! What was your salary in your last job before forex? Was leaving it for forex worth it and why?
I’ve never worked a job. I was barely 16 when I started Forex.
Right. Makes sense—What are your trading aspirations? I know many trade for “financial freedom” but what happens when that’s achieved? What do you plan on doing with trading?
Plan on putting young boy and girls on this grind. I know what it feels like earning above average.
Enoch Talks Trading Psychology
Great plan. What keeps you sane? Cos’ I won’t lie trading can stress you out and some even get depressed. So how do you overcome this.
You know, I feel people risk money which they basically can afford to lose. Like I say, everyone needs to have a passive source of income to fund their trading accounts. That way, you stress-less after losses because it’s OPM (other people’s money). I leverage on OPM a lot, that way I don’t have to beat myself up after losses.
Other people’s cash. Hmm, That requires trust though. However, this may sound “cliché” but why forex? What is your major reason for choosing forex?
Personally, I got caught up with the lifestyle, but as a kid, I loved exploring. I had always wanted to test out everything, new gadget and stuffs I see. That way, I knew I could afford this when I make literally free money, that’s why I’m still trading; love giving major portions of my withdrawals.
Who doesn’t love a giver? Do you trade for any proprietary firm? If yes, which one and how is it going?
No, But FTMO is looking nice haha.
What would you consider to be your biggest forex achievement? Tell me about a forex accomplishment you are most proud of.
Being able to pay my mom weekly. Paying her more than her salary is a flex for me at 18. I’m also proud of being able to afford my trading gadgets without anyone’s assistance, fully funded by me and the markets. Good flex too. Also surprising my cousins with quite expensive gifts on their birthdays.
Aww. That’s really nice. Indeed a big flex for a trader your age. Okay Baz, Let’s visualize now. So what would you want your forex dream to be like (in details).
Inner circle for billionaire traders with the dope garages and cribs. That’s enough.
Enoch In The Business Of trading
Do you keep a journal? If yes, what does it consist of?
No journals. Just Notepads with Risk calculations.
Oh, okay. When you’re not trading, what are you doing?
On YouTube watching pranks and skits. I don’t watch movies longer than 15mins or I’m working on my “Social Media Management” site (SMM).
That interesting an weird. What would say is your “win-rate” and what really drives results in your trading?
Haven’t really had time to know my win-rate. But 78%- 82% is reasonable, because I rarely over trade. Haha! My Risk management is key, that’s my major sauce in trading. With my style of risk management, 38% win rate is still Profitable. I love hopping on high-rewarding trades.
Well, you ain’t lying. Listen, I think psychology is one of the most important if not the most important part of trading. So, that’s why I’m laying emphasis on it. What are your trading rituals and how has it helped your trading?
Pray, plan my trades and trade my plan. That way, I worry less because I’ve literally done the easiest things which are the most important things too.
Trading inspiration
Who or what inspired you to start trading? If you have a mentor, what’s their name and what about that individual inspired you?
I got inspired by Inyang Jude “Forex bae”. My cousin showed me his picture back in 2018. He was literally the first trader I saw from Nigeria. I’m grateful for the inspiration! Another mentor I have is MomoForex. His lifestyle is simple and that’s me.
Yeah. I actually love Nick Shawn. I believe he was a mentor to Momo—drop a forex secret you feel should be shared and no-one talks about.
How much are you risking on this trade? if you can’t answer that before taking the trade, don’t trade. Because I feel most people get surprised by how much they lose on a trade. They lack the background idea of how much they should be risking.
Interesting. How long do you plan on trading forex and Where do you see yourself in five years with forex?
Till forever. Let’s wait
Enoch and trading strengths
What are you biggest strengths in forex and What’s one thing you think you are very good at in forex?
That will be, determining market directions in the long run.
Nice. We have the Neophytes trooping in the industry. What’s your advice to them and what would you recommend they start with?
Knowledge first. You’re here for a long run. “Do what is right and cash will flow”
You hear that, it’s always the knowledge first. How do you handle pressure, impatience, fear, doubt and greed in forex?
I only experience doubt. If you’re doubting a trade, it’s best not to take that trade. And if you’re in a trade already and you doubting, it’s safer to close or move your Stop-loss very tight to curb losses.
Tell me about the toughest decision you had to make in the last six months. Was it a trading decision? If yes, tell me how you handled the situation.
Leaving a MLM company (best decision). I left this company that offered to help my trading journey. But it was clear BS! Full of fake traders and lifestyle. I was earning 3 figures for two months. My journey skyrocketed after I took the bold step to leave that company and start trading Full-time. Grateful for the growth now.
You calling MLM out like that, makes me want to ask further but, I WON’T PRY. Tell me how you think other people would describe you. What do you want to be remembered for in the industry?
Don’t really care of how anyone would describe me, Everyone has various opinions. I want to be remembered for the impact.
Trading traits
Straight-forward. Like that… What are traits do you have that keeps you successful?
Fearless. I take calculated risk always I involve myself in profitable relationships.
I know this particular question may sound weird. The reason asked is because as humans we have the whole “act now, think later” thingy going on even when it’s not the right thing to do. So, do you have a trading “guilty pleasure”? If “yes” what is it and how do you handle it when it happens?
Heh, FOMO “Fear Of Missing Out” from cryptos, If you don’t ignore the internet noise these days, you tend to hop on trends due to the hype and find yourself getting screwed up after.
I can hugely relate. We all talk about trading psychology, what can you say about that? Good question Baz. What is your go-to strategy? I would also love that you explain why that is your go-to. Do you have a major reason why you chose that strategy and how it has helped sharpen your trading.
Why beat yourself up when you were not comfortable risking such amount of money? That’s the major thing I can say. Always going to be: zone to zone. I spend two minutes analyzing a trade that would be take a regular trader hours. Yeah, it helped me create more time to do other important thongs.
Final words from Enoch
What’s your take on Neophytes that want to learn forex? Do you prefer they paid for the knowledge or stick with YouTube videos and free materials?
This question. First of all, there are two ways to acquire knowledge. By Discovering or Duplicating. These two approaches require different sacrifices. Time or money. When Discovering, You spend time in search of knowledge, absorbing but important & less important stuff. As time goes on when trading, you’ll find out you have a lot of things to unlearn cos they’re literally useless. That way, you spend another precious time trying to focus on the main sauce. For Duplication, you meet a “Guru” Mentor, who’s been in the game for a while, this way you don’t have to pass through the process of sourcing for a scheme. This guru puts you on what’s needed in the market and that way, you’re starting the major aspect of the market with enough time to execute Knowledge gained (while someone discovering is still trying to unlearn some things) either way, experience is important.

GBPUSD: Join Buyers ⏏️The impulse breakout from the morning announcement has a bullish imbalance within it. As soon as the imbalance is filled on the footprint, we can proceed to buy into the trapped buyer zone.
Updates to follow Alkalites!
Traders, if you have your own opinion about this idea, write in the comments section, I always reply. 💬
🚨 RISK DISCLAIMER:
Trading Crypto, Futures, Forex, CFDs, and Stocks involves a risk of loss.
Please consider carefully if such trading is appropriate for you.
Past performance is not indicative of future results.
Always limit your leverage and use a tight stop loss.
--------------------------------------------------------------------------------------------------------
Please like, subscribe, and share this idea with others! ⬇️
--------------------------------------------------------------------------------------------------------

Gold XAUUSD - Bullish - I l ook to Buy at 1840-42
◾ The continuation higher in prices through resistance has been impressive with strong momentum and shows no signs of slowing
◾ We can see no technical reason for a change of trend
◾ A weaker opening is expected to challenge bullish resolve
◾ Support is located at 1840 and should stem dips to this area
◾ Dip buying offers good risk/reward
Stop: 1825
Target 1: 1874
Target 2: 1900
Chart

A Chat With Traders: Traders And Psychology With JohannaJohanna a 22 years old forex trader—with an enthralling background and compelling story. The Sudanese trader’s story starts from: Cameroon and Norway. Johanna was born in Cameroon but, bred in Norway.
According to her, “emotional intelligence is a crucial part of forex trading”. Albeit, traders don’t really talk about it. However, she prefers to trade in a converse way in relation to other retail traders. “I didn’t know I would be so affected by psychology in this game”, she mutter. In addition, “I’m a risk-taker. I love taking risks”.
Who is Johanna?
Originally from South Sudan, born in Cameroon but raised in Norway. I am currently both: a dental student and an upcoming day trader. Was first introduced back in 2018 through another female trader posting it on Instagram but—because of fear and lack of motivation, I did not take it seriously until late 2019.
Had jobs in different branches: from store employees, elder homes, and customer service. None of them have really fulfilled my perspective of living my life on my own terms.
So when I got introduced to trading, I knew it could give me the freedom I was looking for. What I didn’t first know, was the work, effort, and knowledge that was required. My first initial thought was to give someone else my own money to trade for me whilst learning, just for me to become a victim of scams on my earliest day.
Moving forward, after almost 10 months of trading live, I’m looking to get the right skill needed for me to handle the market in the long term but also educate and inspire more females to join the industry.
Woah, Johanna that’s some kick wass intro. I wouldn’t continue until this question is asked though. How long have you been trading? How did you learn forex and come to know it?
It has already been year on a live account. But, I was 5 months on demo before that.
Johanna’s On Trade And Psychology
The previous chat I had, inspired this particular question. Social media has allowed us as traders to have a wider footprint outside of the forex industry, what do you think your impact is in the industry?
The industry is heavily male-dominated and I really want females to contribute and represent another side. I’m also big on learning the right skills; from the right people so you don’t get scammed easily in this industry.
That’s you speaking from experience there. Right? Do you have a special way you trade this particular pair? If yes, can you share a tip for that pair?
My approach is a bit different: as I look to trade the strongest and the weakest pairs. I will therefore look for these pairs during my market preparation—this will also help me to understand the directional bias for further analysis.
Hey, Johanna—are you a technical or fundamental fan?
Technical and fundamental. I personally feel like both are important to have an overall look of the market and why things happen the way it does.
Without a doubt. Loving the way you’re handling this questions. What is your go-to strategy? I would also love that you explain: why that is your go-to. Do you have a major reason why you chose that strategy and how it has helped in improving your trading.
I like trading the opposite of what retail traders generally do, and as an Intraday/Swing trader, I prefer to look out for major liquidity grabs and trade from those areas.
“The opposite”. How can you tell—Just a curious cat here. By the way, Who/what inspired you to start trading? If you have a mentor, what’s their name and what about that individual inspired you?
Haha. The freedom to be able to trade from wherever and whenever I want is—definitely the inspiration. Those who inspired me are: Melisa Hilma, Cue banks, Forex with ally, and the Gold father
It’s research time for me—I guess. However, still on psychology, What keeps you sane? Because I won’t lie—trading can stress you out and some even get depressed. So how do you overcome this?
Hmm. I trade with an amount that doesn’t affect me, adjust my risk management to a level where I feel comfortable trading, and ready psychology books both for trading and personal development.
Okay, that works. Especially the reading part. I know this particular question may sound weird. The reason asked is: as humans we have the whole “act now, think later” thingy going on even when it’s not the right thing to do. So, do you have a trading “guilty pleasure”? If “yes” what is it and how do you handle it when it happens?
Made this mistake a lot in the beginning. Albeit, I’ve tried to work on being very strict and journal every time—I might do this mistake to then go over it during the weekend. If greediness occurs, I really need to take a step back and look at my plan, checklist, and rules before taking a trade.
Someone’s disciplined. Tell me—what are the three traits you have that keeps you successful? And what three traits do you hope to have in trading that would make you a consistent trader?
A big risk taker, I love taking risks. Being consistent and systematic as a person, also helps me become a better trader and the appetite to always learn something new! As a trader you meet so many challenges, you can never be bored!
Truth to that. It’s amazing the discoveries one can get from just trading. Speaking on bore-dom—When you’re not trading, what are you doing?
I study, read and I like meeting friends. In addition, the Corona virus has also made me start watching some new tv shows. I love to bing watch them on: Netflix and HBO.
Yeah being hooked on some shows as well. Tell me about a time you disagreed with a decision. A time you didn’t follow your trading plan. What did you do?
There was this one time where I did something. Though, I do not recommend it. Took a trade into a news event. That’s personally against my rules. I still did it and it went away for a while before it reversed and hit my stop loss. The worst part was: I was trading Nasdaq100 (indices) that moves very fast and can easily blow up your account with one bad move.
Eish! I can definitely relate. Nasdaq’s my field. How do you handle pressure, impatience, fear, doubt and greed in forex?
You know what, I don’t work well under pressure—so, I can’t be dealing with anything that might pressure me to do something outside my plan. I’m actually a very patient person and I haven’t really rushed in the market. Things take time and I accept it. I might doubt myself sometimes but I keep thinking that others have done the same but they are now in better situations. Same thing with greed. Greed will test you in the market but, taking control of that earlier in the trade will help you a lot. I take what I can from the market and I’m happy with that.
Well said. Johanna. Let’s visualize now. So what would you want your forex dream to be like (in details).
Too many dreams. My forex dream is just one of many things I need to accomplish. Being financially stable from forex is the first step, but investing in other assets and businesses is as important as my drive to learn forex.
Investing, compounding. A great dream. Who is one person/academy you think Neophyte or everyone should follow and why?
Really look up to Melisa Hilmi, the first person who introduced me to forex. She has a genuine drive for the market and has an amazing course from beginner stage to advanced. Also, she has an amazing track record, history and I appreciate people who do their own thing.
Haven’t really heard of her. Another assignment for me. What are you biggest strengths in forex and What’s one thing you think you are very good at in forex?
I’m a big risk-taker. This makes me less emotional when I trade: as I’m not attached to money—the same way as many might be in the beginning.
“Big risk-taker” That means you probably won’t relate to this question—But, Have you ever tried quitting? If yes, what did you do about it?
Yes. I took 2 months break after I got scammed and was really depressed. I got back up knowing that it was just a mistake. Trading is still something I should be able to try out but by myself.
Ouch. So sorry about that. By the way, speaking on losses—What was your greatest loss, how much was it?
My greatest loss so far is: $6000 in 2 days.
That’s crazy. What motivates you?
Being able to change how I and my family live. My younger siblings motivate me—even more. I want to give them much more than what I got when I was younger.
Aww. That’s so sweet. In trading, how do you manage a trade when in it?
While the trade is running, I make sure I have alerts on areas of key levels. I might check it one time every hour and might adjust my stop loss to make the trade risk-free.
I’m curious now. What’s your trading plan? And what is your go-to assess class (what pair(s) would you consider are your favorites) and why do you prefer these pairs?
I start off by looking at major news for the day/week and look out for events that might affect my trades. Most of my market preparation for the week happens during the weekend and I will focus on only executing my trades after that. I look for high probability trades and I have a checklist I mark off before, during, and after the trade. They include: my entry rules, exit rules, risk management strategy, and how I will manage my trade while it’s running. My favorite pairs are: GBP and NZD pairs.
Johanna speak on the Industry and It’s Newbies.
Hope to see your watchlist someday. I always ask this particular question. What’s your take on Neophytes that want to learn forex? Do you prefer they paid for the knowledge or stick with YouTube videos and free materials.
Spent a lot of time on YouTube and it helped me but—you should also take a course: as the information can be overloaded with free materials.
Yeah. Lots of free courses everywhere. Learning everything can be quite exhausting. This may sound “cliché” but why forex? What is your major reason for choosing forex?
Not funny but, I was first scammed in the crypto industry—I backed off from that. Then forex seemed like a reasonable market for me as it involved more than just studying currencies.
Lot of scamming on your part. Moving forward. We all talk about trading psychology, what can you say about that?
Didn’t know I would be so affected by psychology in this game. Pay attention to every move that affects your mindset and work hard on improving it.
Needed to hear that from you. Because, I think psychology is one of the most important—if not the most important part of trading. So, that’s why I’m laying emphasis on it. What are your trading rituals and how has it helped your trading?
When looking for high probability trades, I only take trades that matter hence—why I don’t need to take many trades every week. I stay out of bad markets and back-test my weekly losses.
Back-testing, important. What are your trading aspirations? I know many trade for “financial freedom” but what happens when that’s achieved? What do you plan on doing with trading?
Plan on making an educational space. Not just within trading, but also in finance. There are many opportunities out there: to better yourself financially. However, I see many people don’t take that chance due to: either lack of experience but also fear of losing money. I want to motivate more people to go for what they want.
Good-luck on these aspirations Johanna. It’s a great idea. What would say is your “win-rate” and what really drives results in your trading?
I would say I have a win rate of 68-72%. My results are driven by hours of back-testing different pairs and their movement.
Not bad really. Did you have a job though. If yes, What was your salary in your last job before forex? Was leaving it for forex worth it and why?
$1300-1700 a month. Definitely worth it. Not looking to go back to a corporate job anytime soon.
Haha. Forex stole you away. Tell me how you think other people would describe you. What do you want to be remembered for in the industry?
Very social and outgoing. I want to be known for someone introducing the market in a different way by: showing them both obstacles and good days. There’re too much fake lifestyle on social media.
Well, most are great marketers. Others, for social status. Do you keep a journal? If yes, what does it consist of?
Yes, I do. I have different sections where I journal my market, pips achievements, losses & wins, my risk percentage, and personal processed thoughts I had during the trade.
Nice. I’m really grateful for your time. Although, I won’t be leaving till you tell me about the toughest decision you had to make in the last six months. Was it a trading decision? If yes, tell me how you handled the situation.
No worries. Quitting my last job. It was a hard decision but I knew it was the right thing for me not only to pursue my trading dream but—also be able to focus on things that make me happy. I don’t regret it at all.
That’s tough. How would you describe your ideal work environment?
My ideal work environment is essentially an office filled with other female traders working to help and educate other upcoming traders like myself on their journey.
Yup. You’ve definitely got a great belief system. I’ll be looking forward to this Ma’am. You know we have the Neophytes now in the industry. In fact, more Neophytes are trooping in. What’s your advice to them and what would you recommend they start with?
Simple. Throw away the whole “I’m going to become rich in a few weeks”. Focusing on the money aspect will really turn your motivation off in the beginning as: you don’t even have the skill set. Focus on the skillset, and the money will come along.
Process first, then outcome. You couldn’t have said it better. What would you consider to be your biggest forex achievement? Tell me about a forex accomplishment you are most proud of.
When I was profitable enough to quit my job. It takes time, and I’m nowhere near where I want to be but—I have at least come a long way.
Positivity goes a long way. Do you have weaknesses—What are your forex weaknesses? How do you plan on going about them? Have you succeeded in doing that?
Social media can be a very scary place and as an upcoming trader, you will encounter a lot of different things. Comparing myself to other traders is a weakness of mine, but I keep reminding myself that their journey is different from mine and we all have our own path. I don’t really look at other traders that much anymore and just focus on myself and my own journey.
The media, if used wrongly is a deadly disease. Proprietary firms are in existence now. Do you trade for any proprietary firm? If yes, which one and how is it going?
No, not yet but I’m looking to take the FTMO when I’m ready.
Finally, before I leave you Johanna. How long do you plan on trading forex and Where do you see yourself in five years with forex?
Plan to stick to my written rules and risk management. I also look up everything that I don’t understand and learn from it. Progress is my everyday mission.

Harmony ONE triangle breakHi guys
Finally the triangle breaks up!
It can run into 0.23 target
Be aware about the bigger branch of triamge.
It can lead you to 0.23 for first target
Hope have good trades
🙏❤

CME gap fillingHello guys
You see the market trying to fill cme gap and its near.
Have good trades friends 🙏

Bitcoin price closes in on $40K,Traders expect BTC to flip $40,000 back to support soon, but derivatives metrics signal that a different outcome could occur.
The Bitcoin (BTC) daily price chart seems to be making a steady recovery pattern, but some concerning indicators are coming from derivatives markets. At the moment, the futures and options markets are showing a lack of confidence from Bitcoin pro traders, but there's a positive spin to the data.
The road to $40,000 seems uncomfortably predictable, and cryptocurrency traders usually call it "manipulation" when such price movements happen.
Regardless of the rationale behind Bitcoin's price recovery, investors should analyze derivatives markets to understand how whales, market makers and arbitrage desks are positioned.
While retail traders' favorite instrument is the perpetual contract (inverse swaps), pro traders often opt for fixed-calendar futures and options. Although they are more complicated to trade, these derivatives offer more complex strategies.
Liquidations are behind us, but so is the route to $69,000
Data shows that there hasn't been a relevant futures contract liquidation since Jan. 23. When leverage long (buyers) have their positions terminated, it accelerates the price correction, because derivatives exchanges need to sell those futures at market prices.
Notice how the last “big” forced position termination on longs was $290 million on Jan. 23. This partially explains why Bitcoin’s recovery was relatively tranquil over the past week. Still, the market is nowhere near being out of the water, considering that BTC is currently trading 44% below the $69,000 all-time high.
The Bitcoin futures annualized premium should run between 5% to 12% to compensate traders for "locking in" the money for two to three months until the contract expiry. Levels below 5% are extremely bearish, while the numbers above 12% indicate bullishness.
The above chart shows that this metric dipped below 5% on Jan. 21 and hasn't yet shown signs of confidence from pro traders.
So the big question is: Is the glass half full? For example, if Bitcoin breaks the $42,000 resistance, some traders will likely be caught off guard, so there's additional buying activity because no one wants to be left behind.
Bitcoin futures markets are neutral, but options traders are skeptical
Currently, it’s a bit difficult to discern a direction in the market, but the 25% delta skew is a telling sign whenever arbitrage desks and market makers overcharge for upside or downside protection.
If traders fear a Bitcoin price crash, the skew indicator will move above 10%. On the other hand, generalized excitement reflects a negative 10% skew.
As displayed above, we've been near 10% for almost a week despite the 18% BTC price recovery since the $33,000 bottom. The options skew data shows that pro traders are still pricing higher odds for a market crash.
Despite the not-so-positive indicator from Bitcoin options, these arbitrage desks and market makers will be forced to reverse bearish positions once the price breaks $42,000. However, considering that the futures premium did not show signs of desperation even as the market crashed 52% from the all-time high, the data provides a constructive view.
The views and opinions expressed here are solely those of the author and do not necessarily reflect the views of Cointelegraph. Every investment and trading move involves risk. You should conduct your own research when making a decision.

trapped long time ...Do not rush Bitcoin is still in the downtrend channel. There will be better times for long-term entry. In the daily time frame, the market trend may be positive for a few days. But keep in mind that the overall market trend is currently declining and Bitcoin and the market as a whole are trapped

BITCOIN (BTCUSDT) QUICK TA SCENARIO...Let the image speak for yourself...
------------------------------------------------------------------------------------------------------------------------------------------------------------------------------------------------
If you enjoyed this post and agree with me, a like and a sub would be very nice : )
If you have any other ideas or simply disagree, manifest yourself in the comments ⬇️⬇️⬇️
Stay updated for more content
Have a nice Day : ) Bye!
-----------------------------------------------------------------------------------------------------------------------------------------------------------------------------------------------

Market structure, learn how to easiy identify market condition.Market structures also referred to as market conditions are the simplest form of price movement in the market. Market structure is a simple and basic form of how price action occurs in the market. Price action in the market is always in one of these four market structures.
- Accelerating Phase
- Distribution Phase
- Decelerating Phase
- Accumulation Phase
Accelerating Phase:
This is the upward trending phase of the market, it is often characterized by a series of higher highs and higher lows. This phase of market structure is where bulls are said to be in control of the market.
Distribution Phase:
The distribution phase occurs after a rise in price as the traders who bought at the beginning of the trends begins to sell at a profit and more people are FOMOing into the market the market then enters a range. It is a ranging market after a downtrend. At this phase of the market, there seems to be a balance of power between the bulls and bears until either support or resistance level is broken.
Decelerating Phase:
What goes up must come down. Decelerating phase is the downward trending phase of the market and this phase of the market structure is where bears are said to be in control of the market. It is often characterized by a series of lower highs and lower lows.
Accumulation Phase:
This phase of market structure precedes the Accelerating Phase. It is a ranging market after a downtrend. This phase is where smart money managers and experienced traders begin to buy. At this phase, the general market sentiment is still bearish.
In Conclusion
Although not always obvious, market structure plays out in all markets.
Smart investors who recognize the different parts of a market structure are more able to take advantage of them to profit.
- Zoom in your chart screen to -30%.
- Train your reticular activating system to easily identify these structures in the market.

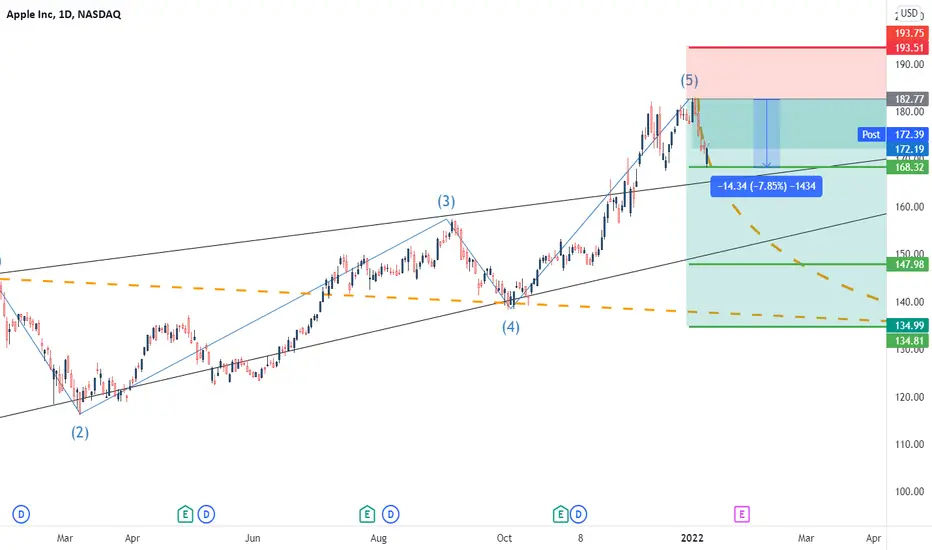
AAPLEHello Traders
As we shared our opinion about APPLE stock with you, this stock fall down about 8% and our first target is already done.143 pip from the enter point
our position is free risk from here and we are waiting for second target.
It is better for you to do the same
A Traders Psych Evaluation
1. Asides money, why else do you trade?
2. When you’re not trading, what do you do with your free time?
3. If you bagged a million dollars in trading today… what’s your first step?
4. Your favorite trading book—if any?
5. Who do you admire most in trading?
6. What are you most afraid of in trading?
7. If you could change everything about your trading career—what would it be and why?
8. What subject in school made the most impact in you?
9. If you died today, what do you wish to be remembered for?
10. Are you addicted to trading?
11. What’s the most defining moment of your trading career?
12. Your dream destination?
13. Your favorite trading memory?
14. What do you feel most proud of?
15. Who introduced you to trading?
16. What’s your worst/best childhood memory?
17. If you had a chance to do-over in life… what would you do differently?
18. What’s your strongest quality?
19. Most embarrassing thing you’ve done in trading?
20. What’s a skill in trading you wish to learn and why?

ETH/USDTHello traders and welcome back to another analysis on LaroGroups page
Here we have 2 scenarios for Ethereum
Good news is we have a strong weekly support level for Ethereum On 3000$ that can be a rejection place for this bearish move and make a good pivot to pull up the price again
But the bad news is if the support zone dose not work, we see the lower price till we reach the dashed line drawn on chart.

Will Etherium break falling channel ?????ETH price currently moving in a rising channel in short time .................
Overall price moving in falling channel and this channel's middle line acting as a resistance and price rejected from it many times...........
local support :-3780-3770...............
Major support :- falling channel's lower line.............
Local resistance :- middle line of the falling channel...........
major resistance :- upper line of the falling channel.............
#DYOR #NFA

Shiba watchHere we are shiba analysis. We see shiba hitting the resistant line. Broke up to .000004. Doing the regular pull back. If shiba holds and make higher high we may see a bull run in the next few weeks. Alot of holders around the world holding shiba. Shiba broken The Golden line. Watch this coin. Like and follow for free analysis.

UK100 BREAKTHROUGH AND RETEST THE RESISTANCEThe FTSE 100 index is well placed to extend its recent run higher ahead of the Bank of England’s decision on UK interest rates next Thursday. Once seen as almost certain, a rate hike has become less likely because of the spread of the coronavirus Omicron variant.
That’s positive for UK stocks even though the Government has already responded by tightening the pandemic rules in England. Masks will now have to be worn in most indoor public places and employees have been told to work from home if they can.
The UK FTSE 100 index traded lower on Monday and touch and retest the broken resistance line from December 6th of the downtrend formed from drawn from the high of November 12th. That said, the slide was paused near the 7220.00 level, still above the prior downside resistance line. As long as the index is trading and stopped on that level and in combination with that the traders sentiment is net long, it would be interesting to see how the price will react in the following days.
In order to start examining whether the outlook has darkened further, the experts would like to see a clear dip below 7180.00, support marked by the inside swing, and 61.8Fibo correction. The price will already be below the aforementioned downside line and the bears may get encouraged to push the action towards. If they are not willing to stop there, then we could see them pushing towards the low around 7115.00 or lower to 38.2Fibo correction around 7050.00 or lower to the strong support and psychological level around 7000.00.
On the upside, the experts would like to see a clear rebound back from the current levels before start examining whether the bulls have gained full control again. This will take the index above the upside line and could aim for the 7370.00 or 7397.00 zones. Another break, above 7397, could see scope for extensions towards the peak of February 21st, 2020, at around 7460.
Looking at our oscillator indicators we have to notice that MACD and RSI are very close to the oversold zone but also noted big short volume bars at the end of the year.
Risk Disclosure: Trading Foreign Exchange (Forex) and Contracts of Difference (CFD's) carry a high-risk level. By registering and signing up, any client affirms their understanding of their own personal accountability for all transactions performed within their account and recognizes the risks associated with trading on such markets and such sites. Furthermore, one understands that the company carries zero influence over transactions, needs, and trading signals. Therefore, it cannot be held liable nor guarantee any profits or losses.

BTC_USDT,WrongThe blue area is a resistance area and according to the behavior shown by the price, it should once again test the area of $ 42,000 to $ 44,000.
So for now, the move is negative for us in the short term

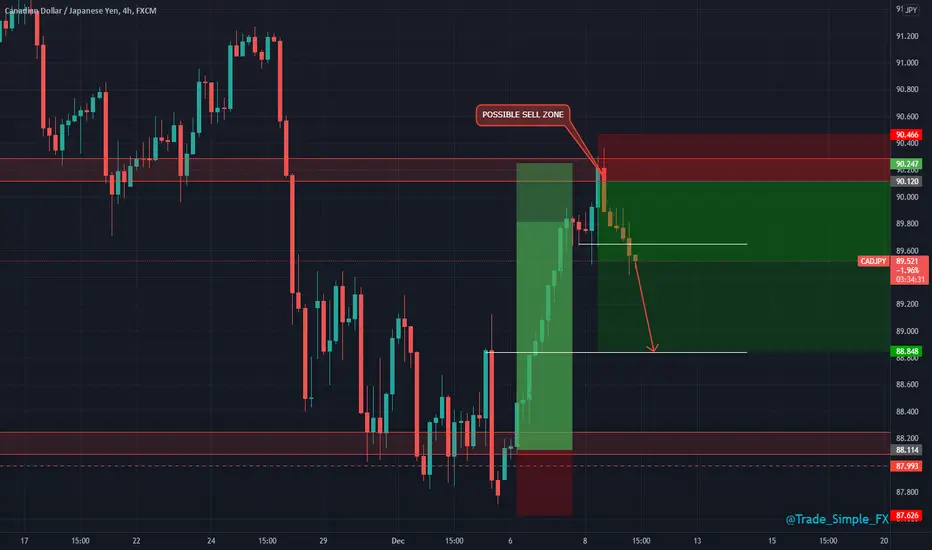
CADJPY H4 - Short SetupCADJPY H4
Snapshot of next anticipated move for this trading pair, seeing some really nice corrective selling pressure from our marked zone, hopefully we correct down to at least 800 price with the same momentum.
DXY Bullish movementKindly what am looking now for DXY is to continue bullish till we tap that first weekly LQ level and another confirmation no break in structure to both HTF 1D and 1W

1INCH trap idealet's try to be the trap some traders on 1INCH,
we could try to enter below the last two relative lows where lots of traders have their stops.
In that spot we are facing also a pretty cool demand zone so I am expecting some serious reaction,
the risk-reward 1:5 is nice and it's worth a try

S&P500 D1 - Long Investment DCAS&P 500 D1
Fresh highs set here on S&P yesterday too before US stock market close. Significant gains and performance. The DCA instruments for new stock/index fund investors. The go to!
If you're looking to invest your first $100, this is something I'd consider looking at!
