PLTR CAUTION!PLTR is at a key critical area, which has already given a warning shot to bulls.
We have a complete rising wedge structure with 3 waves up and a hook that has already cracked! Within it, we also have a head and shoulders at the top, which is bearish. (H&S not a top is usually a continuation pattern.) AS is always the case, if the overall market is not ready to head south, it will fail as a full-on reversal pattern.
I urge CAUTION!! to PLTR bulls.
For shorts, you need to see a crack, gap fill, plus follow through for a new lower low in a small time frame. You can't have a reversal without lower lows and lower highs.
Thank you ALL FOR getting me up to 5,000 followers!! ))
Click boost, follow, comment nicely for more authentic, no BS, raw analysis. Let's get to 6,000 followers. ))
Trading

NZD-USD Bearish Wedge! Sell!
Hello,Traders!
NZDUSD formed a bearish wedge structure and broke its lower boundary, hinting at bearish continuation toward the next liquidity level resting below. Time Frame 4H.
Sell!
Comment and subscribe to help us grow!
Check out other forecasts below too!
Disclosure: I am part of Trade Nation's Influencer program and receive a monthly fee for using their TradingView charts in my analysis.

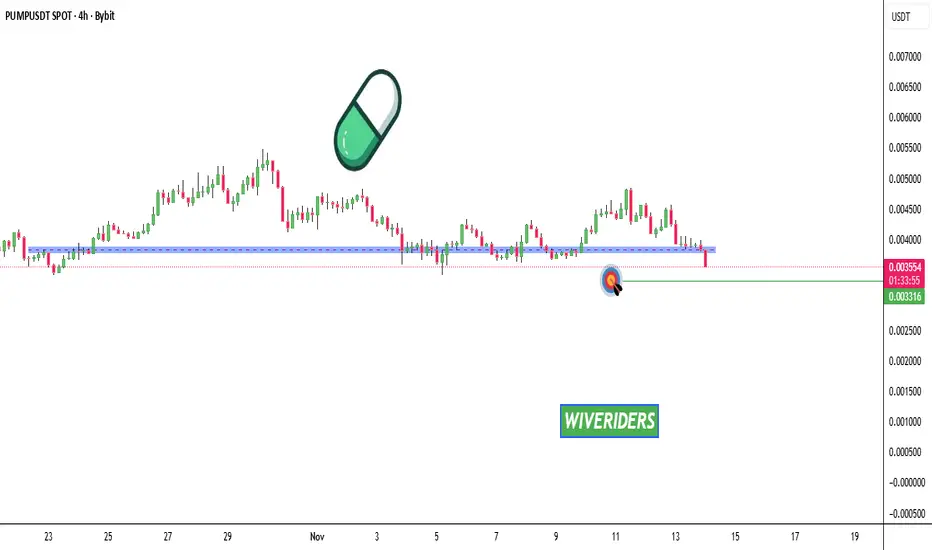
PUMP Update📊 PUMP Update
PUMP has broken below the blue support zone 🔵
Price could continue moving down, at least toward the green line level 🟢
Structure remains bearish as long as it stays below the broken support 🔻
DYDX/USDT – Working within the horizontal channel. Continuation.dYdX - is DeFi’s pro trading platform and a pioneer in decentralized finance, known for being the first to offer decentralized margin trading and derivatives, as well as inventing flash loans and DEX aggregators in 2018. Built on a custom Layer-1 blockchain using the Cosmos SDK, dYdX provides a professional-grade, decentralized trading experience with high leverage, deep liquidity, and low fees. Governed by the community through the DYDX token, dYdX is focused on delivering a transparent and user-driven financial system.
CoinMarketCap : #107
I've been working within this channel for about 2.5 years.
From my previous trading idea, two marked zones were reached:
1.6447 (+80%)
2.5007 (+176%)
The maximum squeeze reached +185.5%.
I'm continuing to work within the channel.
Last time, liquidity was accumulated below the support of the inner channel.
Now, liquidity is being gathered below the support of the outer channel—as always.
I've marked potential final liquidity grabs on the chart, as well as resistance zones where the price is likely to react.
The profit is significant, and if you work with compound interest, well… I'll just keep quiet—not everyone understands this and keeps waiting for the final rally.
A reminder:
Right now, fear dominates across all coins. This is the phase where nobody wants to buy or where many have already run out of funds. Why? Because, as always, most people buy at the top.
Take all of this into account in your trading strategy.

The mistake that kept me broke for 2 years!Hey @TradingView Community, I want to tell you something personal...
For two years, I was stuck.
I kept losing trades and I couldn’t figure out why.
It wasn’t because I didn’t work hard.
It wasn’t because I didn’t study the charts.
It was because I was following a trading style that looked smart on paper but failed in real life.
Every week, I waited for that ONE “perfect” setup.
I told myself, “This is how real traders do it.”
But most weeks, nothing came.
And when I finally saw something, I was either late or scared to take it.
Then came the worst part.
After waiting for days and missing good trades, I got frustrated.
So I started forcing trades just to feel like I was doing something.
And of course, I lost even more.
It became a loop:
Waiting → Missing → FOMO → Losing.
Even more? I traded based on emotions and started to add to losing positions! And of course, more losses.
It was too complicated, too slow, and not made for real traders like us.
And of course, everything was built on a foundation of simple to advanced chart patterns and Smart Money Concepts (SMC), candlestick patterns, Elliott waves... I’ve experimented with nearly every well-known form of technical analysis you can think of.
After thousands of hours of studying and backtesting the charts, we discovered a powerful and consistent edge rooted in Wave Analysis.
From our research and findings, we developed our own unique system, the We Trade Waves Wave Analysis Concept. You can see the proven results on our website.
But we also realized that analysis is only one part of the equation, the most important part is building the right mindset and finding your own balance, all while following a proven trading system like the one we’ve built and refined today.
We created a trading system you can follow in a simple and calm way.
You need a working trading system that takes about 15 to 30 minutes a day, and it actually works.
The system that helped me get my time, focus, and money back.
It's the same We Trade Waves system we are teaching to We Trade Waves members now.
And don't forget WTW 4 Golden rules!
1) Do not jump in
2) Do not over risk/trade
3) Do not trade without Stop Loss
4) Never ever add to a losing position!
Take with care,
Alain M(Coach)
WTW Team
TVC:GOLD NYSE:DOW SP:SPX NASDAQ:NDX

DCR Update📊 DCR Update
DCR is testing the blue support zone 🔵
A break below this level is possible, which could signal further downside 🔻
Watch this zone closely — it’s a key level for the next move.

AERO Update📊 AERO Update
AERO has formed a double top pattern 🔴 and is now in a downtrend 🔻
It could drop about 8% more, possibly reaching the green line level 🟢
Trend remains weak, so stay cautious and watch for confirmation.

SPX Update📊 SPX Update
SP:SPX has broken below the blue support level 🔵
As long as it doesn’t move back above this level, it remains bearish 🔻
Structure shows continued weakness — watch for the next support zone.
BTC Update📊 CRYPTOCAP:BTC Update
Remember guys — BTC can still move toward the $92,000 area 💰
This level lines up with the CME gap that could be filled 🔄
Nothing guaranteed, but it remains a possible target if the trend continues 📈

NZDJPY - The Wall of Sellers Awaits!⚔️NZDJPY is once again approaching a massive resistance zone highlighted in red, an area that has rejected price multiple times in the past, acting as a strong supply wall.
📉As the pair nears this level , I’ll be looking for potential short setups, expecting a bearish rejection that could drive price back toward the lower support zone around the previous lows.
This range has defined the market for months, and until a clear breakout occurs, playing the range remains the optimal strategy, sell high, buy low.
Will the bears defend this zone one more time? 👀
⚠️ Disclaimer: This is not financial advice. Always do your own research and manage risk properly.
📊All Strategies Are Good; If Managed Properly!
~Richard Nasr

GBPUSD: Very Bearish Outlook 🇬🇧🇺🇸
Intraday price action on GBPUSD looks very bearish after a recent
test of a significant daily resistance that we discussed earlier.
The occurrence of a bearish imbalance indicates a highly probable
down movement.
I anticipate a fall at least to 1.3064
❤️Please, support my work with like, thank you!❤️
I am part of Trade Nation's Influencer program and receive a monthly fee for using their TradingView charts in my analysis.

USOIL Will Grow! Long!
Please, check our technical outlook for USOIL.
Time Frame: 1D
Current Trend: Bullish
Sentiment: Oversold (based on 7-period RSI)
Forecast: Bullish
The market is approaching a significant support area 60.422.
The underlined horizontal cluster clearly indicates a highly probable bullish movement with target 65.013 level.
P.S
We determine oversold/overbought condition with RSI indicator.
When it drops below 30 - the market is considered to be oversold.
When it bounces above 70 - the market is considered to be overbought.
Like and subscribe and comment my ideas if you enjoy them!

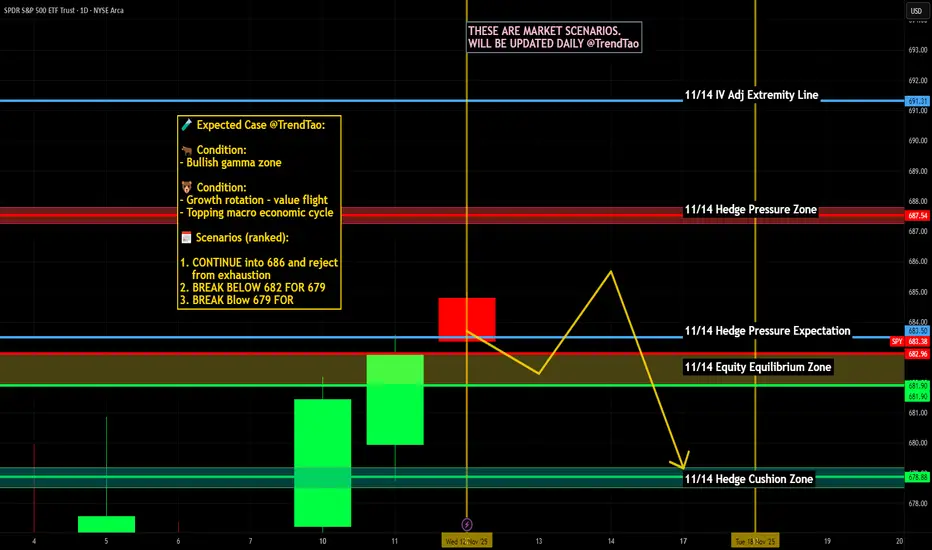
$SPY $SPX Scenarios — Thursday, Nov 13, 2025🔮 AMEX:SPY SP:SPX Scenarios — Thursday, Nov 13, 2025 🔮
🌍 Market-Moving Headlines
🚨 Inflation spotlight (⚠️ delay risk): October CPI and Jobless Claims — both subject to government shutdown delay — were originally scheduled for release this morning. Markets may stay cautious or reactive to leaks and private inflation trackers in the absence of official prints.
💬 Fed rotation continues: A packed Fed lineup — Mary Daly, John Williams, Kashkari, Hammack, and Bostic — will steer tone across the day, shaping expectations for December guidance.
📉 Budget check: A fresh federal deficit report (-$215B) adds to the fiscal backdrop narrative, though reaction may stay muted if major data doesn’t hit.
📊 Key Data and Events (ET)
⏰ 8:00 AM — Mary Daly (San Francisco Fed) speech
⏰ ⚠️ 8:30 AM — Consumer Price Index (Oct) | +0.3% MoM | +3.1% YoY (subject to delay)
⏰ ⚠️ 8:30 AM — Core CPI (Oct) | +0.3% MoM | +3.1% YoY (subject to delay)
⏰ ⚠️ 8:30 AM — Initial Jobless Claims (Nov 8) | 225,000 forecast (subject to delay)
⏰ 9:20 AM — John Williams (NY Fed) welcoming remarks
⏰ 10:25 AM — Neel Kashkari (Minneapolis Fed) opening remarks
⏰ 12:15 PM — Alberto Musalem (St. Louis Fed) speech
⏰ 12:20 PM — Beth Hammack (Cleveland Fed) speech
⏰ 2:00 PM — Monthly U.S. Federal Budget (Oct) | -$215B deficit vs -$257.5B prior
⏰ 3:20 PM — Raphael Bostic (Atlanta Fed) speech
⚠️ Note:
CPI and Jobless Claims carry the highest market impact this week — but both remain at risk of delay due to the ongoing federal data blackout. Fed speakers and any CPI proxies (like Cleveland Fed’s nowcast) will drive intraday volatility instead.
⚠️ Disclaimer: Educational and informational only — not financial advice.
📌 #SPY #SPX #trading #CPI #inflation #Fed #Williams #Bostic #Musanlem #Hammack #macro #markets #yields #shutdown
AUDUSD Is Bearish! Short!
Please, check our technical outlook for AUDUSD.
Time Frame: 1D
Current Trend: Bearish
Sentiment: Overbought (based on 7-period RSI)
Forecast: Bearish
The market is trading around a solid horizontal structure 0.658.
The above observations make me that the market will inevitably achieve 0.641 level.
P.S
Overbought describes a period of time where there has been a significant and consistent upward move in price over a period of time without much pullback.
Like and subscribe and comment my ideas if you enjoy them!

Stop Overcomplicating Trading: The Consistency Blueprint No One Stop Overcomplicating Trading: The Consistency Blueprint Nobody Wants to Talk About
Two decades in the market have taught me a very real truth:
Profit isn’t about being the smartest or catching the breakout. It’s about showing up for yourself every week; especially when motivation disappears and the trades get hard.
I’ve been at this 20 years; through bull runs, ugly drawdowns, burnout, and those quiet Sunday reviews where nothing made sense. The only thing that’s kept me in the game and steadily profitable? Building ultra-simple consistency habits that actually fit my life.
Let me give it to you straight: here’s how to move the needle, no matter where you are:
Forget perfection. Track what REALLY matters.
For most, it’s not a magic strategy—often it’s reviewing trades, keeping promises to yourself, and taking care of your brain and sleep before the next setup.
Pick 2-3 metrics and make them sacred:
For me, it’s weekly trade review, a “focus” score for my setups, and legit sleep tracking. I only look at these, period.
Make review time non-negotiable:
I set aside 20 min a week, never skipped. It’s my reset button after wins and losses.
Write out quick wins & lessons—immediately after they happen.
Let the good trades teach you, but also let the ugly ones humble you and anchor your next week.
Adapt your process to real life:
Swing trading while working? Happens. Family? Kids? You can STILL win long-term—just make the review and tracking match your schedule, not some internet hustle template.
Build the feedback loop
When you slip, note it fast and tweak (don’t obsess). When you nail it, reward yourself—not with risk, but acknowledgment.
How do you know it works? Because it’s kept me in profit while teaching hundreds of traders to turn routines into actual results.
If you’re battling for consistency DM me “Tools” or drop it in the comments. I’ll send my simple routines that changed the game for me and dozens of traders.
Let’s build consistency that lasts and celebrate small wins relentlessly.
If I can help, I will.
BOND Break Out?💣 Bonds Near a Major Breakout — And It’s Not Bullish for Risk Assets
We’re approaching a critical breakout zone in bonds.
At first glance, you might think: “High demand for U.S. debt? That’s great! Higher bond prices, lower yields, cheaper interest payments!”
That’s Trump-math logic — the same kind that says prices are “down 300%.” 😅 You can only go down 100%, folks. No matter where the price goes!
Here’s the real story:
For bond prices to surge, investors must be running from risk. Big money managers don’t dump billions into a $250k FDIC-insured savings account 😅 — they rotate into Treasuries when fear spikes.
That’s a double whammy:
1️⃣ Reducing margin
2️⃣ Stocks and other risk assets get liquidated.
When this rotation accelerates, expect risk assets to crater — the “buy-the-dip,” “crypto-Lambo bros,” “GME, AI memers” & "Colorful Chartists" crowd gets ANNIHILATED!
All of that from this one silly chart? No, there is no single holy grail of an analysis chart. Just a piece of the puzzle.
Smart money is moving to safety. Don’t get caught holding the bag. Keep an eye on this chart!
Thank you ALL FOR getting me up to 5,000 followers!! ))
Click boost, follow, comment nicely for more authentic, no BS, raw analysis. Let's get to 6,000 followers. ))

GOLD Will Move Lower! Sell!
Take a look at our analysis for GOLD.
Time Frame: 1h
Current Trend: Bearish
Sentiment: Overbought (based on 7-period RSI)
Forecast: Bearish
The price is testing a key resistance 4,235.87.
Taking into consideration the current market trend & overbought RSI, chances will be high to see a bearish movement to the downside at least to 4,172.53 level.
P.S
We determine oversold/overbought condition with RSI indicator.
When it drops below 30 - the market is considered to be oversold.
When it bounces above 70 - the market is considered to be overbought.
Like and subscribe and comment my ideas if you enjoy them!

Markets are flashing MAJOR warning signs…Markets are flashing MAJOR warning signs… NASDAQ:QQQ AMEX:SPY
In this video, we will look at the 21 ema on the Daily charts to review the move since April and where we could go from here.
If you have money in this market, you need to see this ASAP 👇

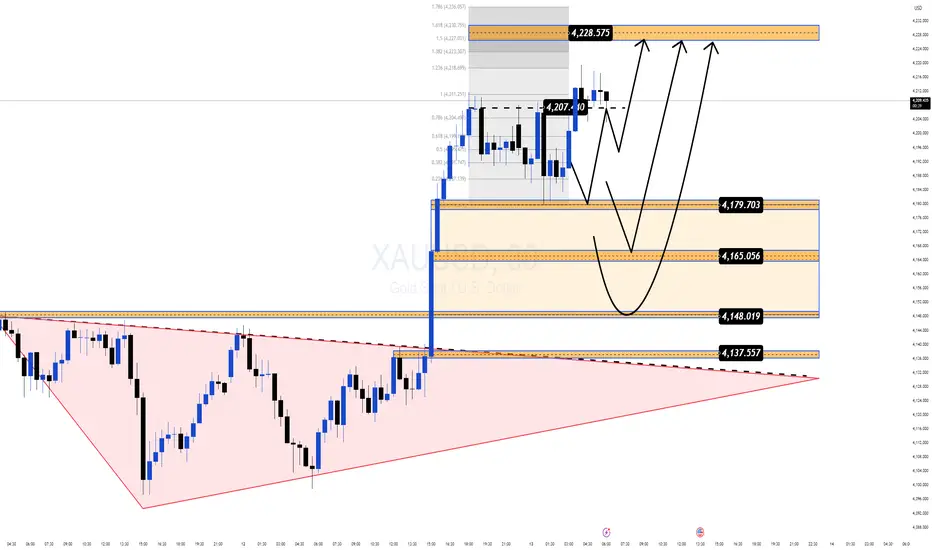
Gold Hits a 3 Week High but the Real Move Might Still Be LoadingGold just tapped $4,213 — the highest level in three weeks, powered by growing expectations of a dovish Fed and optimism around the potential reopening of the US government.
But the real story isn’t the headline spike — it’s the structure forming right beneath it.
📌 Why this zone matters right now
Price is pulling back into $4,179–$4,165, a clean Demand zone aligning with Fibo + breakout structure.
Buyers remain firmly in control despite a mild USD recovery.
The market swept liquidity around $4,207, hinting at accumulation before the next expansion.
The broader pattern resembles a falling-wedge breakout, often appearing before strong upside continuation phases.
🎯 Most Probable Scenario (Mind Insight)
Gold is in a “compression before expansion” phase.
Once this squeeze resolves, momentum is likely to continue in the direction that’s already dominant — and right now, that’s the bulls.
🔶 MMF BUY Zone
$4,179 → $4,165
Looking for a shallow pullback before the next leg.
🔼 Bullish Targets
• $4,207 (liquidity tap)
• $4,228 (Fibo 1.618)
• $4,236 (Fibo 1.786 — major reaction zone)
🧠 Key Takeaway
As long as Gold holds above $4,165, the bullish structure remains intact and the upside expansion toward the upper Fibo cluster stays in play.
EUR/CHF BULLS ARE STRONG HERE|LONG
EUR/CHF SIGNAL
Trade Direction: long
Entry Level: 0.923
Target Level: 0.928
Stop Loss: 0.920
RISK PROFILE
Risk level: medium
Suggested risk: 1%
Timeframe: 6h
Disclosure: I am part of Trade Nation's Influencer program and receive a monthly fee for using their TradingView charts in my analysis.
✅LIKE AND COMMENT MY IDEAS✅

ONDS Ondas Holdings Options Ahead of EarningsAnalyzing the options chain and the chart patterns of ONDS Ondas Holdings prior to the earnings report this week,
I would consider purchasing the 10usd strike price Calls with
an expiration date of 2028-1-21,
for a premium of approximately $3.95.
If these options prove to be profitable prior to the earnings release, I would sell at least half of them.

Silver (SLV): Multi-Year Cup & Handle SetupSilver appears to be repeating the same large-scale institutional “Cup and Handle” structure that played out almost perfectly on Gold.
The difference is that in SLV (iShares Silver Trust), the chart history is shorter, so the full formation is not as clearly visible — but if we reference the historical silver chart (since 1802), the pattern becomes unmistakable.
That long-term chart shows a massive multi-decade rounded base — the cup — and now price has already touched the upper boundary, effectively activating the pattern.
🧠 Technical Context
On the long-term silver chart, the handle represents the multi-year consolidation we’ve seen since the 2011 peak.
In SLV, this structure is compressed, but the correlation with physical silver remains ~99%, since the fund is backed by over 90% physical silver holdings.
This makes SLV an ideal instrument for expressing long-term silver exposure — it tracks spot silver almost tick-for-tick, while providing the liquidity and accessibility of an ETF.
Technically, silver has already tested the upper rim of the cup, confirming that the pattern is active.
This breakout will likely be followed by a short-term consolidation (the final part of the handle) before the market enters what could become a multi-year rally phase.
Based on historical fractals and volume structure, the first major pullback is expected toward the $35–25 zone, which corresponds to the previous 4th-wave cluster — a classic accumulation area in Elliott terms.
I’ll be looking to accumulate aggressively in the $35–30 range, scaling in gradually as price approaches those levels.
🎯 Trade Plan
Instrument: SLV (iShares Silver Trust ETF)
Correlation to Spot Silver: ~99%
Primary Support Zone (Accumulation): $25 – $35
Handle Breakout Level: around $50
Long-Term Target: $800+ (silver spot equivalent)
Stop-Loss: per individual risk management
Time Horizon: 5+ years
Once silver completes its consolidation and breaks above $50, the measured move of the Cup and Handle suggests a multi-hundred percent rally that could unfold over the next decade.
The breakout will likely be accompanied by rising institutional volume and strong follow-through momentum.
🧭 Strategic View
I trade silver exclusively through SLV, as it offers the most direct and reliable exposure to the underlying metal.
The fund’s near-perfect correlation with spot silver makes it ideal for implementing long-term accumulation strategies without the operational complexities of futures or CFDs.
This will be one of my core positions for the coming decade.
After the expected correction into the $30–35 range, I plan to build a large position, possibly hedged later on, and hold through the full bullish cycle.
Silver’s technical structure, macro fundamentals, and historical analogs all point toward a potential generational rally once this base completes.
This is the setup I’m positioning for — patiently, systematically, and with conviction.
Summary
Long-term “Cup and Handle” formation now confirmed
Final correction expected before the next secular rally
SLV offers near-1:1 tracking with physical silver
Accumulation zone: $35–25
Target: $800+ over the next decade

GBP-JPY Free Signal! Sell!
Hello,Traders!
GBPJPY is tapping into a key supply area where prior liquidity rests above equal highs. The market structure hints at exhaustion and a potential move lower toward discount levels as the supply level was clearly rejected!
---------------------
Stop Loss: 203.440
Take Profit: 202.300
Entry: 202.863
Time Frame: 4H
---------------------
Sell!
Comment and subscribe to help us grow!
Check out other forecasts below too!
Disclosure: I am part of Trade Nation's Influencer program and receive a monthly fee for using their TradingView charts in my analysis.
