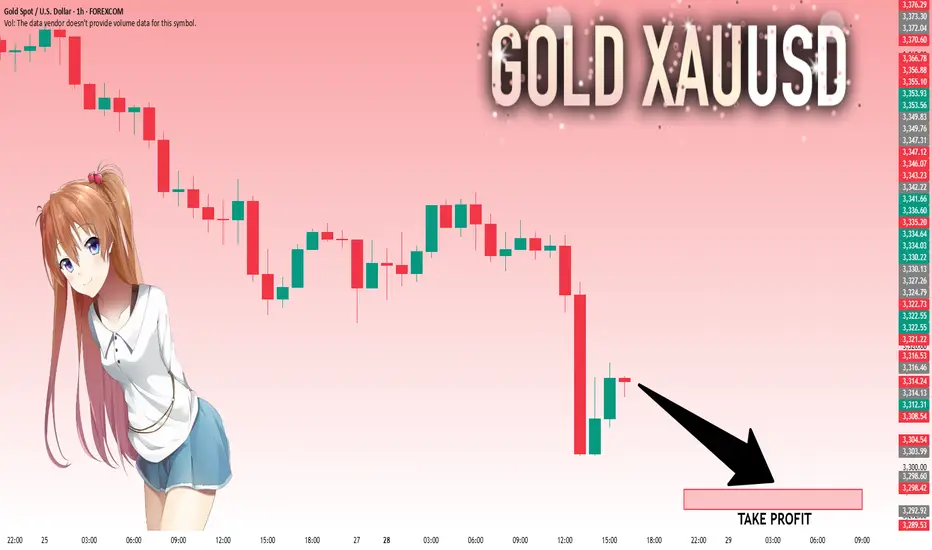
GOLD Epic Trendline Breakout! Sell!
Hello,Traders!
GOLD was trading along
A long-term trend-line but
It is broken now and the
Breakout is confirmed so
We are bearish biased now
And we will be expecting a
Further bearish move down
Sell!
Comment and subscribe to help us grow!
Check out other forecasts below too!
Disclosure: I am part of Trade Nation's Influencer program and receive a monthly fee for using their TradingView charts in my analysis.
Trading

USD_CHF SHORT FROM RESISTANCE|
✅USD_CHF has been growing recently
And the pair seems locally overbought
So as the pair is approaching
A horizontal resistance of 0.8064
Price decline is to be expected
SHORT🔥
✅Like and subscribe to never miss a new idea!✅
Disclosure: I am part of Trade Nation's Influencer program and receive a monthly fee for using their TradingView charts in my analysis.

USD-JPY Is Overbought! Sell!
Hello,Traders!
USD-JPY is trading in a
Strong uptrend and the pair
Will soon hit a horizontal
Resistance of 149.200
So after the retest a
Local bearish pullback
Is to be expected
Sell!
Comment and subscribe to help us grow!
Check out other forecasts below too!
Disclosure: I am part of Trade Nation's Influencer program and receive a monthly fee for using their TradingView charts in my analysis.

GBP_USD BEARISH BREAKOUT|SHORT|
✅GBP_USD is going down currently
As the pair broke the key structure level of 1.3380
Which is now a resistance, and after the pullback
And retest, I think the price will go further down
SHORT🔥
✅Like and subscribe to never miss a new idea!✅
Disclosure: I am part of Trade Nation's Influencer program and receive a monthly fee for using their TradingView charts in my analysis.

EUR-USD Support Ahead! Buy!
Hello,Traders!
EUR-USD is making a massive
Bearish correction and the pair
Is already locally oversold
So after it hits a horizontal
Support level below at 1.1568
We will be expecting a local
Bullish rebound
Buy!
Comment and subscribe to help us grow!
Check out other forecasts below too!
Disclosure: I am part of Trade Nation's Influencer program and receive a monthly fee for using their TradingView charts in my analysis.

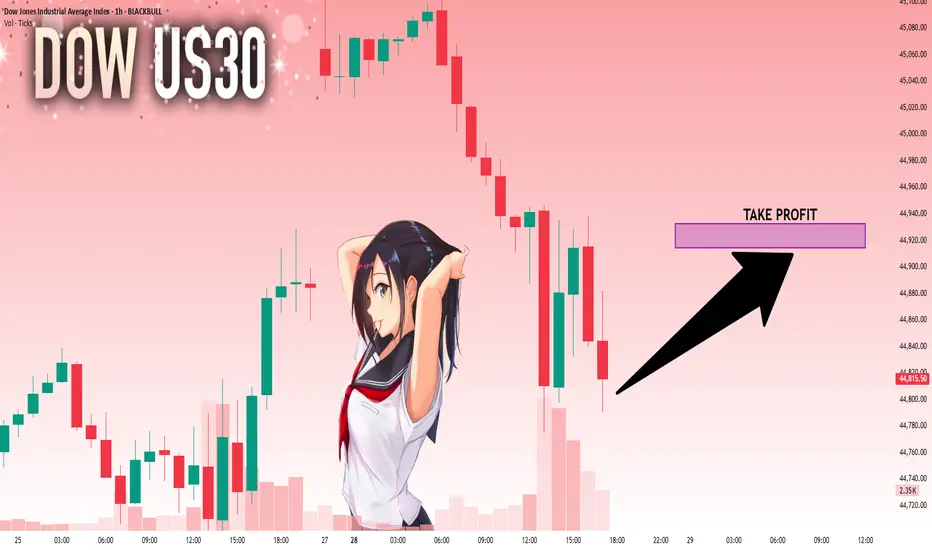
US30: : Local Bullish Bias! Long!
My dear friends,
Today we will analyse US30 together☺️
The recent price action suggests a shift in mid-term momentum. A break above the current local range around 44,802.50 will confirm the new direction upwards with the target being the next key level of 44,914.32 and a reconvened placement of a stop-loss beyond the range.
❤️Sending you lots of Love and Hugs❤️
SILVER: Strong Growth Ahead! Long!
My dear friends,
Today we will analyse SILVER together☺️
The in-trend continuation seems likely as the current long-term trend appears to be strong, and price is holding above a key level of 38.099 So a bullish continuation seems plausible, targeting the next high. We should enter on confirmation, and place a stop-loss beyond the recent swing level.
❤️Sending you lots of Love and Hugs❤️

EURUSD: Will Go Down! Short!
My dear friends,
Today we will analyse EURUSD together☺️
The market is at an inflection zone and price has now reached an area around 1.15996 where previous reversals or breakouts have occurred.And a price reaction that we are seeing on multiple timeframes here could signal the next move down so we can enter on confirmation, and target the next key level of 1.15562..Stop-loss is recommended beyond the inflection zone.
❤️Sending you lots of Love and Hugs❤️

Bitcoin & Altcoins: Technical Analysis and Market OutlookBitcoin (BTC) Analysis
Bitcoin is currently forming a short-term bullish pennant within a larger long-term pattern, projecting a potential target around $135K.
Key Levels: BTC is consolidating between the lower zone at $117.3K and the upper zone at $119.7K.
Breakout Potential: A break above this pattern could propel BTC toward a new all-time high (ATH), surpassing the current ATH at $123K.
Macro Events This Week:
Wednesday: The Federal Reserve will announce its interest rate decision, with no changes expected.
Wednesday: ADP Employment Report, providing insights into potential future rate cuts.
Friday: Non-Farm Payrolls (NFP) data release, which could further influence market sentiment.
Ethereum (ETH) Breakout
Ethereum has decisively broken through its 4-year historical resistance around $3,725, closing the week above this level. This breakout signals a strong bullish outlook for ETH, with potential for further upside.
Altcoin Highlights
BNB: Has shattered its previous all-time highs, showcasing significant bullish momentum.
XRP: Reached approximately $3.64, reflecting strong gains and market interest.
Market Context
The crypto market is showing robust activity, with altcoins following Bitcoin and Ethereum's lead. Key macroeconomic events this week could introduce volatility, so traders should stay vigilant.
Disclaimer: This is not financial advice. Every trader is responsible for their own strategy and risk management.
Happy trading and good profits! 🚀

GOLD: The Market Is Looking Down! Short!
My dear friends,
Today we will analyse GOLD together☺️
The price is near a wide key level
and the pair is approaching a significant decision level of 3,313.85 Therefore, a strong bearish reaction here could determine the next move down.We will watch for a confirmation candle, and then target the next key level of 3,298.60..Recommend Stop-loss is beyond the current level.
❤️Sending you lots of Love and Hugs❤️
Ethereum Eyes $8K After Bullish BreakoutEthereum (ETH) is setting up for a powerful move. After hitting a multi-month high last week, ETH pulled back into a higher-low formation—strengthening the newly established bullish trend.
Money flow is shifting: with recent crypto legislation, Ethereum is now benefiting even more than Bitcoin, marking a notable change in market dynamics.
📈 Technical Highlights:
✅ Short-term target: $4,800–$5,000 (new all-time highs)
✅ Long-term potential: $7,000–$8,000
🛡️ Key support: $2,800–$3,000 (bullish as long as this holds)
📣 Takeaway:
Ethereum’s trend is firmly bullish. As long as support holds, pullbacks could offer strong entry opportunities for both swing traders and long-term investors.
#Ethereum #ETHUSD #Crypto #Trading #TechnicalAnalysis #CryptoTrading #EthereumPrice #Altcoins #Bullish #Breakout

Potentially, A Safer Way To Long The EURUSDIn contrast to my previous outlook, the current price action suggests an increased probability of a deeper bearish move—potentially invalidating the buy zone marked out in the previous analysis. This sudden change is largely driven by the prospect of untapped liquidity residing beneath that zone, reinforcing the well-known market principle that price seeks out liquidity before committing to directional moves.
Given this development, the newly identified zone on the chart emerges as a more technically sound and reliable area from which to anticipate bullish interest. It aligns better with the broader liquidity profile and offers a stronger base for accumulation. Traders may opt to wait for confirmations within this zone or, depending on their risk appetite, consider executing buy positions upon price entry.
As always, patience and clarity are key as we allow price to reveal its intention.
Fingers crossed 🤞
Wishing you all a focused and profitable trading week.
Catch you on the next one. 🫡

EURJPY Sellers In Panic! BUY!
My dear friends,
Please, find my technical outlook for EURJPY below:
The price is coiling around a solid key level - 172.51
Bias - Bullish
Technical Indicators: Pivot Points Low anticipates a potential price reversal.
Super trend shows a clear buy, giving a perfect indicators' convergence.
Goal - 173.00
Safe Stop Loss - 172.29
About Used Indicators:
The pivot point itself is simply the average of the high, low and closing prices from the previous trading day.
Disclosure: I am part of Trade Nation's Influencer program and receive a monthly fee for using their TradingView charts in my analysis.
———————————
WISH YOU ALL LUCK

Bulls and Bears zone for 07-28-2025Last week 4 out of 5 sessions S&P 500 made new ATH. However they were all trading within a tight range.
Level to watch: 6434---6436

Next Move On EURUSD: A Bullish ContinuationWith this 4H bearish impulsive move, it’s easy to assume a reversal is underway to break the previous daily swing low. However, this appears more like a liquidity grab—fueling the next leg to the upside.
Price has retraced into a key zone that previously performed a strong liquidation. With significant liquidity already swept and clean inducements now resting above, this level becomes crucial.
This zone is the last stand: a break downward may target the daily swing low, while a hold and reaction could propel price toward the swing high.
Fingers crossed 🤞 as we watch price play out.
Have a great trading week, traders.
Catch you in the next one. 🫡

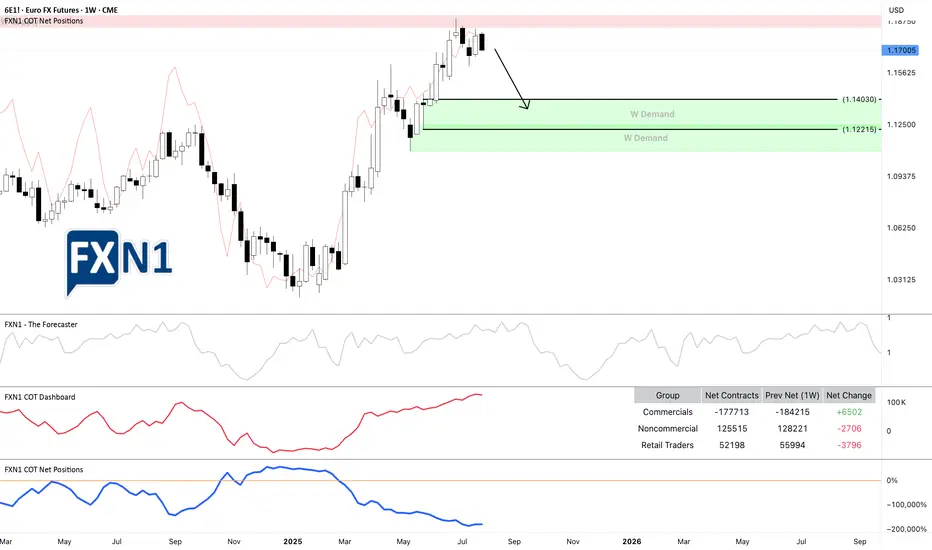
6E1!: Rebound at Weekly Supply Sparks Potential ReversalThe EURUSD (6E1! futures) experienced a rebound from a weekly supply zone * and now appears to be approaching a potential reversal toward a demand area. The overall picture is clear: we already capitalized on the rebound off the previous weekly supply zone, and at this point, we're simply observing the price as it approaches another key area of interest. It may be too late to initiate new short positions at this stage, but traders still holding shorts could potentially benefit from a continued move downward.
From a fundamental perspective, our Friday analysis of the DXY ** indicated the possibility of a bullish impulse, and today the US Dollar opened the session with a 0.58% gain. Currently, both commercial and non-commercial traders are aligned with the prevailing scenario. The most optimistic outlook suggests the price could decline to around 1.14030 over the coming weeks.
*
Previous analysis on EURUSD 6E1!
**
DXY Analysis
✅ Please share your thoughts about 6E1! in the comments section below and HIT LIKE if you appreciate my analysis. Don't forget to FOLLOW ME; you will help us a lot with this small contribution.
GBPAUD Is Going Up! Long!
Here is our detailed technical review for GBPAUD.
Time Frame: 6h
Current Trend: Bullish
Sentiment: Oversold (based on 7-period RSI)
Forecast: Bullish
The market is on a crucial zone of demand 2.055.
The oversold market condition in a combination with key structure gives us a relatively strong bullish signal with goal 2.070 level.
P.S
Please, note that an oversold/overbought condition can last for a long time, and therefore being oversold/overbought doesn't mean a price rally will come soon, or at all.
Disclosure: I am part of Trade Nation's Influencer program and receive a monthly fee for using their TradingView charts in my analysis.
Like and subscribe and comment my ideas if you enjoy them!

EURUSD Massive Long! BUY!
My dear friends,
EURUSD looks like it will make a good move, and here are the details:
The market is trading on 1.1665 pivot level.
Bias - Bullish
Technical Indicators: Supper Trend generates a clear long signal while Pivot Point HL is currently determining the overall Bullish trend of the market.
Goal - 1.1728
About Used Indicators:
Pivot points are a great way to identify areas of support and resistance, but they work best when combined with other kinds of technical analysis
Disclosure: I am part of Trade Nation's Influencer program and receive a monthly fee for using their TradingView charts in my analysis.
———————————
WISH YOU ALL LUCK

GBPUSD Will Go Lower! Short!
Take a look at our analysis for GBPUSD.
Time Frame: 2h
Current Trend: Bearish
Sentiment: Overbought (based on 7-period RSI)
Forecast: Bearish
The price is testing a key resistance 1.358.
Taking into consideration the current market trend & overbought RSI, chances will be high to see a bearish movement to the downside at least to 1.353 level.
P.S
The term oversold refers to a condition where an asset has traded lower in price and has the potential for a price bounce.
Overbought refers to market scenarios where the instrument is traded considerably higher than its fair value. Overvaluation is caused by market sentiments when there is positive news.
Disclosure: I am part of Trade Nation's Influencer program and receive a monthly fee for using their TradingView charts in my analysis.
Like and subscribe and comment my ideas if you enjoy them!

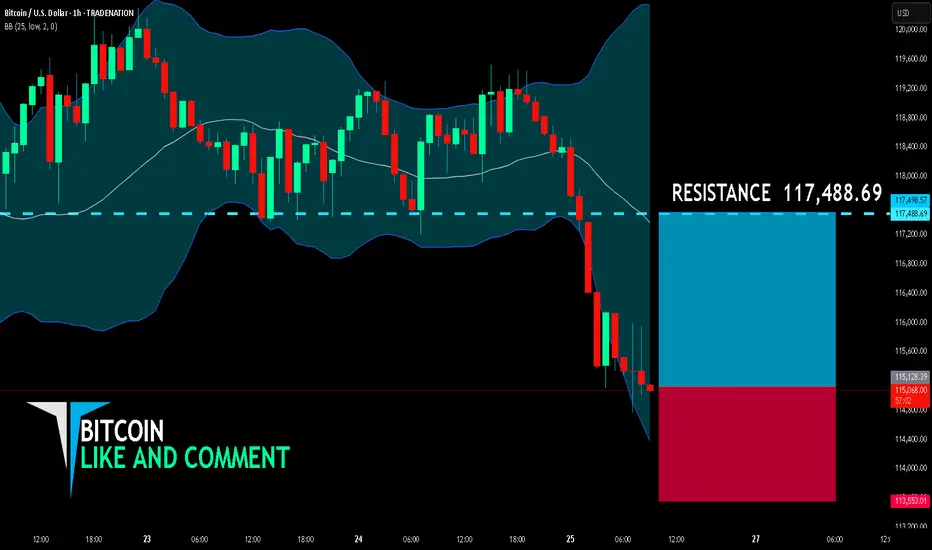
BITCOIN BULLS ARE GAINING STRENGTH|LONG
BITCOIN SIGNAL
Trade Direction: long
Entry Level: 115,128.39
Target Level: 117,488.69
Stop Loss: 113,553.01
RISK PROFILE
Risk level: medium
Suggested risk: 1%
Timeframe: 1h
Disclosure: I am part of Trade Nation's Influencer program and receive a monthly fee for using their TradingView charts in my analysis.
✅LIKE AND COMMENT MY IDEAS✅
GOLD SENDS CLEAR BEARISH SIGNALS|SHORT
GOLD SIGNAL
Trade Direction: short
Entry Level: 3,336.48
Target Level: 3,254.95
Stop Loss: 3,390.83
RISK PROFILE
Risk level: medium
Suggested risk: 1%
Timeframe: 1D
Disclosure: I am part of Trade Nation's Influencer program and receive a monthly fee for using their TradingView charts in my analysis.
✅LIKE AND COMMENT MY IDEAS✅

NZD/CAD BULLS ARE GAINING STRENGTH|LONG
NZD/CAD SIGNAL
Trade Direction: long
Entry Level: 0.820
Target Level: 0.824
Stop Loss: 0.817
RISK PROFILE
Risk level: medium
Suggested risk: 1%
Timeframe: 2h
Disclosure: I am part of Trade Nation's Influencer program and receive a monthly fee for using their TradingView charts in my analysis.
✅LIKE AND COMMENT MY IDEAS✅

AUD/CAD SELLERS WILL DOMINATE THE MARKET|SHORT
Hello, Friends!
We are now examining the AUD/CAD pair and we can see that the pair is going up locally while also being in a uptrend on the 1W TF. But there is also a powerful signal from the BB upper band being nearby, indicating that the pair is overbought so we can go short from the resistance line above and a target at 0.885 level.
Disclosure: I am part of Trade Nation's Influencer program and receive a monthly fee for using their TradingView charts in my analysis.
✅LIKE AND COMMENT MY IDEAS✅
