GBPCHF Trading Opportunity! SELL!
My dear friends,
GBPCHF looks like it will make a good move, and here are the details:
The market is trading on 1.0605 pivot level.
Bias - Bearish
Technical Indicators: Supper Trend generates a clear short signal while Pivot Point HL is currently determining the overall Bearish trend of the market.
Goal - 1.0571
About Used Indicators:
Pivot points are a great way to identify areas of support and resistance, but they work best when combined with other kinds of technical analysis
Disclosure: I am part of Trade Nation's Influencer program and receive a monthly fee for using their TradingView charts in my analysis.
———————————
WISH YOU ALL LUCK
Trading

EURUSD Will Explode! BUY!
My dear friends,
Please, find my technical outlook for EURUSD below:
The instrument tests an important psychological level 1.1515
Bias - Bullish
Technical Indicators: Supper Trend gives a precise Bullish signal, while Pivot Point HL predicts price changes and potential reversals in the market.
Target - 1.1538
Recommended Stop Loss - 1.1503
About Used Indicators:
Super-trend indicator is more useful in trending markets where there are clear uptrends and downtrends in price.
Disclosure: I am part of Trade Nation's Influencer program and receive a monthly fee for using their TradingView charts in my analysis.
———————————
WISH YOU ALL LUCK

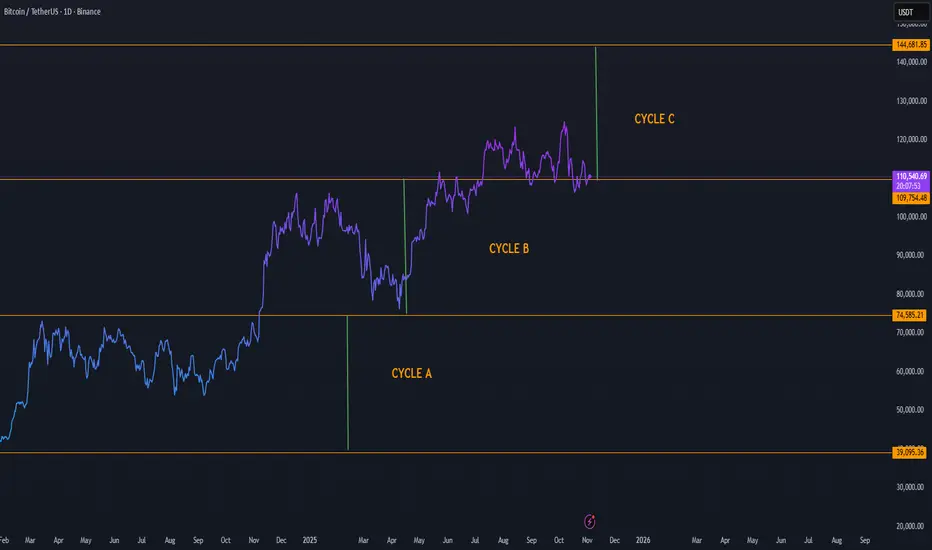
Bitcoin Cycle Analysis Entering Cycle C with Target Toward $144KBitcoin’s long-term market structure continues to evolve in well-defined phases, as visible through Cycle A, Cycle B, and the current Cycle C formation. Each previous cycle has followed a similar pattern: accumulation, expansion, correction, and new leg upward — and Cycle C appears to be following this same rhythm.
Here’s what the structure shows:
Cycle A: Represented the deep accumulation zone and base formation, bottoming near $39K–$75K.
Cycle B: Brought a strong recovery and expansion phase, establishing a stable mid-level support around $110K.
Cycle C (Current): Price is consolidating around the $110K area, likely preparing for the next expansion wave.
If Bitcoin maintains this cyclical rhythm, the next major target lies near $144K, aligning with the top boundary of Cycle C. This zone represents the next major resistance level and potential completion point of the current macro cycle.
Key observations:
Holding above $109K keeps Cycle C active and healthy.
Increasing volume during the next upward move could confirm a breakout continuation.
A successful push beyond $120K would strengthen momentum toward the $144K region.
LiamTrading - $XAUUSD$: Second Scenario – BUY Priority After...LiamTrading - OANDA:XAUUSD $: Second Scenario – BUY Priority After BREAKING $4002$
With Support from the U.S. Treasury Secretary
Hello traders community, LiamTrading is back with a detailed analysis of OANDA:XAUUSD $ for the start of the week!
The Gold market is receiving strong support from policy: U.S. Treasury Secretary Scott Bessent calls on the Fed to continue cutting interest rates as PCE inflation is currently at $2.7\%$.
This call, aimed at reducing mortgage rates and supporting the housing market, strengthens the long-term outlook for Gold.
Technical Analysis: We prioritize continuing to buy in line with the main trend. The best strategy is to enter at strong resistance/support zones to ensure the lowest risk.1.
📰 MACRO FUNDAMENTALS: CALL FOR RATE CUT
Impact: The Treasury Secretary's statement on cutting interest rates to support the "transitioning" economy increases expectations for policy easing, which is a strong support factor for Gold (though not yet an official decision).
Suitable Strategy: Market sentiment is being driven by expectations of policy easing, reinforcing the priority for a BUY (Long) position.
📊 TECHNICAL ANALYSIS: IMPORTANT PIVOT POINT
Resistance Zone $4002$: This area acts as an important pivot point.
Buy Entry will be activated after the price breaks $4002$ and retests.
Sell Entry: Look for short-term scalping at the resistance zone $4030$ to secure profits. Highlighted Zone: Prioritize entries at confirmed Trendline zones.
🎯 DETAILED TRADING PLAN (ACTION PLAN)
We will wait for Gold to break structure and create a BUY setup.
🟢 Main BUY Scenario (BUY Break & Retest)
Logic: Buy at $4002$ after breaking resistance and retesting, leveraging new upward momentum.
Entry (BUY): $4002$
SL: $3995$ (tight SL)
TP1/TP2: $4020$ | $4035$
TP3: $4070$
🔴 SCALPING SELL Scenario (SELL Scalping)
Logic: Short-term scalping at the strong resistance zone $4030$ (near Sell Liquidity zone).
Entry (SELL): $4030$
SL: $4038$
TP1/TP2: $4015$ | $4004$
TP3: $3990$4.
📌 SUMMARY & DISCIPLINE (Liam's Note)
Our BUY strategy is reinforced by policy outlook and technical breakout at $4002$. Strictly adhere to SL $3995$ to manage risk before the upward structure is confirmed.
Are you ready for Gold's movement at $4002$? Please LIKE and COMMENT!

Bitcoin Bullish Breakout Toward 112,000 TargetBitcoin (BTC/USD) is showing bullish momentum, trading above the trend line support. The price is targeting the 112,000 level, with potential resistance zones ahead. A sustained move above 110,000 could confirm further upside continuation.

LiamTrading - $XAUUSD$: NEW WEEK TRADING SCENARIO...LiamTrading - OANDA:XAUUSD $: NEW WEEK TRADING SCENARIO – PRIORITIZE SELLING After BREAKING THE TRENDLINE
Hello traders community,
The new week opens with a clear strategy: Prioritize SELLING after Gold has broken the previous upward trendline.
Although fundamental economic news (such as interest rate policies and politics) supports Gold potentially reaching $5,000$ USD, we must trade according to
current Price Action. Technical selling pressure is strong. We will SELL at key resistance areas and continue SELLING when the price breaks the downward structure.
📰 FUNDAMENTALS & LONG-TERM OUTLOOK
Prospect of $5,000$: Fundamental and political factors still support the scenario of Gold reaching $5,000$ USD in the long term (due to geopolitical risks and the potential loss of Fed's independence).
Short Term 🔴: Gold is under technical selling pressure after breaking through the $4,000$ USD mark.
📊 TECHNICAL ANALYSIS: BREAKING THE TRENDLINE
Structure: Gold has exited the upward price channel and is retesting the broken trendline.
Priority: SELL at the retest resistance area of $4024$.
🎯 DETAILED TRADING PLAN (ACTION PLAN)
🔴 SELL Scenario (SELL Primary) - Preemptive Resistance
Entry 1: $4024$ (Sell retest trendline area)
SL: $4032$
TP1/TP2: $4012$ | $4000$
TP3: $3989$
Entry 2 (Continued SELL): When the price breaks the next trendline at $3992$
SL: $4000$
TP: $3940$
🟢 BUY Scenario (BUY Reversal) - Buy at Strong Support
Logic: Only buy when the price hits a strong liquidity support area, potential for short-term recovery.
Entry (BUY): Around $3960$ (Buy Scalping area)
SL: $3954$
TP1/TP2: $3972$ | $3988 FWB:TP3 : $4000$
📌 SUMMARY & DISCIPLINE (Liam's Note) Don't let the $5,000$ USD prospect affect short-term risk management. Trade according to Price Action. Adhere to SL and prioritize SELL positions at resistance areas.
Are you ready for the SELL strategy at the start of this week?

$SPY $SPX Scenarios — Week of Nov 3 → Nov 7, 2025🔮 AMEX:SPY SP:SPX Scenarios — Week of Nov 3 → Nov 7, 2025 🔮
🌍 Market-Moving Headlines
🚩 Post-FOMC digestion: After Powell’s Oct 29 presser, traders watch whether yields and the dollar cool or extend higher.
📈 Labor-week spotlight: Friday’s Jobs Report (NFP, wages, unemployment) anchors the week — rate-path odds hinge on those prints.
💬 Fed tone in focus: Multiple governors and regional presidents hit the circuit after the FOMC — every nuance matters for December guidance.
⚠️ Shutdown watch: Several BEA and Census releases (Factory Orders, Trade Balance, GDP components) may not print on time if the government remains partially shuttered.
💻 Earnings taper off: Final big-cap names and sector leaders wrap Q3 results, shaping sentiment into mid-November.
📊 Key Data and Events (ET)
Mon Nov 3
⏰ ⚠️ 8:30 AM — Durable Goods Orders (Sept) | Ex-transportation subset — BEA report; possible delay
⏰ 10:00 AM — Factory Orders (Sept) ⚠️ possible delay
Tue Nov 4
⏰ 9:00 AM — S&P Case-Shiller Home Price Index (Aug)
⏰ 10:00 AM — Consumer Confidence (Oct) 🚩
Wed Nov 5
⏰ ⚠️ 8:30 AM — Advanced Trade Balance in Goods (Sept) | Retail and Wholesale Inventories — Census; may be delayed
⏰ 10:00 AM — Pending Home Sales (Sept)
⏰ 🚩 2:00 PM — FOMC Rate Decision
⏰ 🚩 2:30 PM — Fed Chair Powell Press Conference
Thu Nov 6
⏰ 🚩 8:30 AM — Initial Jobless Claims (Oct 25) expected on schedule
⏰ 🚩 8:30 AM — GDP (Q3, Advance) ⚠️ BEA data; delay possible
⏰ 9:55 AM — Fed Vice Chair Michelle Bowman speaks
Fri Nov 7
⏰ 🚩 8:30 AM — PCE and Core PCE (Sept) along with Personal Income, Spending, and Employment Cost Index ⚠️ BEA risk
⏰ 9:45 AM — Chicago PMI (Oct)
⏰ 12:00 PM — Cleveland Fed President Hammack and Atlanta Fed President Bostic remarks
⚠️ Note:
Shutdown risk applies to BEA and Census releases marked with ⚠️
Confirmed live data include Jobless Claims, FOMC decisions, and Fed speeches — these will drive most of the week’s price action.
Friday’s PCE print (if released) remains the key inflation gauge.
⚠️ Disclaimer: Educational and informational only — not financial advice.
📌 #trading #stockmarket #SPY #SPX #Fed #Powell #FOMC #PCE #GDP #JoblessClaims #inflation #bonds #yields #economy #macro

USDJPY FREE SIGNAL|SHORT|
✅USDJPY Price formed a double-top near the premium zone, showing exhaustion and signs of distribution. Expect a bearish reaction toward the demand level where liquidity rests.
—————————
Entry: 154.000
Stop Loss: 154.420
Take Profit: 153.320
Time Frame: 2H
—————————
SHORT🔥
✅Like and subscribe to never miss a new idea!✅

AUD-CAD Free Signal! Buy!
Hello,Traders!
AUDCAD is reacting from a horizontal demand area, showing signs of accumulation before a potential bullish move. Liquidity below recent lows has been swept, favoring buyers.
-------------------
Stop Loss: 0.9145
Take Profit: 0.9195
Entry Level: 0.9169
Time Frame: 5H
-------------------
Buy!
Comment and subscribe to help us grow!
Check out other forecasts below too!
Disclosure: I am part of Trade Nation's Influencer program and receive a monthly fee for using their TradingView charts in my analysis.

DXY WILL KEEP GROWING|LONG|
✅DXY After a clean breakout above the key level, the index is showing strength and structure shift in favor of buyers. A potential retest of the zone may trigger continuation toward the target area. Time Frame 4H.
LONG🚀
✅Like and subscribe to never miss a new idea!✅

Ceat Tyre - Go LongManufacturing Facilities
Company has 6 manufacturing facilities and 3 smart facilities in Nashik, Mumbai, Halol, Ambernath, Nagpur & Chennai which possess a capacity of producing a total of 3.5 crore tyres p.a.
Capacity Expansion
CEAT has planned a capex of 400 Crs to expand its production capacity at the Nagpur plant by 30%. This initiative is expected to be completed by FY 2027-28.
Acquisition
The company has agreed to acquire the CAMSO brand’s off-highway construction equipment bias tyre and tracks business from Michelin for approximately US$225 million, with cash outflows starting from Q1FY26. The acquisition will be funded through a 30:70 mix of internal accruals and debt, including progressive payments to Michelin.

Marathon - Go LongNifty Real Estate Index is coming out of the woods along with that smart stock are also coming out and will be good for investment and swing trades. One of them is Marathon
Real estate portfolio
The company's portfolio includes commercial, luxury residential, townships, affordable housing and retail.
Commercial Highlights H1FY24
Area sold : 2,62,896 Sq. ft.
Booking Value (Registered) : Rs. 384 crs.
Collections : Rs. 301 crs.
Realization Per Sq.ft. : Rs. 18,580(Commercial)
Rs. 12,666(Residential)
Landbank
Marathon Group has extensive land banks across the MMR region. It has 100+ acres across Panvel, Thane, Bhandup each and 50+ acres in Dombivli.

Kolte Patil - Real EstateNew Launches
The company has launches planned across all 3 cities of presence –Pune, Mumbai & Bengaluru with a saleable area of ~17 msf and aggregate topline potential of over ~Rs. 12,000 crore
Strategic Partnerships
The company has partnered with Planet Smart City to jointly develop ~0.65mn sq. ft. at Kiwale, Pune. It has received Rs. 206.5 crore in Arpil’23 from Marubeni Corporation, (Japan) against the entitlement of 2.85 lakh sq. ft. of saleable area as part of the agreement in the Pimple Nilakh residential project.
Project Funding and Partners
The company has been associated with marquee financial institutions like ICICI Ventures, JP Morgan, KKR, ASK Capital, Motilal Oswal, Portman Holdings, and Planet Smart City across projects.
Target
For FY24, the company is targeting new business development with a topline potential of ~Rs.8,000 crore across geographies through outright/structured deals and JVs/JDAs.

Sakar - Go LongTechnically this stock has given a good breakout with an healthy volume however there had been strong selling at 369 level. if it surpasses then we can see also ATH.

EUR/JPY Technical Analysis: Bullish Continuation Pattern FormsTitle: EUR/JPY Bullish Heist 🚀🏦 - The "Layer Cake" Long Play
Alright, Money Makers! 👋 The EUR/JPY vault is looking ripe for a bullish break-in. Our technical blueprint suggests the momentum is building for a potential escape rally. Here's the profit playbook.
📊 The Master Plan (Technical Setup):
Bias: Bullish ✅
Trend: Price is showing strength after a pullback to a key accumulation zone.
Confirmation: We're looking for a successful retest near the Triangular Moving Average (TMA), signaling the next leg up is loading.
Catalyst: A phase of re-accumulation is building energy for the next move north. 🚀
🎯 The Entry Strategy ("The Thief's Layer Cake")
This isn't a one-and-done entry. We're using a layered limit order approach to scale in like a pro and improve our average entry.
Consider Buy Limit Layers at:
Layer 1: 176.500
Layer 2: 176.000
Layer 3: 175.500
Layer 4: 175.000
Feel free to adjust the number of layers and levels based on your own risk appetite and market structure analysis.
🛡️ The Escape Route (Risk Management)
Stop Loss (The Getaway Car): A logical Thief's SL can be placed below the key support structure, for example, around 174.500. 🚗💨
⚠️ Thief's Note on SL/TP: Dear Ladies & Gentlemen, I am not recommending you use only my suggested SL/TP. It's your capital. Manage your risk and take profits at your own discretion. You make money, you take money. The responsibility is yours!
🎯 The Profit Target (Cracking the Safe)
Target: We are aiming for the 178.500 zone.
Rationale: This area represents a strong resistance level where overbought conditions and potential bull traps may lurk. The plan is to escape with our profits before the alarm sounds! 🚨
Related Pairs to Watch & Key Correlations:
FX:EURUSD & FX:USDJPY : The EUR/JPY is essentially a derived pair from these two. A strong Euro (EUR/USD ↑) and/or a weak Yen (USD/JPY ↑) typically fuels a bullish EUR/JPY move. Watch the DXY (U.S. Dollar Index) for clues.
OANDA:GBPJPY & OANDA:AUDJPY : Other "JPY-cross" pairs. They often move in correlation due to shared sensitivity to risk sentiment and the Japanese Yen's safe-haven status. If these are rallying, it confirms a broader weak-Yen environment.
✨ “If you find value in my analysis, a 👍 and 🚀 boost is much appreciated — it helps me share more setups with the community!”
#Disclaimer: This "Thief Style" strategy is presented for educational and entertainment purposes only. It is not financial advice. Trading Forex carries a high level of risk and may not be suitable for all investors. Always do your own research and trade responsibly.
#Forex #EURJPY #TradingSetup #SwingTrading #TechnicalAnalysis #Bullish #TradingStrategy

Is the USD/CAD Re-Accumulation Zone the Next Bullish Launchpad?💰 USD/CAD “THE LOONIE” — Forex Market Profit Playbook (Swing/Day Trade)
📊 Plan:
BULLISH Bias confirmed by Re-Accumulation Zone (Smart Money activity detected!)
The “Thief Strategy” hunts liquidity smartly — using layered limit buys at key levels to capture institutional footprints without chasing candles.
🎯 Entry Plan (Layering Strategy Style)
The Thief strategy uses multiple buy limit layers — a smart method to scale into a position without full exposure at once.
Buy Limit Layers:
1️⃣ 1.39800
2️⃣ 1.39900
3️⃣ 1.40000
4️⃣ 1.40200
💡 You can adjust or increase the limit layers based on your own trade risk and capital exposure.
🛡️ Stop Loss (SL):
📍 Suggested protective stop: 1.39600
Not financial advice — each trader’s risk tolerance may vary. Manage risk wisely like a pro!
💵 Target (Take Profit Zone):
🎯 1.41300 — The “Police Barricade” (major resistance area).
This zone may act as a strong barrier due to overbought conditions and potential liquidity traps. Take your profits smartly and escape before the cops arrive! 🚓💨
⚠️ Notes to Thief OGs:
Dear Ladies & Gentlemen (Thief OGs) — this isn’t a signal, it’s a playbook idea. You’re free to adjust entries, SLs, and TPs based on your own analysis and money management plan.
Trade smart. Take profits wisely. Risk what you can afford to lose. 🧠💼
🔍 Related Pairs to Watch:
TVC:DXY (US Dollar Index) → USD strength driver, watch for momentum continuation.
BLACKBULL:WTI (Crude Oil) → Strong inverse correlation with CAD; rising oil often boosts CAD (bearish USD/CAD).
FX:USDCNH → USD sentiment barometer — positive correlation with USD/CAD.
OANDA:AUDCAD / OANDA:NZDCAD → Cross-check for CAD sentiment confirmation across commodity pairs.
🧭 Key Catalysts & Correlations:
USD fundamentals: Fed stance, CPI, and bond yields continue to influence direction.
CAD sentiment: Oil price movement and BoC tone will shape the medium-term bias.
Risk sentiment: Strong equity rally = weaker USD; risk-off tone = stronger USD.
✨ “If you find value in my analysis, a 👍 and 🚀 boost is much appreciated — it helps me share more setups with the community!”
📜 Disclaimer: This is a Thief-style trading strategy shared for educational and entertainment purposes only — not financial advice. Trade responsibly and with discipline.
#USDCAD #Forex #SwingTrade #DayTrade #SmartMoney #Reaccumulation #PriceAction #LiquidityHunt #TradingStrategy #MarketPlaybook #FXAnalysis #DollarIndex #ThiefStrategy #TradingViewIdeas #BullishSetup #ForexCommunity

NZDCAD WILL GO UP|LONG|
✅NZDCAD after tapping into a key demand zone, price shows early displacement to the upside. Liquidity below previous lows has been collected, hinting at bullish intent toward the next target area. Time Frame 4H.
LONG🚀
✅Like and subscribe to never miss a new idea!✅

USD-JPY Free Signal! Sell!
Hello,Traders!
USDJPY a double-top structure has formed near a key supply zone, indicating potential exhaustion of bullish momentum. Smart money may look to reverse liquidity buildup at this level toward lower targets.
-------------------
Stop Loss: 154.459
Take Profit: 153.560
Entry Level: 154.102
Time Frame: 2H
-------------------
Sell!
Comment and subscribe to help us grow!
Check out other forecasts below too!
Disclosure: I am part of Trade Nation's Influencer program and receive a monthly fee for using their TradingView charts in my analysis.

EURUSD Will Go Down From Resistance! Short!
Here is our detailed technical review for EURUSD.
Time Frame: 9h
Current Trend: Bearish
Sentiment: Overbought (based on 7-period RSI)
Forecast: Bearish
The market is on a crucial zone of supply 1.153.
The above-mentioned technicals clearly indicate the dominance of sellers on the market. I recommend shorting the instrument, aiming at 1.143 level.
P.S
Overbought describes a period of time where there has been a significant and consistent upward move in price over a period of time without much pullback.
Like and subscribe and comment my ideas if you enjoy them!

NZDUSD Will Go Higher! Buy!
Take a look at our analysis for NZDUSD.
Time Frame: 1h
Current Trend: Bullish
Sentiment: Oversold (based on 7-period RSI)
Forecast: Bullish
The price is testing a key support 0.572.
Current market trend & oversold RSI makes me think that buyers will push the price. I will anticipate a bullish movement at least to 0.575 level.
P.S
Please, note that an oversold/overbought condition can last for a long time, and therefore being oversold/overbought doesn't mean a price rally will come soon, or at all.
Like and subscribe and comment my ideas if you enjoy them!

BTCUSD The Target Is UP! BUY!
My dear subscribers,
This is my opinion on the BTCUSD next move:
The instrument tests an important psychological level 10983
Bias -Bullish
Technical Indicators: Supper Trend gives a precise Bullish signal, while Pivot Point HL predicts price changes and potential reversals in the market.
Target - 11133
About Used Indicators:
On the subsequent day, trading above the pivot point is thought to indicate ongoing bullish sentiment, while trading below the pivot point indicates bearish sentiment.
Disclosure: I am part of Trade Nation's Influencer program and receive a monthly fee for using their TradingView charts in my analysis.
———————————
WISH YOU ALL LUCK

GBPCAD What Next? SELL!
My dear subscribers,
My technical analysis for GBPCAD is below:
The price is coiling around a solid key level - 1.8425
Bias - Bearish
Technical Indicators: Pivot Points High anticipates a potential price reversal.
Super trend shows a clear sell, giving a perfect indicators' convergence.
Goal - 1.8406
My Stop Loss - 1.8436
About Used Indicators:
By the very nature of the supertrend indicator, it offers firm support and resistance levels for traders to enter and exit trades. Additionally, it also provides signals for setting stop losses
Disclosure: I am part of Trade Nation's Influencer program and receive a monthly fee for using their TradingView charts in my analysis.
———————————
WISH YOU ALL LUCK

SPY BEARS ARE STRONG HERE|SHORT
SPY SIGNAL
Trade Direction: short
Entry Level: 681.87
Target Level: 650.12
Stop Loss: 702.99
RISK PROFILE
Risk level: medium
Suggested risk: 1%
Timeframe: 9h
Disclosure: I am part of Trade Nation's Influencer program and receive a monthly fee for using their TradingView charts in my analysis.
✅LIKE AND COMMENT MY IDEAS✅
