AUD/USD BEARS ARE GAINING STRENGTH|SHORT
Hello, Friends!
We are now examining the AUD/USD pair and we can see that the pair is going up locally while also being in a uptrend on the 1W TF. But there is also a powerful signal from the BB upper band being nearby, indicating that the pair is overbought so we can go short from the resistance line above and a target at 0.649 level.
Disclosure: I am part of Trade Nation's Influencer program and receive a monthly fee for using their TradingView charts in my analysis.
✅LIKE AND COMMENT MY IDEAS✅
Trading

SILVER Will Move Higher! Long!
Please, check our technical outlook for SILVER.
Time Frame: 1D
Current Trend: Bullish
Sentiment: Oversold (based on 7-period RSI)
Forecast: Bullish
The market is trading around a solid horizontal structure 5,642.3.
The above observations make me that the market will inevitably achieve 6,175.7 level.
P.S
Overbought describes a period of time where there has been a significant and consistent upward move in price over a period of time without much pullback.
Like and subscribe and comment my ideas if you enjoy them!

AUDUSD Is Bullish! Buy!
Here is our detailed technical review for AUDUSD.
Time Frame: 9h
Current Trend: Bullish
Sentiment: Oversold (based on 7-period RSI)
Forecast: Bullish
The market is testing a major horizontal structure 0.654.
Taking into consideration the structure & trend analysis, I believe that the market will reach 0.658 level soon.
P.S
Please, note that an oversold/overbought condition can last for a long time, and therefore being oversold/overbought doesn't mean a price rally will come soon, or at all.
Like and subscribe and comment my ideas if you enjoy them!

Why We Loaded $MSTR at $169 (5:1 Risk/Reward to $355)Have you ever watched a stock pull back 65% and wondered if it was opportunity or disaster?
Have you ever missed a major setup because fear told you to stay away?
This analysis breaks down why NASDAQ:MSTR at $169 presented a textbook geometric retracement opportunity with exceptional risk/reward asymmetry.
Hello ✌️
Spend 3 minutes ⏰ reading this educational breakdown of structure-based position entry.
🎯 Analytical Insight on MSTR
MicroStrategy pulled back from $543 to $169 a 65% retracement that brought price directly into a major accumulation zone. This wasn't random. It aligned perfectly with:
Fibonacci retracement from 2020 lows to 2024 highs
A long-term ascending trendline dating back to 2020
The monthly $112 support zone that held as a floor
Our position entry: $169
Our invalidation level: $131.80 (below structure)
Our first target: $360 (previous resistance zone)
Risk: $37.20 per share
Reward: $191 per share
Ratio: 5.13:1
This setup didn't require predicting the future. It required identifying where risk was defined and reward was probable based on historical price structure.
📚 Educational Section: Why Geometric Retracements Work
The Psychology of Pullbacks
When price drops 65%, most traders experience:
Fear that it will continue falling forever
Doubt about whether the trend is still valid
Paralysis from watching others panic sell
Professional traders see the same chart differently:
Defined risk at structural support
Historical patterns of mean reversion
Favorable asymmetry when risk is small relative to potential reward
The majority fears what professionals buy.
📉 Understanding Market Structure
Markets don't move in straight lines. They:
Trend in one direction (impulse)
Retrace to gather liquidity (correction)
Resume the primary direction (continuation)
The 0.618 to 0.786 retracement zone historically shows the highest probability of reversal in trending assets. Why?
Early sellers have exhausted
Value buyers recognize the discount
Risk can be defined tightly below support
At $169, MSTR offered:
Clear invalidation below $131.80
Multiple timeframe confluence
Structural support from prior consolidation
🎯 Why This Entry Made Sense
Risk Was Defined
Below $169, the next logical support was $131.80. If price broke below that level, the bullish structure would be invalidated. This gave us a clear exit point before entering.
Reward Was Probable
The previous resistance zone at $360 represented a 113% gain from entry. Even a conservative 50% retracement would target $220+, still offering excellent reward.
Structure Aligned
Monthly support held
Trendline from 2020 intact
Retracement zone tested multiple times
Volume showed exhaustion, not acceleration
📊 Tools Used for This Analysis
Fibonacci Retracement
Identified the 0.786 level as a deep pullback zone where buyers historically step in.
Trendline Analysis
The ascending line from 2020 provided dynamic support that price respected.
Volume Profile
Showed accumulation at lower levels with decreasing selling pressure.
Horizontal Support Zones
The $105-110 monthly level acted as a psychological floor, preventing further collapse.
Risk/Reward Calculator
Entry: $169
Stop: $131.80
Target: $360
Result: 5.13:1 asymmetry
🛡️ Risk Management Framework
Stop Loss Below Structure
Our stop at $131.80 was placed below the invalidation point. If price reached that level, our thesis would be wrong and we'd exit with controlled loss of $37.20 per share.
Position Sizing Based on Risk
With $37.20 risk per share, position size was calculated to risk only 1-2% of total capital. This meant even if wrong, the account remained intact.
Target Based on Structure, Not Hope
$360 wasn't arbitrary. It represented previous resistance where sellers had historically appeared. We planned to reduce exposure at that level.
🧠 Trader Psychology: Why Most Miss These Setups
Fear of Catching a Falling Knife
After a 65% drop, the brain assumes it will continue. But without defined support, there's no knife just falling into the void. At $169, support was visible and the stop at $131.80 was clear.
Recency Bias
The most recent price action (the drop) feels like it will continue forever. Historical structure suggests otherwise, but emotions overpower data.
Herd Mentality
When everyone is bearish, contrarian positions feel uncomfortable. But the best risk/reward setups rarely have crowd consensus.
Waiting for Confirmation
Many traders wait for price to "prove" itself by moving higher first. By then, risk has expanded and reward has diminished. Entry at $169 with $37.20 risk is superior to entry at $250 with $118.20 risk to the same stop level.
📌 Proper Entry Execution
We didn't enter the entire position at once:
First third at $169 (initial position)
Second third at $155 if support retested (average down if structure held)
Final third reserved if $140 tested (closer to stop but maximum opportunity)
This scaling approach:
Reduced emotional pressure
Improved average entry if structure tested
Maintained discipline through volatility
🏆 What Professionals Do Differently
They Don't Chase Momentum
Entry at $543 (the top) felt safe because price was rising. Entry at $169 felt dangerous because price was falling. Professionals understand that perceived safety is often maximum risk.
They Define Risk First
Before asking "how much can I make," they ask "how much can I lose." The $131.80 level answered that question clearly.
They Accept Being Wrong
If MSTR broke $131.80, the position would be exited without hesitation. No hoping, no averaging down into a broken structure. Wrong is wrong.
They Journal Every Decision
Entry logic, risk parameters, and target zones were documented before entry. This removes emotion from exit decisions later.
🎯 Key Takeaways
✅ Risk/reward asymmetry matters more than being right: A 5:1 setup allows you to be wrong multiple times and still profit overall if position sizing is consistent.
✅ Structure defines opportunity: Random entries have random outcomes. Entries at defined support with clear invalidation have statistical edges.
✅ Emotions are the enemy: When $169 felt scary, that was the signal. When $543 felt safe, that was the warning.
✅ Patience beats prediction: We didn't predict $169 was the bottom. We identified it as a zone where risk was small ($37.20) and reward was large ($191). That's enough.
⚠️ Important Disclaimers
This analysis is educational and reflects a specific position entry based on technical structure. It is not financial advice or a recommendation to buy or sell MSTR or any security.
Position entries, stop losses, and targets are shared for educational purposes to demonstrate risk management principles. Your risk tolerance, timeframe, and capital allocation should differ based on your individual circumstances.
Past price structure does not guarantee future performance. MSTR could have broken $131.80 and invalidated this setup entirely, resulting in a controlled loss. Not all setups work, which is why risk management exists.
Always conduct your own analysis, consider your risk tolerance, and consult with a financial professional before making investment decisions. All trading and investing involves risk of loss.
✨ Support This Content
If this breakdown helped you understand structure-based entries and risk management, leave a comment with your thoughts or questions. Your engagement helps us create more educational content like this.
📜 Do your own research. Manage your risk. Trade with discipline.

QNT Update🚨📊 QNT Update
QNT has broken out above the red resistance zone 🔴🔥.
If the bullish momentum continues,
price could move up toward the $109 target —
the next major level on the chart.
Strong breakout, now watching for continuation.

ULTIMA Update🚨📊 ULTIMA Update
ULTIMA, after having a strong uptrend,
has now formed a new resistance zone in red 🔴.
This level is acting as a strong ceiling,
and price must break out above this red resistance
to continue its bullish momentum.
Until that breakout happens,
upside stays limited and sellers may hold control at this zone.

BBAI BigBear ai Holdings Options Ahead of EarningsIf you haven`t bought BBAI before the massive rally:
Now analyzing the options chain and the chart patterns of BBAI BigBear ai Holdings prior to the earnings report this week,
I would consider purchasing the 3usd strike price Calls with
an expiration date of 2025-12-19,
for a premium of approximately $1.35.
If these options prove to be profitable prior to the earnings release, I would sell at least half of them.

QURE uniQure Options Ahead of EarningsAnalyzing the options chain and the chart patterns of QURE uniQure prior to the earnings report this week,
I would consider purchasing the 15usd strike price Calls with
an expiration date of 2026-1-16,
for a premium of approximately $2.32.
If these options prove to be profitable prior to the earnings release, I would sell at least half of them.

Bullish Thesis for INTC Intel Stock in 2025If you haven`t bought INTC before the previous earnings:
Now Intel INTC is positioned for a potential turnaround and upside by the end of 2025, driven by strategic leadership changes, foundry business expansion, AI innovation, and favorable geopolitical dynamics. Here’s why INTC could head higher this year:
1. Leadership Transformation and Strategic Vision
The appointment of Lip-Bu Tan as CEO in March 2025 has injected new optimism into Intel’s prospects. Tan is a respected semiconductor industry veteran, and his arrival was met with a 10% jump in INTC’s share price, reflecting renewed investor confidence in the company’s direction.
2. Foundry Business Expansion and Government Support
Intel’s pivot toward a foundry-centric model is gaining momentum. The company is leveraging its U.S.-based manufacturing footprint to attract domestic and international clients, especially as geopolitical tensions and trade restrictions make U.S. chip production more attractive.
There is speculation about strategic partnerships, such as TSMC potentially acquiring a stake in Intel’s foundry operations, which could accelerate technology transfers and client wins.
The U.S. government is likely to continue supporting domestic semiconductor manufacturing through incentives and tariffs, directly benefiting Intel’s foundry ambitions.
3. AI and Next-Gen Product Launches
Intel is aggressively targeting the AI and data center markets. The upcoming Jaguar Shores and Panther Lake CPUs, built on the advanced 18A process node, are set for release in the second half of 2025. These chips will be available not only for Intel’s own products but also for external clients like Amazon and Microsoft, expanding the addressable market.
Intel’s renewed focus on AI accelerators and competitive cost structures could help it regain share in high-growth segments.
4. Financial Resilience and Market Position
Despite recent setbacks, Intel remains a dominant player in the PC CPU market and continues to generate substantial revenue, outpacing some key competitors in the latest quarter.
Analysts have revised their short-term price targets upward, with some projecting INTC could reach as high as $62—a potential upside of over 170% from current levels.
Forecasts for 2025 suggest an average price target in the $40–$45 range, with bullish scenarios pointing even higher if execution on foundry and AI strategies meets expectations.
5. Technical and Sentiment Factors
While technical analysis currently signals caution, the $18.50–$20 zone has provided strong support, and any positive news on foundry contracts or AI wins could catalyze a breakout from current consolidation patterns.
Market sentiment has shifted more positively following the CEO change and strategic announcements, suggesting the potential for a sustained rebound if Intel delivers on its promises.
In conclusion:
Intel’s combination of visionary leadership, foundry expansion, AI innovation, and favorable geopolitical trends sets the stage for a potential stock price recovery by the end of 2025. With analyst targets and investor sentiment turning more bullish, INTC presents a compelling case for upside as it executes its turnaround strategy
Disclosure: I am part of Trade Nation's Influencer program and receive a monthly fee for using their TradingView charts in my analysis.

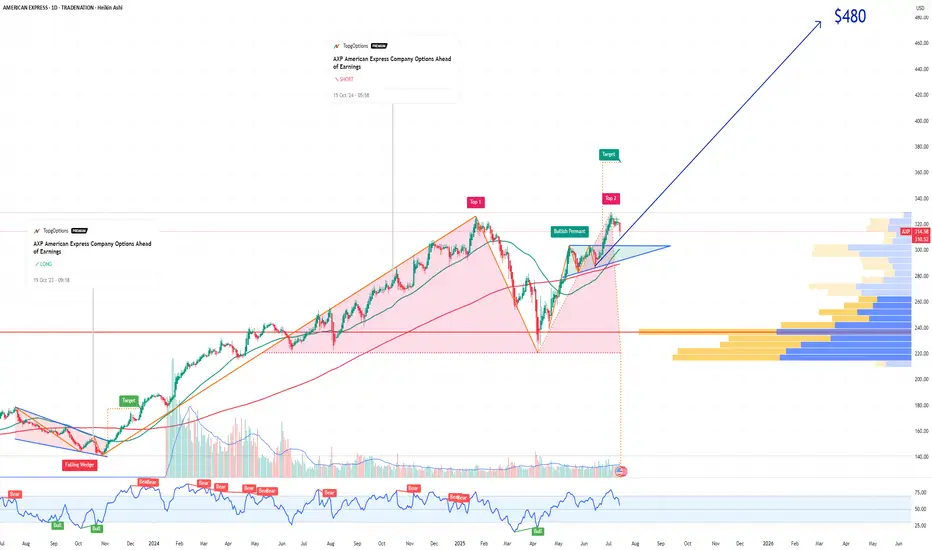
AXP American Express Company Options Ahead of EarningsIf you haven`t bought AXP before the rally:
Now analyzing the options chain and the chart patterns of AXP American Express Company prior to the earnings report this week,
I would consider purchasing the 480usd strike price Calls with
an expiration date of 2027-1-15,
for a premium of approximately $6.25.
If these options prove to be profitable prior to the earnings release, I would sell at least half of them.
Disclosure: I am part of Trade Nation's Influencer program and receive a monthly fee for using their TradingView charts in my analysis.
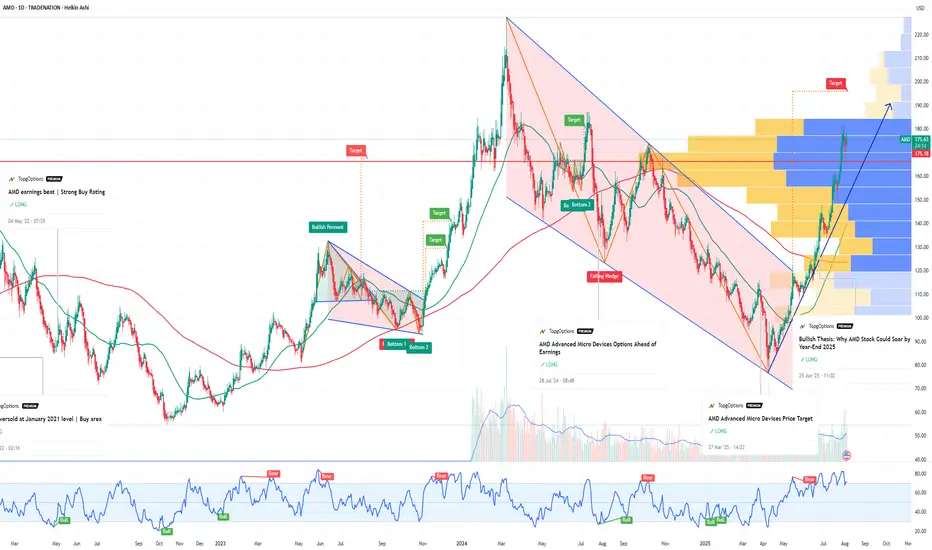
AMD Advanced Micro Devices Options Ahead of EarningsIf you haven`t bought AMD before the previous earnings:
Now analyzing the options chain and the chart patterns of AMD Advanced Micro Devices prior to the earnings report this week,
I would consider purchasing the 220usd strike price Calls with
an expiration date of 2026-9-18,
for a premium of approximately $22.15.
If these options prove to be profitable prior to the earnings release, I would sell at least half of them.
Disclosure: I am part of Trade Nation's Influencer program and receive a monthly fee for using their TradingView charts in my analysis.
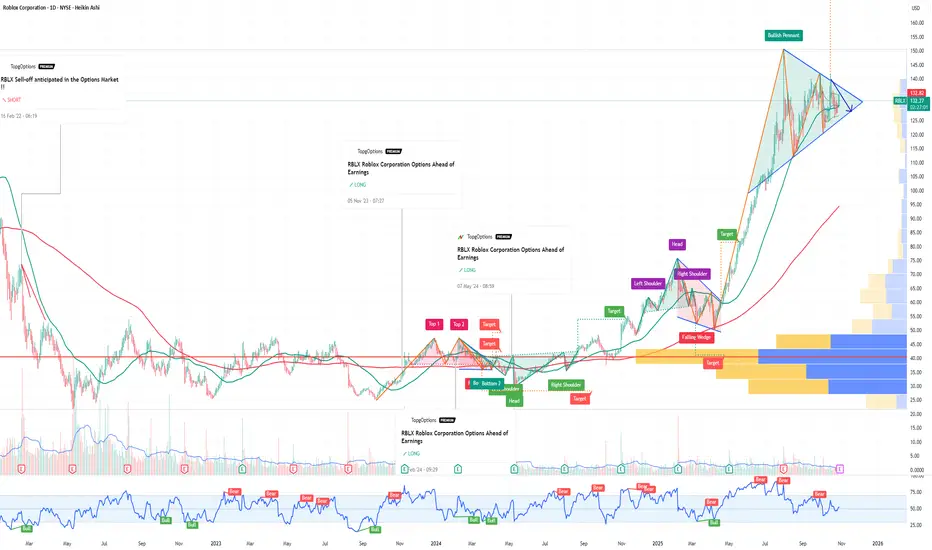
RBLX Roblox Corporation Options Ahead of EarningsIf you haven`t bought RBLX before the rally:
Now analyzing the options chain and the chart patterns of RBLX Roblox Corporation prior to the earnings report this week,
I would consider purchasing the 130usd strike price Puts with
an expiration date of 2026-1-16,
for a premium of approximately $13.80.
If these options prove to be profitable prior to the earnings release, I would sell at least half of them.
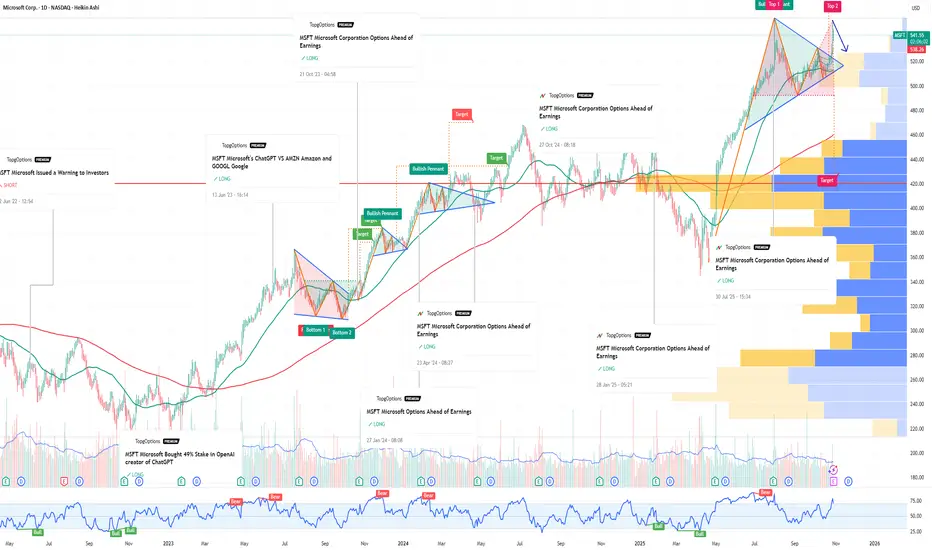
MSFT Microsoft Corporation Options Ahead of EarningsIf you haven`t bought MSFT before the rally:
Now analyzing the options chain and the chart patterns of MSFT Microsoft Corporation prior to the earnings report this week,
I would consider purchasing the 550usd strike price Puts with
an expiration date of 2025-12-19,
for a premium of approximately $26.70.
If these options prove to be profitable prior to the earnings release, I would sell at least half of them.
ONDS Ondas Holdings Options Ahead of EarningsAnalyzing the options chain and the chart patterns of ONDS Ondas Holdings prior to the earnings report this week,
I would consider purchasing the 10usd strike price Calls with
an expiration date of 2028-1-21,
for a premium of approximately $3.95.
If these options prove to be profitable prior to the earnings release, I would sell at least half of them.

Bitcoin - $250K Target by 2030 is Feasible - Why I'm Still LongSince I established this account on Tradingview in 2017, I have consistently shared positive sentiment regarding Bitcoin. Also, I have been monitoring crypto and blockchain technology since 2011. My optimism about Bitcoin's potential has been longstanding, particularly with the arrival of RSK, Bitcoin subnets, Ivy, the Lightning Network, and Bitcoin Oracles. Furthermore, Bitcoin has gained significant acceptance among institutional investors, as evidenced by the increasing prevalence of Bitcoin ETFs, Index Funds, and BTC being included in more retirement portfolios or mutual funds. Although I have maintained a bullish stance and invested in crypto for an extended period, the technology still faces considerable challenges in terms of scalability and achieving mass adoption. Additionally, I have previously suggested a new Proof of Work (PoW) mechanism for BTC mining; however, HashCash appears to be the preferred choice among Bitcoin Maximalists and the BTC Dev Team. A price of $250K by 2030 is a realistic possibility. As always, none of this is investment or financial advice. Please do your own due diligence and research.

AUDJPY FREE SIGNAL|SHORT|
✅AUDJPY price swept the upper supply wick and tapped into a premium zone, triggering a clean bearish displacement. A corrective pullback into the breaker block is expected before continuation lower.
———————————
Entry: 102.29
Stop Loss: 102.49
Take Profit: 102.01
Time Frame: 2H
———————————
SHORT🔥
✅Like and subscribe to never miss a new idea!✅

GBP-NZD Free Signal! Sell!
Hello, Traders!
GBPNZD has executed a clean bearish breakout beneath the horizontal supply area, shifting order-flow decisively to the downside. The recent liquidity sweep above the structure acted as distribution, and price is now delivering into discount levels with bearish momentum.
--------------------
Stop Loss: 2.3145
Take Profit: 2.3026
Entry: 2.3097
Time Frame: 2H
--------------------
Sell!
Comment and subscribe to help us grow!
Check out other forecasts below too!
Disclosure: I am part of Trade Nation's Influencer program and receive a monthly fee for using their TradingView charts in my analysis.

PUMP Update🚨📊 PUMP Update
PUMP has also formed a new resistance zone in red 🔴.
This level is now acting as a strong ceiling,
and price must break out above this red resistance
to show any real bullish momentum again.
Until that breakout happens,
sellers remain in control and upside stays limited.

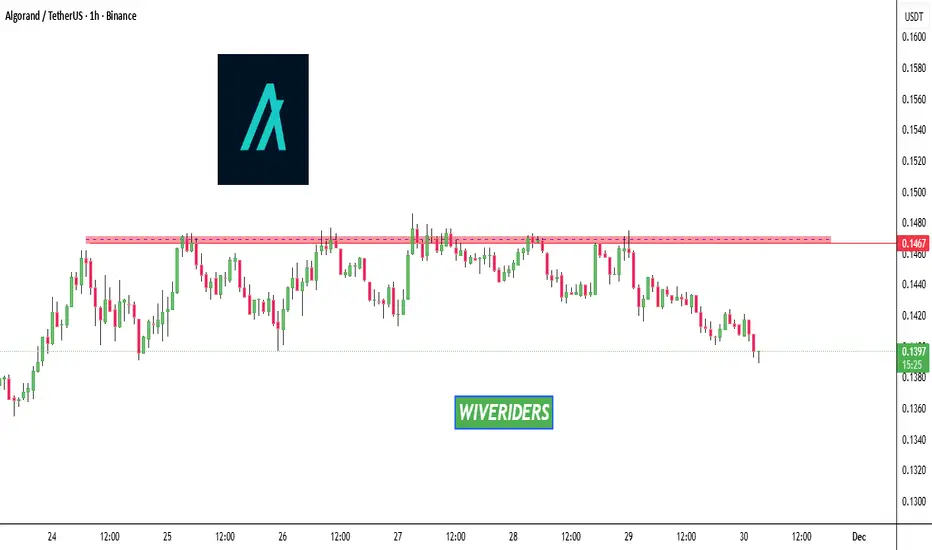
ALGO Update🚨📊 ALGO Update
ALGO has also formed a new resistance zone in red 🔴.
This level is now acting as a strong ceiling,
and price must break out above this red resistance
to show any real bullish momentum again.
Until that breakout happens,
sellers remain in control and upside stays limited.
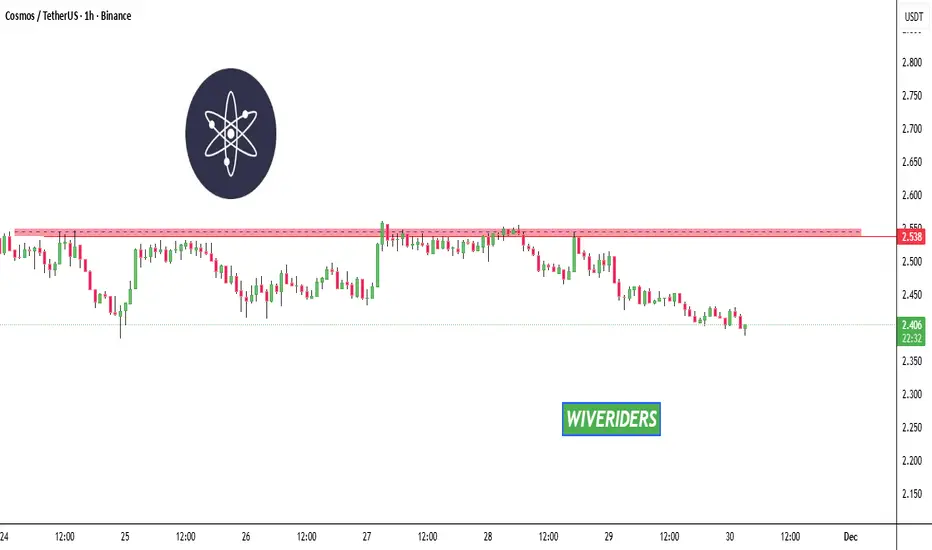
ATOM Update🚨📊 ATOM Update
ATOM has also formed a new resistance zone in red 🔴.
This level is now acting as a strong ceiling,
and price must break out above this red resistance
to show any real bullish momentum again.
Until that breakout happens,
sellers remain in control and upside stays limited.
EUR-JPY Bearish Bias! Sell!
Hello,Traders!
EURJPY is reacting inside a major H2 supply block after sweeping short-term liquidity, signalling distribution and a probable displacement lower toward inefficiencies below. Time Frame 2H.
Sell!
Comment and subscribe to help us grow!
Check out other forecasts below too!
Disclosure: I am part of Trade Nation's Influencer program and receive a monthly fee for using their TradingView charts in my analysis.

EURNZD BEARISH BREAKOUT|SHORT|
✅EURNZD has broken down from the supply level and is now trading in a discount leg, with liquidity resting below recent equal lows. As long as order flow stays bearish, the draw remains toward the target zone. Time Frame 7H.
SHORT🔥
✅Like and subscribe to never miss a new idea!✅

FET 🚨📊 FET Update
FET has also formed a new resistance zone in red 🔴.
This level is now acting as a strong ceiling,
and price must break out above this red resistance
to show any real bullish momentum again.
Until that breakout happens,
sellers remain in control and upside stays limited.
