ETH - MONTHLY DOJI - UPDATE:#ETH - price analysis: Tricky times Ahdea? 📊
Global Structure (Long-Term View):
🔸The chart remains bullish above the $ 3,180 level (monthly view). 📈
🔸That said, prices are stuck under a potential double-top ATH resistance at 4,800– 4,950. ⚠️
🔸Monthly High: $ 4,755
🔸Monthly Low: $ 3,435
🔸Current price is showing a Doji candle on both monthly and weekly charts, sitting exactly in the middle range from low to high. Neutral vibes for now! 🤔
Daily View:
Price is holding above the previous key resistance zone of 3,700 - 3,750.
Upper Key Resistances to Watch:
$ 4,300 - $ 4,540 - $ 4,75 - $ 4,950
What to Expect (Medium-Term Outlook):
We're in a sideways phase within the yellow zone: 4,250– 3,700, until a real breakout happens.
If bulls keep consolidating above $ 3,180, an upward move seems likely.
Tricky moment-there's literally no clear long-term or medium-term direction right now.
I've highlighted key levels and possible setups in my charts below. #DYOR
In case of a bad market event and bearish breakout, 2,850 and 2,500 could act as key bottoms.
My Take: This feels like a consolidation trap, bulls or bears, who's winning?
Share your thoughts below!
Bullish rebound or more downside? 👇
Key levels, yellow zone, and Doji highlights in my charts.
Trading

EDU - price analasysNYSE:EDU - price analysis:
Ascending accumulation, or HTF sideway move?
H1 = uptrend 📈 but the current daily view remain very neutral.
Key resistances:
0.1685 - 0.1880$
Bulls need to break above 0.1685$ with large buy volume to confirm further price increase. ⚠️
Lower key demand zone:
0.1280 - 0.1160

BTCUSD: Waiting for a range breakBITSTAMP:BTCUSD is currently trading within a tight accumulation range between 112,004 and 113,524.
Today’s plan:
Wait for price to consolidate near the upper boundary of the range while the EMA compresses close to price action. Once a clear range break (RB) to the upside occurs, enter a market buy.
If the price breaks early without enough consolidation, wait for a pullback to retest the breakout level and look for a buy setup after the range break (ARB).
Profit targets and stop loss levels should be chosen according to individual risk management preferences.
Daniel Miller @ ZuperView

AIA - BULLISH ACCUMULATION ? WHOLE BOTTOM? NASDAQ:AIA look pretty good here for me.
Looks like a whole bottom & bullish accumulation forming before to see the big leg up I'm waiting for!
2$+ next?? 🚀 🎯

AUD-USD Short From Supply Area! Sell!
Hello,Traders!
AUDUSD has rebounded into a horizontal supply area, showing rejection at premium levels. Smart Money Concepts indicate potential redistribution before targeting 0.6510$.
-------------------
Stop Loss: 0.6532$
Take Profit: 0.6510$
Entry: 0.6517$
Time Frame: 3H
-------------------
Sell!
Comment and subscribe to help us grow!
Check out other forecasts below too!
Disclosure: I am part of Trade Nation's Influencer program and receive a monthly fee for using their TradingView charts in my analysis.

SEI - perfect play, TP4 GIT AGAINYesterday vs today; #SEI TP4 HIT
EPIC one again, congrats fam.
{Not a financial advice).

EURUSD FREE SIGNAL|SHORT|
✅EURUSD returned to a premium supply level after breaking structure, where ICT traders anticipate distribution. Liquidity above recent highs has been cleared, signaling potential downside.
—————————
Entry: 1.1636
Stop Loss: 1.1650
Take Profit: 1.1619
Time Frame: 2H
—————————
SHORT🔥
✅Like and subscribe to never miss a new idea!✅

Gold price analysis October 15GOLD UPDATE – The trend is still with the buyers
Gold prices continue to maintain an impressive upward momentum and are currently trading around the historical peak (ATH). The upward momentum is still very strong, showing that the buyers are completely in control of the market.
In that context, every correction in today's session can be seen as a great opportunity to "catch the wave" following the main trend.
Trading strategy:
Priority: Only wait for BUY
BUY Trigger: When the price rejection signal appears at the support zone of 4180 and 4145
Target: 4230
As long as the price remains above this support zone, the "buy the dip" strategy is still the most reasonable choice.

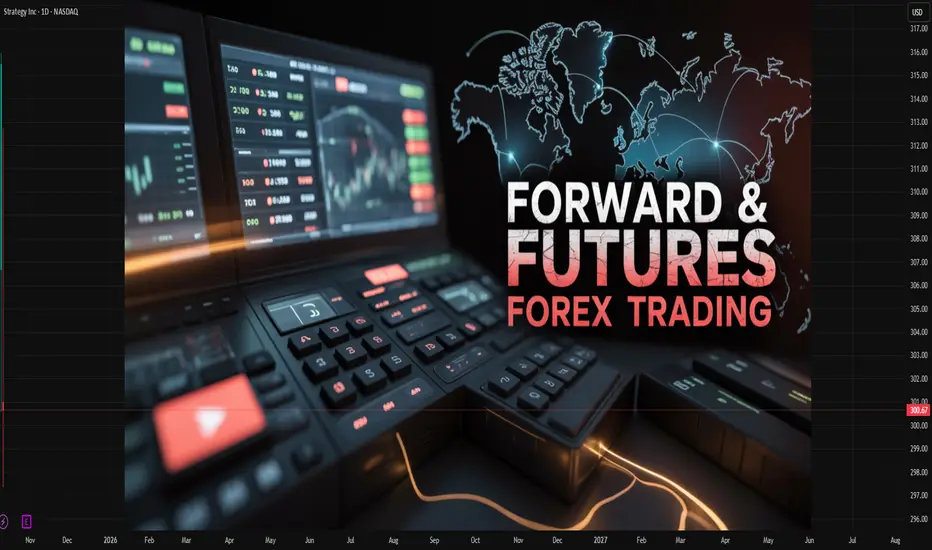
Difference Between Forward and Futures Forex Markets1. Definition and Basic Concept
Forward Market:
A forward forex contract is a private agreement between two parties to buy or sell a specific amount of a currency at a predetermined rate on a future date. It is a customizable contract where the terms—such as amount, delivery date, and exchange rate—are negotiated directly between the buyer and the seller.
Futures Market:
A futures forex contract, on the other hand, is a standardized agreement traded on an organized exchange (such as the Chicago Mercantile Exchange - CME) to buy or sell a currency at a set price on a specific future date. Futures contracts are governed by exchange rules and are not negotiable between individuals.
Example:
If an Indian importer knows they must pay $1 million in three months, they can lock in today’s rate with a forward contract negotiated with their bank. Alternatively, they could use a futures contract on the exchange to hedge the same exposure, but under standardized terms.
2. Trading Venue and Regulation
Forward Market:
The forward forex market is Over-the-Counter (OTC), meaning trades occur directly between parties—usually through banks, brokers, or large financial institutions. It is unregulated compared to futures markets, giving flexibility but also introducing counterparty risk.
Futures Market:
Futures contracts are traded on regulated exchanges, ensuring transparency, standardized contract sizes, and proper oversight by authorities such as the Commodity Futures Trading Commission (CFTC) in the U.S. This makes the futures market more secure and trustworthy for investors.
Key Difference:
OTC forward markets offer privacy and customization, whereas futures markets emphasize standardization, regulation, and transparency.
3. Contract Customization
Forward Market:
Forward contracts are fully customizable. Parties can decide the exact amount, currency pair, settlement date, and method of delivery. This flexibility suits businesses and institutions with specific hedging needs.
Futures Market:
Futures contracts are standardized in terms of contract size, maturity dates (e.g., March, June, September, December), and settlement procedures. Traders must accept these fixed terms, which can limit flexibility but make trading easier for speculative purposes.
Example:
A company wanting to hedge €2.5 million in three months can easily set that amount in a forward contract. In contrast, a futures contract might have a fixed lot size (say, €125,000 per contract), so the company would need to trade multiple contracts to approximate the desired amount.
4. Settlement and Delivery
Forward Market:
Settlement occurs on the agreed future date, and most forward contracts end in actual delivery of the currencies. However, some may be settled in cash based on the difference between the agreed rate and the spot rate at maturity.
Futures Market:
Most futures contracts are cash-settled before expiry, as traders often close their positions before the delivery date. Only a small percentage result in physical delivery of the currencies.
Key Point:
Forwards typically end with physical delivery, while futures are mainly used for speculation and hedging without actual currency exchange.
5. Counterparty Risk
Forward Market:
Since forwards are private agreements, there is a high counterparty risk—the possibility that one party may default on the contract. There is no intermediary guaranteeing the trade.
Futures Market:
Futures contracts eliminate counterparty risk because the exchange clearing house acts as the intermediary, guaranteeing that both sides meet their obligations. Traders must maintain margin accounts to manage default risk.
Result:
Futures offer greater security due to exchange-backed settlement mechanisms.
6. Mark-to-Market and Margin Requirements
Forward Market:
Forward contracts are not marked to market, meaning profits or losses are realized only at the contract’s maturity. No margin or daily settlement is required.
Futures Market:
Futures contracts are marked to market daily, meaning gains and losses are settled every trading day. Traders must maintain margin accounts (initial and maintenance margins) to cover potential losses, ensuring market integrity.
Example:
If the exchange rate moves unfavorably in a futures position, the trader must deposit additional funds to maintain their margin. In forwards, the loss or gain is realized only at the end.
7. Liquidity and Market Participants
Forward Market:
Liquidity in forwards depends on the specific currency pair and the parties involved. It’s dominated by banks, multinational corporations, and institutional investors seeking to hedge specific exposures.
Futures Market:
The futures market is highly liquid due to standardized contracts and participation from a wide range of players—hedgers, speculators, and institutional traders. Continuous trading ensures tight spreads and efficient pricing.
In summary:
Forwards serve mainly for hedging; futures attract both hedgers and speculators due to liquidity and transparency.
8. Purpose and Usage
Forward Market:
Primarily used for hedging long-term exposures. Forwards protect against adverse currency movements for future transactions like exports, imports, or loans in foreign currencies.
Futures Market:
Used for both hedging and speculation. Hedge funds and traders use futures to profit from short-term price movements in currency pairs or to manage portfolio risk efficiently.
Example:
A corporate treasurer uses forwards to hedge a future payment, while a speculator might use futures to bet on the dollar strengthening against the euro.
9. Pricing and Cost Structure
Forward Market:
Forward prices are determined by the interest rate differential between the two currencies and the current spot rate. There are no exchange fees, but the pricing may include a bank’s spread or commission.
Futures Market:
Futures prices are also influenced by interest rate differentials but may deviate slightly from forward rates due to daily margin settlements and market expectations. Traders also pay exchange and brokerage fees.
Key Insight:
Forward pricing is customized and negotiated privately, while futures pricing is transparent and visible on exchanges.
10. Transparency and Accessibility
Forward Market:
Forward markets are less transparent, as prices and deals are not publicly available. Only large players like banks and corporations typically participate due to the high transaction size.
Futures Market:
Futures markets are highly transparent. Prices, trading volumes, and open interest data are publicly available in real time, enabling fair competition and analysis for all traders.
Final Comparison:
Transparency in futures ensures fairness and easier access for retail and institutional investors, while forwards remain largely institutional and relationship-based.
Conclusion
While both forward and futures forex markets allow participants to hedge or speculate on future currency movements, their structure, purpose, and participants differ greatly.
Forwards offer customization and flexibility but come with higher counterparty risk and limited liquidity.
Futures provide standardization, security, and transparency, making them ideal for speculative trading and risk management in a regulated environment.
In summary:
Aspect Forward Market Futures Market
Trading Venue OTC (Private) Exchange-Traded
Customization Fully customizable Standardized
Regulation Unregulated Regulated
Settlement On maturity Daily (mark-to-market)
Counterparty Risk High Minimal
Participants Corporates, Banks Traders, Investors
Transparency Low High
Liquidity Moderate High
Margin Requirement None Required
Usage Long-term hedging Hedging & speculation
$SPY / $SPX Scenarios — Wednesday, Oct 15, 2025🔮 AMEX:SPY / SP:SPX Scenarios — Wednesday, Oct 15, 2025 🔮
🌍 Market-Moving Headlines
🚩 Growth pulse check: The Empire State Manufacturing Survey kicks off the day — a real-time test of factory sentiment post-summer slowdown.
📘 Fed Beige Book afternoon drop: Key read on regional activity and inflation anecdotes — markets often reposition after release.
💬 Fed parade continues: Bostic, Miran, and Waller keep rate-cut expectations in focus ahead of Thursday’s data risk.
⚠️ Shutdown overhang: Broader data (CPI/PPI/Retail) still paused — traders key off qualitative signals like Beige Book tone.
📊 Key Data & Events (ET)
⏰ 🚩 8:30 AM — Empire State Manufacturing Survey (Oct)
⏰ 12:10 PM — Raphael Bostic (Atlanta Fed) speech
⏰ 12:30 PM — Stephen Miran (Fed Gov) speech
⏰ 1:00 PM — Christopher Waller (Fed Gov) speech
⏰ 🚩 2:00 PM — Fed Beige Book
⚠️ Note: Shutdown continues to delay most federal data releases. Beige Book offers the only official economic snapshot this week — high read-through for inflation, wages, and business conditions.
⚠️ Disclaimer: Educational / informational only — not financial advice.
📌 #trading #stockmarket #SPY #SPX #Fed #BeigeBook #EmpireState #Waller #Bostic #Miran #bonds #yields #inflation #shutdown #economy
XAUUSD – Continues to set ATHXAUUSD – Continues to set ATH, prioritize buying according to POC 4,146–4,148 🟡
Gold continues to create higher highs after a strong rally in the Asian session; the upward channel structure remains intact. On H1, POC ~4,147–4,148 is the nearest support; above is the resistance cluster according to FE 1.618 ~4,186 and the sell zone 4,221–4,240.
Key levels
Support: 4,146–4,148 (POC) • 4,140 (short-term invalid).
Resistance/targets: 4,166 • 4,186 (FE 1.618) • 4,188–4,200 • 4,221 (sell scalping) • 4,240 (sell zone).
Trading scenario
Buy 1 – POC pullback
Entry 4,146–4,148 | SL 4,140 | TP 4,166 → 4,188 → 4,200 → 4,245.
If it pulls back to POC and H1 shows a confirmation candle/mid-trendline support, prioritize buying.
Buy 2 – Shallow retest
If the price only dips ~4,160–4,162 and then bounces back above POC, consider adding buys with SL 4,152, TP as above.
Sell reaction (higher risk)
Entry 4,240 | SL 4,250 | TP 4,222 → 4,200 → 4,188 → 4,160.
Only activate when there is a clear rejection signal at 4,221–4,240; this is a counter-trend trade.
Invalidation & management
Buying bias weakens when H1 closes below 4,140 or breaks the lower channel edge.
After TP1, move SL to entry; avoid chasing price in the 4,18x–4,20x area when volume is thin. 🎯
Quick context
The upward momentum is maintained thanks to expectations of the Fed ending QT/loose conditions soon and safe-haven flows; however, the 4,221–4,240 area may create short-term reactions before the uptrend extends.
Trade well with this scenario!

GBP-USD Free Signal! Sell!
Hello,Traders!
GBPUSD tapped into a horizontal supply area after grabbing buy-side liquidity, confirming bearish intent. Smart Money likely aims for imbalance fill toward 1.3302$ before any rebound.
-------------------
Stop Loss: 1.3335$
Take Profit: 1.3302$
Entry: 1.3322$
Time Frame: 3H
Setup Risk: High
-------------------
Sell!
Comment and subscribe to help us grow!
Check out other forecasts below too!
Disclosure: I am part of Trade Nation's Influencer program and receive a monthly fee for using their TradingView charts in my analysis.

BTC/USDT — Volume Confirmation Points Toward UptrendBitcoin has reclaimed strength within the low time frame zone, while also showing rising volume activity — a key technical signal that supports the early stage of a potential uptrend continuation.
BTC volume has been increasing since the last 7H step by step.
Currently, BTC is stabilizing between $111K and $113.6K, forming a supportive base within this range. The volume range just above acts as a confirmation layer — once price holds above this level with consistent demand, the uptrend momentum could accelerate.
📊 Technical Highlights:
Low Time Frame Support: $111K–$113.6K
Volume Zone: $116.6K area and important confirmation zone.
Main Resistance / Target: $118-120K
A sustained move above the volume zone ($116K) would be the main confirmation that BTC’s next leg toward $126K is underway.
📈 Bias: Bullish continuation forming
🎯 Key levels: $113.6K → $116K → up 118K

BITCOIN Risky Short! Sell!
Hello,Traders!
BITCOIN is reacting from a horizontal supply area after a strong impulsive move down. Smart Money may engineer a retracement before continuing to target 111,300$ liquidity. Time Frame 2H.
Sell!
Comment and subscribe to help us grow!
Check out other forecasts below too!
Disclosure: I am part of Trade Nation's Influencer program and receive a monthly fee for using their TradingView charts in my analysis.

EURJPY WILL GROW|LONG|
✅EURJPY retraced perfectly into the demand level after clearing liquidity below previous lows. Price shows bullish intent, with upside imbalance toward 177.00 likely to be filled. Time Frame 4H.
LONG🚀
✅Like and subscribe to never miss a new idea!✅

EURAUD BEARISH BIAS|SHORT|
✅EURAUD retraced into a clear supply level after a sharp displacement move. ICT traders anticipate distribution, targeting inefficiency around 1.7830 as price seeks sell-side liquidity. Time Frame 3H.
SHORT🔥
✅Like and subscribe to never miss a new idea!✅

USD-CHF Local Long! Buy!
Hello,Traders!
USDCHF is approaching a horizontal demand area, where Smart Money accumulation could trigger a bullish reversal. Expect price to tap into 0.8025$ liquidity before redistribution. Time Frame 2H.
Buy!
Comment and subscribe to help us grow!
Check out other forecasts below too!
Disclosure: I am part of Trade Nation's Influencer program and receive a monthly fee for using their TradingView charts in my analysis.

SGDCAD: Price Holds Above Daily HTLKey Observations
Daily Timeframe:
Price tested this daily HTL as resistance a few times. The last break was very strong.
After price reverted below this daily HTL, it did not make a new lower low. Instead, it traded above this level rather quickly.
Overall, this gives me an indication that selling pressure is weakening.
H1 Timeframe:
Price crossed below EMA20, but this was shortlived
As price exits the EMA band, this is an indication that momentum might pick up
Realistically, I might close this trade and re-open in order to bypass the the 5PM rollover spike in spreads

CADCHF FREE SIGNAL|LONG|
✅CADCHF traded into a refined demand level, showing bullish intent with strong rejection wicks. A move toward 0.5715 liquidity highs is expected as price rebalances inefficiency. Time Frame 2H.
—————————
Entry: 0.5704
Stop Loss: 0.5697
Take Profit: 0.5715
Time Frame: 2H
—————————
LONG🚀
✅Like and subscribe to never miss a new idea!✅

SILVER Will Keep Growing! Buy!
Hello,Traders!
SILVER shows Smart Money accumulation from the horizontal demand area, with bullish displacement suggesting price will tap into the 5,280$ liquidity pool next. Time Frame 1H.
Buy!
Comment and subscribe to help us grow!
Check out other forecasts below too!
Disclosure: I am part of Trade Nation's Influencer program and receive a monthly fee for using their TradingView charts in my analysis.

Reversal About to Happen for EUR/USD? Or is it a trap? - Oct 14So the EUR/USD has come up today, breaking almost a week long selling trend. the question for Today is... is the move for real? or is it a trap?
In this video, not only do we tackle this important question, but we also review what happened with yesterday´s selling trend and we dive into the potential setups we can expect over the coming day both for bulls and also for bears
Thanks so much

SEI - BULLISH SETUP NYSE:SEI - bullish setup 📈
I'm buying the dip on this support. #DYOR
Lower big levels:
0.2060 - 0.1980$ - 0.1800$
Bulls might stay in control above 0.2100$ (Megaphone pattern + 50% fib test).
Not a financial advice. Only Sharing the best trading ideas.

XAUUSD | m15 frame gold drops sharply by 50 points ? 🔍 Market Context
Gold prices have just set a historical peak (ATH GOLD) around the 4,180 USD region, following a steep upward trend over multiple sessions.
Immediately after, the market witnessed the first break of upward structure (BoS) – a sign indicating that bullish momentum is weakening .
Currently, prices are returning to fill the Fair Value Gap (FVG) at 4,125 – 4,145 USD , which is likely a liquidity rebalancing phase before prices choose the next direction.
💎 Technical Analysis
ATH GOLD: 4,180 – 4,185 USD
Fair Value Gap (FVG): 4,125 – 4,145 USD → an empty price area that needs to be filled.
Order Block Buy Zone 1: 4,050 – 4,060 USD → the nearest demand zone, potentially creating the first technical reaction.
Order Block Buy Zone 2: 3,980 – 3,985 USD → a deep demand zone with large liquidity confluence, likely to become the main "accumulation point."
Overall Structure: After breaking the upward channel, the market is in a retracement phase – the medium-term structure remains bullish .
📈 Trading Scenarios
1️⃣ Short-term Sell Scenario – filling FVG and technical adjustment
If prices continue to test the FVG 4,125 – 4,145 USD region without breaking through,
→ consider a short-term sell to catch the technical retracement phase.
Target: the first OB Buy Zone 4,050 USD .
Stop Loss: above 4,155 USD (to avoid being swept above the FVG peak).
➡️ This scenario is suitable for short-term traders following corrective waves – only enter when there is a clear reversal candle confirmation.
2️⃣ Trend-following Buy Scenario – catching the rebound from OB Zone
If prices adjust to the 4,050 – 4,060 USD region, observe reaction signals such as Bullish Engulfing or strong Rejection .
Upon confirmation, open a trend-following buy order .
Target: the 4,125 → 4,145 USD region or the old peak of 4,180 USD.
Stop Loss: below 4,030 USD.
If the first OB zone doesn't hold, the 3,980 – 3,985 USD area will be an ideal zone for long-term "accumulation."
⚠️ Risk Management
Avoid FOMO buying at high prices when the FVG is not yet filled.
Prioritize trading at clear reaction zones (OB, FVG edge).
Reduce volume when entering counter-trend orders to preserve capital.
💬 Conclusion
After a steep rise, gold is entering a value rebalancing phase .
The current market structure leans towards a short-term technical retracement before continuing the main upward trend.
If the 4,050 – 4,060 USD region reacts well, gold may soon rebound and aim for the 4,150 – 4,180 USD region.
👉 Reasonable Strategy:
Short-term sell when prices react at FVG.
Wait to buy at OB Buy Zone when there is a confirmed upward signal.
