EURUSD Will Move Lower! Sell!
Please, check our technical outlook for EURUSD.
Time Frame: 9h
Current Trend: Bearish
Sentiment: Overbought (based on 7-period RSI)
Forecast: Bearish
The market is approaching a significant resistance area 1.156.
Due to the fact that we see a positive bearish reaction from the underlined area, I strongly believe that sellers will manage to push the price all the way down to 1.140 level.
P.S
The term oversold refers to a condition where an asset has traded lower in price and has the potential for a price bounce.
Overbought refers to market scenarios where the instrument is traded considerably higher than its fair value. Overvaluation is caused by market sentiments when there is positive news.
Disclosure: I am part of Trade Nation's Influencer program and receive a monthly fee for using their TradingView charts in my analysis.
Like and subscribe and comment my ideas if you enjoy them!
Trading

AUDUSD Is Bullish! Long!
Here is our detailed technical review for AUDUSD.
Time Frame: 1h
Current Trend: Bullish
Sentiment: Oversold (based on 7-period RSI)
Forecast: Bullish
The market is on a crucial zone of demand 0.646.
The oversold market condition in a combination with key structure gives us a relatively strong bullish signal with goal 0.647 level.
P.S
We determine oversold/overbought condition with RSI indicator.
When it drops below 30 - the market is considered to be oversold.
When it bounces above 70 - the market is considered to be overbought.
Disclosure: I am part of Trade Nation's Influencer program and receive a monthly fee for using their TradingView charts in my analysis.
Like and subscribe and comment my ideas if you enjoy them!

USDCHF Is Very Bearish! Short!
Take a look at our analysis for USDCHF.
Time Frame: 1h
Current Trend: Bearish
Sentiment: Overbought (based on 7-period RSI)
Forecast: Bearish
The price is testing a key resistance 0.808.
Taking into consideration the current market trend & overbought RSI, chances will be high to see a bearish movement to the downside at least to 0.804 level.
P.S
Overbought describes a period of time where there has been a significant and consistent upward move in price over a period of time without much pullback.
Disclosure: I am part of Trade Nation's Influencer program and receive a monthly fee for using their TradingView charts in my analysis.
Like and subscribe and comment my ideas if you enjoy them!

gold price forecast today short term increase forecastmarket overview
Gold prices had a correction around 2325 yesterday, after recovering from a low of 2,290 USD. In the context of investors expecting the Fed to cut interest rates soon, gold is being strongly supported by the prospect of loose monetary policy and the weak USD.
Factors supporting gold prices
Weaker-than-expected US labor data
The non-farm payrolls report released on Friday showed the number of new jobs reaching only 142,000 - much lower than the expected level of 180,000. This increased expectations that the Fed will cut interest rates as early as September, strongly supporting gold prices

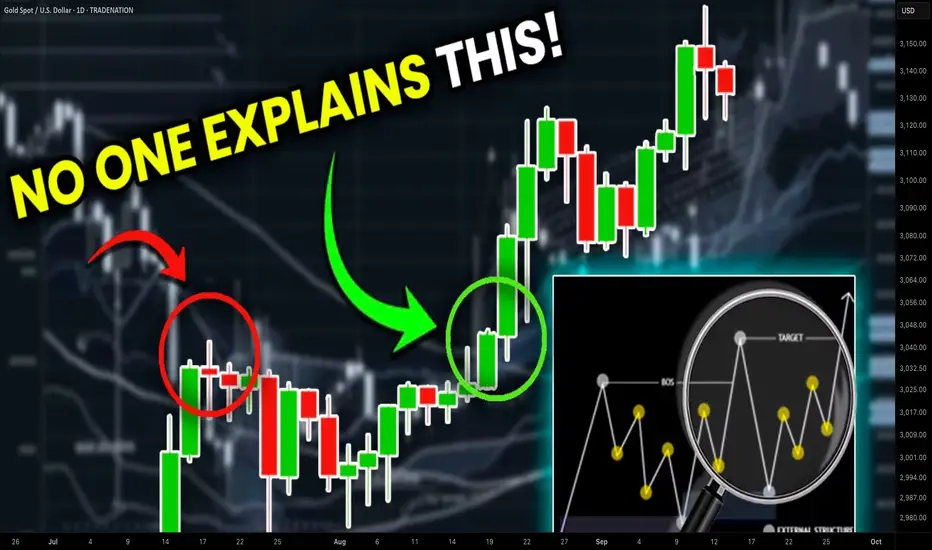
Accurate Price Model for Trading Smart Money Concepts SMC (=
If you trade Smart Money Concepts SMC, there is one single pattern that you should learn to identify.
In this article, you will learn an accurate price model that you can use to predict a strong bullish or bearish movement way before it happens.
Read carefully and discover how to track the silent actions of smart money on any market.
The only thing that you need to learn to easily find this pattern is basic Structure Mapping . After you map significant highs and lows, you will quickly recognize it.
This SMC pattern has 2 models: bullish and bearish ones.
Let's start with a bearish setup first.
Examine a structure of this pattern
it should be based on 2 important elements.
The price should set a sequence of equal lows.
These equal lows will compose a demand zone.
The area where a buying interest will concentrate.
The minimum number of equal lows and lowers highs should be 2 to make a model valid.
Exhausting of bullish moves will signify a loss of confidence in a demand zone . Less and less market participants will open buy positions from that.
At some moment, a demand zone will stop holding. Its bearish breakout will provide a strong bearish signal , and a bearish continuation will most likely follow.
This price model will signify a market manipulation by Smart Money.
They will not intentionally let the price fall, not letting it break a demand zone. A buying interest that will arise consequently will be used as a source of liquidity.
Smart money will grab liquidity of the buyers, silently accumulating huge volumes of selling orders.
Once they get enough of that, a bearish rally will start, with a demand zone breakout as a trigger.
Though, the chart model that I shared above has a strong bullish impulse, preceding its formation, remember that it is not mandatory.
The price may also form a bearish impulse first and for a pattern then.
Each bullish movement that initiates after a formation of an equal low should be weaker than a previous one.
So that the price should set a lower high every time after a formation of an equal low.
Look at a price action on USDCHF forex pair. Way before the price dropped, you could easily identify a market manipulation of Smart Money and selling orders accumulation.
A breakout of a horizontal demand zone was a final bearish confirmation signal.
Let's study its bullish model.
It has a similar structure.
The price should set a sequence of equal highs, respecting a horizontal supply zone.
Each bearish move that follows after its test should have a shorter length, forming a higher low with its completion.
This model will be also valid if it forms after a completion of a bearish impulse.
Weakening bearish movements will signify a loss of confidence in a supply zone, with fewer and fewer market participants selling that.
Its bullish breakout will be an important even that will confirm a highly probable strong bullish continuation.
Smart Money will use this price model to manipulate the market and accumulate buying orders, not letting the price go through a supply zone. They will grab a liquidity of the sellers each time a bearish move follows from a supply zone.
When they finally get enough of a liquidity, a bullish rally will initiate and a supply zone will be broken , providing a strong confirmation signal.
That price model was spotted on GBPJPY forex pair.
Smart Money were manipulating the market, not letting it continue rallying by creating a significant horizontal supply zone.
Selling orders that were executed after its tests provided a liquidity for them.
A bullish breakout of the underlined zone provides a strong bullish confirmation signal.
A breakout and a future rise could be easily predicted once this price model appeared.
Why they do it?
But why do Smart Money manipulate the markets that way?
The answer is simple: in comparison to retail traders, they trade with huge trading orders . To hide their presence and to not impact market prices much, they split their positions into a set of tiny orders that they execute, grabbing the liquidity.
The price model that we discussed today is the example how they do it.
The important thing to note about this pattern is that it efficiently works on any market and any time frame. You can use that for scalping, day trading, swing trading. And it can help you find great investing opportunities.
❤️Please, support my work with like, thank you!❤️
I am part of Trade Nation's Influencer program and receive a monthly fee for using their TradingView charts in my analysis.
XAUUSD – Decision Zone Between $3,395 & $3,362Gold continues to trade within a defined structure, now pulling back from local highs after rejecting near the open. Price is approaching key support just above $3,362, which now acts as the decision point for the next leg.
Buyers held this zone previously, but momentum has weakened and the next move will be critical:
→ $3,395.76 is the upside trigger; a confirmed 30m close above could open the door toward $3,407 and higher
→ A failure to hold $3,362.60 support would expose $3,358 and possibly accelerate a bearish continuation
→ The structure remains range bound, but compression is building beneath resistance
This is a pivotal zone for gold short term. Either bulls reclaim control with a strong breakout above $3,395 or sellers step in on a confirmed breakdown below $3,362 to reset structure lower.
#XAUUSD #GoldAnalysis #PriceAction #BreakoutLevels #SupportResistance

USOIL BULLISH BIAS RIGHT NOW| LONG
USOIL SIGNAL
Trade Direction: long
Entry Level: 66.22
Target Level: 69.94
Stop Loss: 63.73
RISK PROFILE
Risk level: medium
Suggested risk: 1%
Timeframe: 9h
Disclosure: I am part of Trade Nation's Influencer program and receive a monthly fee for using their TradingView charts in my analysis.
✅LIKE AND COMMENT MY IDEAS✅

NZD/JPY BEST PLACE TO BUY FROM|LONG
NZD/JPY SIGNAL
Trade Direction: long
Entry Level: 86.809
Target Level: 88.001
Stop Loss: 86.010
RISK PROFILE
Risk level: medium
Suggested risk: 1%
Timeframe: 8h
Disclosure: I am part of Trade Nation's Influencer program and receive a monthly fee for using their TradingView charts in my analysis.
✅LIKE AND COMMENT MY IDEAS✅

CAD/JPY BULLS ARE STRONG HERE|LONG
Hello, Friends!
We are now examining the CAD/JPY pair and we can see that the pair is going down locally while also being in a downtrend on the 1W TF. But there is also a powerful signal from the BB lower band being nearby indicating that the pair is oversold so we can go long from the support line below and a target at 108.573 level.
Disclosure: I am part of Trade Nation's Influencer program and receive a monthly fee for using their TradingView charts in my analysis.
✅LIKE AND COMMENT MY IDEAS✅

AUD/JPY LONG FROM SUPPORT
Hello, Friends!
The BB lower band is nearby so AUD-JPY is in the oversold territory. Thus, despite the downtrend on the 1W timeframe I think that we will see a bullish reaction from the support line below and a move up towards the target at around 96.130.
Disclosure: I am part of Trade Nation's Influencer program and receive a monthly fee for using their TradingView charts in my analysis.
✅LIKE AND COMMENT MY IDEAS✅

GBP_NZD BULLISH BREAKOUT|LONG|
✅GBP_NZD broke the key structure level of 2.2500
While trading in an local downtrend
Which makes me bearish
And I think that after the retest of the broken level is complete
A rebound and bearish continuation will follow
SHORT🔥
✅Like and subscribe to never miss a new idea!✅

GBP-JPY Bearish Bias! Sell!
Hello,Traders!
GBP-JPY is going down
And the pair made a breakout
Of the key horizontal level
Of 195.500 so we are
Bearish biased and we
Will be expecting a
Further bearish move down
Sell!
Comment and subscribe to help us grow!
Check out other forecasts below too!
Disclosure: I am part of Trade Nation's Influencer program and receive a monthly fee for using their TradingView charts in my analysis.

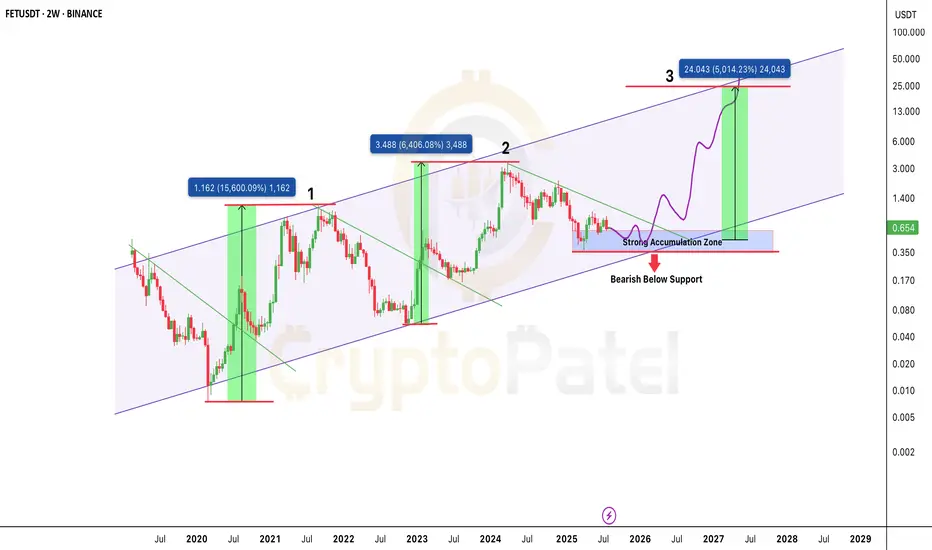
$FET is back in the zone that sparked 15,000%+ rallies?NYSE:FET is back in the zone that sparked 15,000%+ rallies. Same setup. 50x incoming?
FET continues to respect its multi-year ascending channel structure, active since 2020.
Price Action History:
🔹 Wave 1 (2020–2021): +15,600% rally from channel support to resistance
🔹 Wave 2 (2022–2024): +6,400% move following a similar breakout pattern.
🔹 Current Cycle (2025): Price is consolidating in the same accumulation range of $0.35–$0.65.
Key Demand Zone: $0.35–$0.65
Upside Target: ~$24.00 (5,000%+ potential)
🔻 Breakdown Level: Below $0.35 = Structure invalidation
Structure Insight:
Each macro move begins with:
🔹 Accumulation at channel support
🔹 Break of falling trendline
🔹 Aggressive expansion toward the upper boundary
The projected Wave 3 follows this same path if demand zone holds. The structure remains bullish as long as price stays above $0.35.
FET is trading at a high probability accumulation level within a valid macro trend. If history repeats, this could be the next major leg up.
✅ Favor long accumulation strategies
❌ Exit plan needed below $0.35
NFa & DYOR
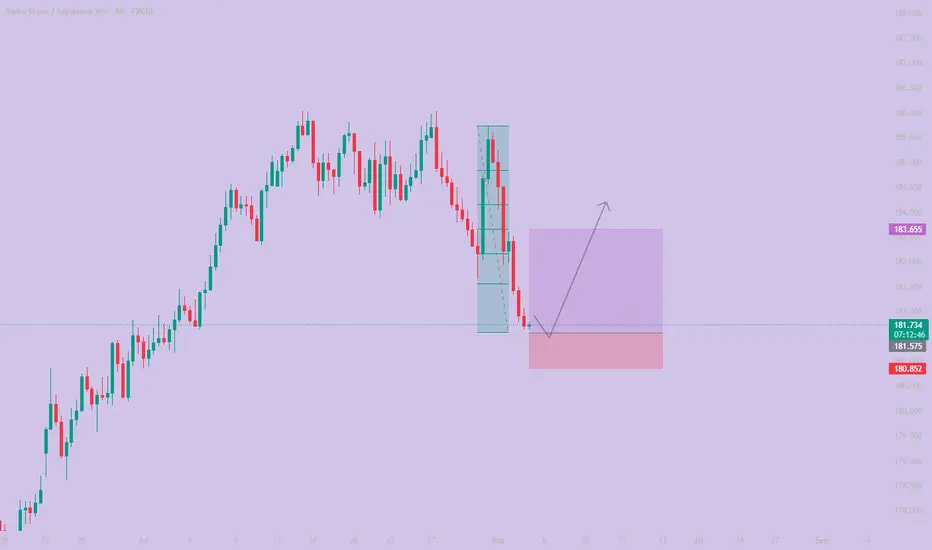
#016: CHF/JPY Long Investment Opportunity
Today I want to show you this long investment opportunity by placing a BUY LIMIT order on CHF/JPY. Hello, I'm Forex Trader Andrea Russo, an independent trader and prop trader with $200,000 in capital under management. Thank you in advance for your time.
The CHF/JPY pair is building an extremely interesting technical pattern, which could offer one of the best risk-controlled long opportunities in recent weeks.
🧠 Advanced Structural Analysis
After an orderly sequence of lower highs, the price recently completed a bearish move that looks more like directional manipulation than a true breakout.
Three key elements support this hypothesis:
- Final compression on decreasing volume
- Visible divergence between relative strength and price movement
- Volume clusters interrupted in the lower zone, with the LVN area still empty and devoid of institutional liquidity
🔍 The hunting zone is already active
According to our studies, the price is exactly within the so-called "stop hunting zone," a range between technical and psychological levels where:
- Retail traders are closing long positions at a loss
- Breakout traders are entering short positions late
- Market makers are accumulating passively, exploiting market emotion
Historically, these zones herald strong reversals if defended by banks' protective orders.
🔄 Multi-Timeframe Confluence
All higher timeframes (4H, 8H, and Daily) show a consistent picture of active cyclical support, with a potential harmonic pattern nearing completion and a technical structure that coincides with previous levels of institutional reaction.
Gold's Next Move? Eyes on the Liquidity Trap Below!Gold has created internal liquidity during the New York session and is now moving downward. There is liquidity resting below the recent swing lows, and beneath that lie bullish Pending Demand (PD) arrays. If the market takes out this liquidity, we can then look for bullish confirmations from the PD arrays for potential buy opportunities.
Do Your Own Research (DYOR).

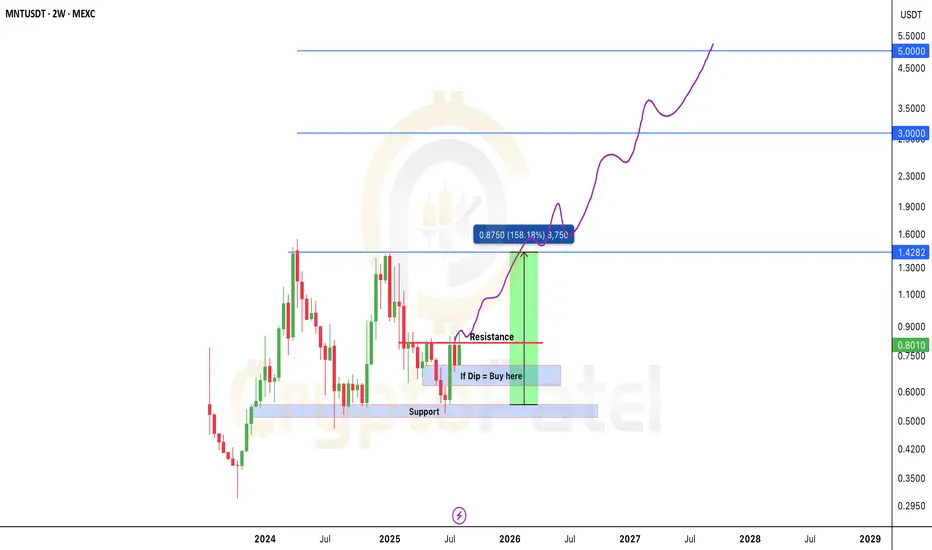
Will MNT/USDT 5x to 10x Potential Post BreakoutTSX:MNT Forming Bullish Structure – 5x to 10x Potential Post Breakout
#MNT is currently trading very close to a major resistance level at $0.82.
We’re waiting for a clean breakout above this zone. Once confirmed, price can potentially deliver a 5x–10x move in the coming days.
If price retraces, the best long-term entry zone would be around $0.70–$0.60 — right inside the accumulation box.
This bull run has strong structural support around $0.55–$0.50. As long as we stay above this zone, we remain highly confident in the upside move toward $5.
Key levels to watch:
Accumulation Zone: $0.60 – $0.70
Resistance: $0.82
Support: $0.50 – $0.55
Bull Run Targets: $1.42 / $3 / $5
NFA & DYOR
Nightly $SPY / $SPX Scenarios for August 5, 2025🔮 Nightly AMEX:SPY / SP:SPX Scenarios for August 5, 2025 🔮
🌍 Market‑Moving News 🌍
🔹 PBOC Moves Prompt FX Backlash
On August 5, 2019, China’s central bank allowed the yuan to depreciate over 2% to its lowest level since 2008. That same day, the U.S. Treasury officially designated China as a currency manipulator, citing the PBOC’s moves as retaliation for recent U.S. tariff actions. In response, China ordered state-owned enterprises to suspend purchases of U.S. agricultural goods—a significant blow to U.S. exporters.
🔹 EU Suspends Counter-Tariffs for Six Months
Following a negotiated framework with the U.S., the European Union suspended retaliatory tariffs on U.S. goods for six months. The move aims to de-escalate trade tensions while joint discussions continue.
🔹 Citi Raises Gold Price Outlook to $3,500/oz
Citi revised its short-term trading range for gold to $3,300–$3,600 per ounce, based on weakening U.S. labor data, rising inflation pressure from tariffs, and growing demand for safe-haven assets. Spot gold traded around $3,356 oz on Monday.
📊 Key Data Releases & Events 📊
📅 Tuesday, August 5:
8:30 AM ET – U.S. Trade Balance (June)
Expected to improve modestly to –$67.6 billion (from –$71.5B), reflecting tariff-influenced shifts in import/export volumes.
9:45 AM ET – S&P Global U.S. Final Services PMI & ISM Non-Manufacturing Index (July)
Key indicators of service-sector strength. Readings above 50 suggest expansion; below 50, contraction. Flash estimates forecast moderated growth in activity.
⚠️ Disclaimer:
This content is for educational and informational use only—not financial advice. Consult a licensed financial advisor before making investment decisions.
📌 #trading #stockmarket #economy #trade #data #inflation #currency

GOLD Buyers In Panic! SELL!
My dear friends,
Please, find my technical outlook for GOLD below:
The instrument tests an important psychological level 3309.2
Technical Indicators: Supper Trend gives a precise Bearish signal, while Pivot Point HL predicts price changes and potential reversals in the market.
Target - 3296.9
Recommended Stop Loss - 3316.4
About Used Indicators:
Super-trend indicator is more useful in trending markets where there are clear uptrends and downtrends in price.
Disclosure: I am part of Trade Nation's Influencer program and receive a monthly fee for using their TradingView charts in my analysis.
———————————
WISH YOU ALL LUCK

EURCAD What Next? BUY!
My dear friends,
My technical analysis for EURCAD is below:
The market is trading on 1.5784 pivot level.
Bias - Bullish
Technical Indicators: Both Super Trend & Pivot HL indicate a highly probable Bullish continuation.
Target - 1.5907
About Used Indicators:
A pivot point is a technical analysis indicator, or calculations, used to determine the overall trend of the market over different time frames.
Disclosure: I am part of Trade Nation's Influencer program and receive a monthly fee for using their TradingView charts in my analysis.
———————————
WISH YOU ALL LUCK

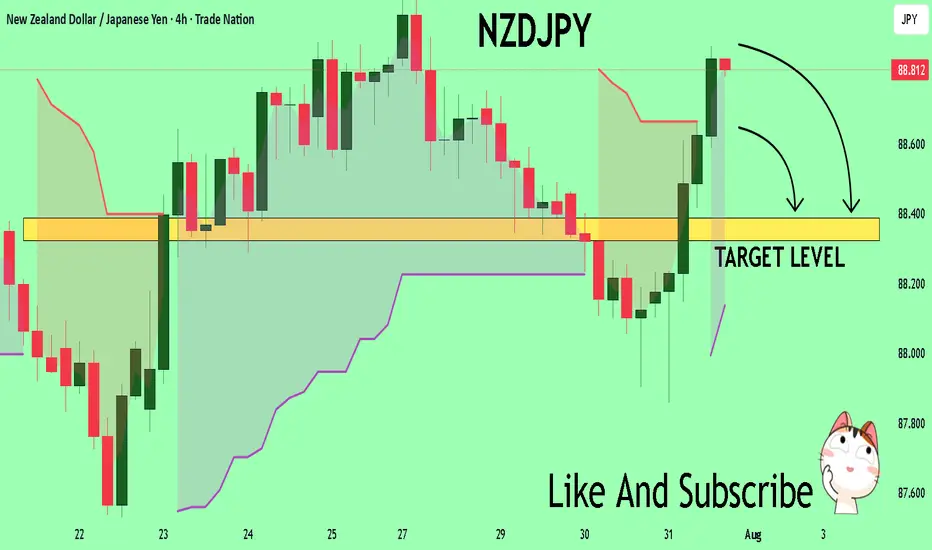
NZDJPY The Target Is DOWN! SELL!
My dear friends,
Please, find my technical outlook for NZDJPY below:
The price is coiling around a solid key level - 88.806
Bias - Bearish
Technical Indicators: Pivot Points Low anticipates a potential price reversal.
Super trend shows a clear sell, giving a perfect indicators' convergence.
Goal - 88.388
About Used Indicators:
The pivot point itself is simply the average of the high, low and closing prices from the previous trading day.
Disclosure: I am part of Trade Nation's Influencer program and receive a monthly fee for using their TradingView charts in my analysis.
———————————
WISH YOU ALL LUCK
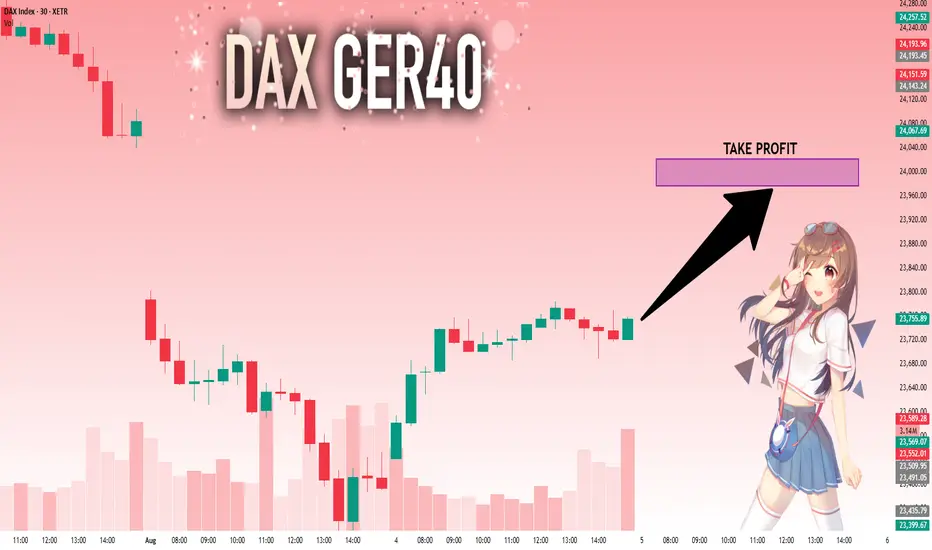
DAX: Bulls Are Winning! Long!
My dear friends,
Today we will analyse DAX together☺️
The market is at an inflection zone and price has now reached an area around 23,755.89 where previous reversals or breakouts have occurred.And a price reaction that we are seeing on multiple timeframes here could signal the next move up so we can enter on confirmation, and target the next key level of 23,976.72.Stop-loss is recommended beyond the inflection zone.
❤️Sending you lots of Love and Hugs❤️
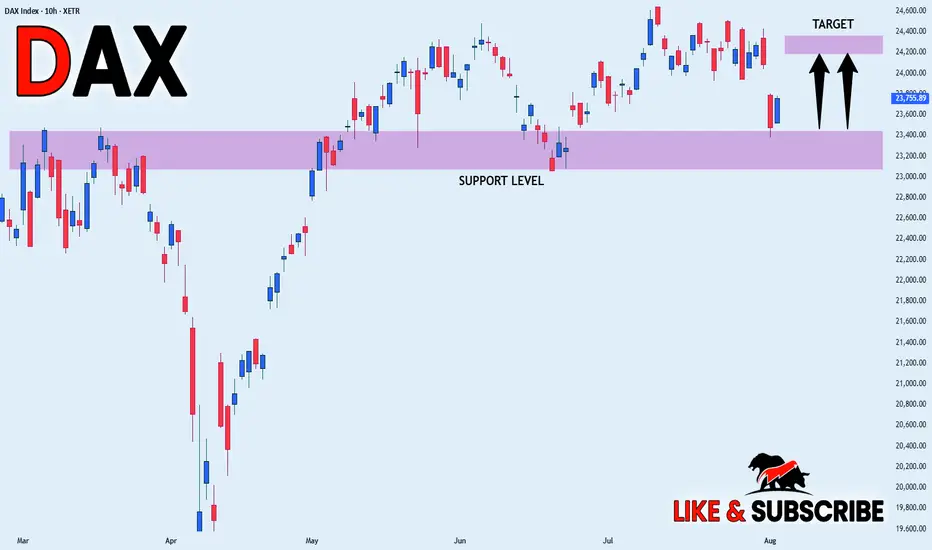
DAX WILL GROW|LONG|
✅DAX is trading in an
Uptrend and the index made
A bullish rebound from the
Horizontal support of 23,400
Which reinforces our bullish
Bias and we will be expecting
A further bullish move up
LONG🚀
✅Like and subscribe to never miss a new idea!✅
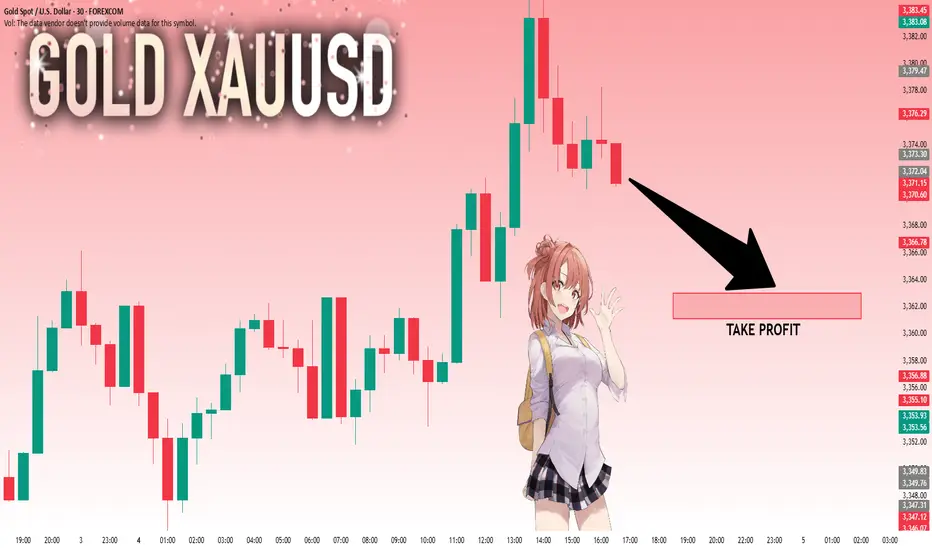
GOLD: Next Move Is Down! Short!
My dear friends,
Today we will analyse GOLD together☺️
The price is near a wide key level
and the pair is approaching a significant decision level of 3,372.04 Therefore, a strong bearish reaction here could determine the next move down.We will watch for a confirmation candle, and then target the next key level of 3,363.00..Recommend Stop-loss is beyond the current level.
❤️Sending you lots of Love and Hugs❤️