EURUSD Will Go Up! Long!
Here is our detailed technical review for EURUSD.
Time Frame: 12h
Current Trend: Bullish
Sentiment: Oversold (based on 7-period RSI)
Forecast: Bullish
The market is on a crucial zone of demand 1.156.
The oversold market condition in a combination with key structure gives us a relatively strong bullish signal with goal 1.169 level.
P.S
Overbought describes a period of time where there has been a significant and consistent upward move in price over a period of time without much pullback.
Like and subscribe and comment my ideas if you enjoy them!
Trading

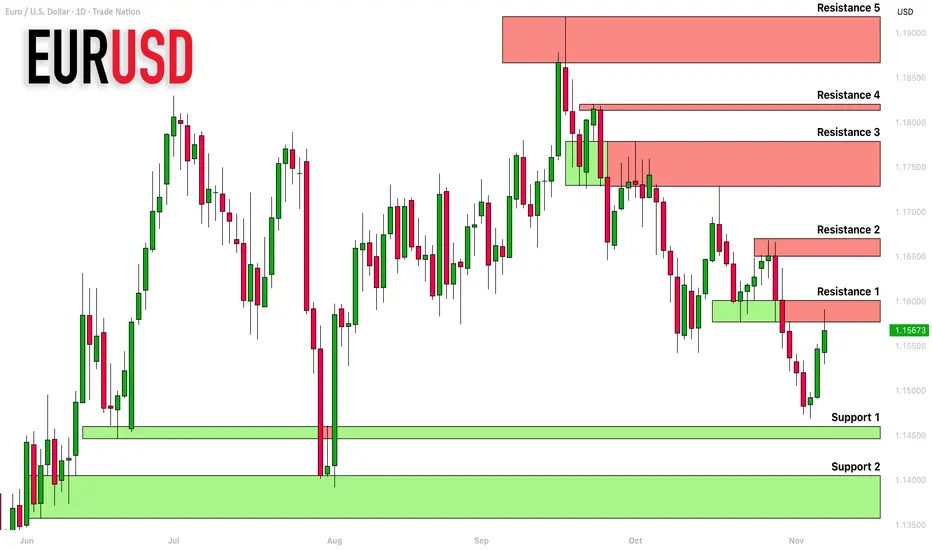
EURUSD: Support & Resistance Analysis For Next Week 🇪🇺🇺🇸
Here is my latest structure analysis and important
supports and resistances for EURUSD for next week.
Consider these structures for pullback/breakout trading.
❤️Please, support my work with like, thank you!❤️
I am part of Trade Nation's Influencer program and receive a monthly fee for using their TradingView charts in my analysis.
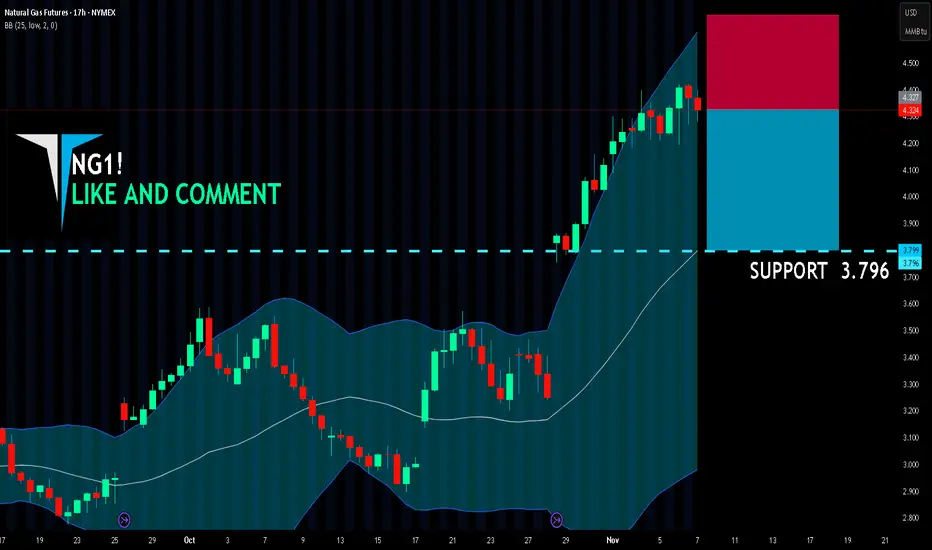
NG1! BEST PLACE TO SELL FROM|SHORT
NG1! SIGNAL
Trade Direction: short
Entry Level: 4.327
Target Level: 3.796
Stop Loss: 4.678
RISK PROFILE
Risk level: medium
Suggested risk: 1%
Timeframe: 17h
Disclosure: I am part of Trade Nation's Influencer program and receive a monthly fee for using their TradingView charts in my analysis.
✅LIKE AND COMMENT MY IDEAS✅
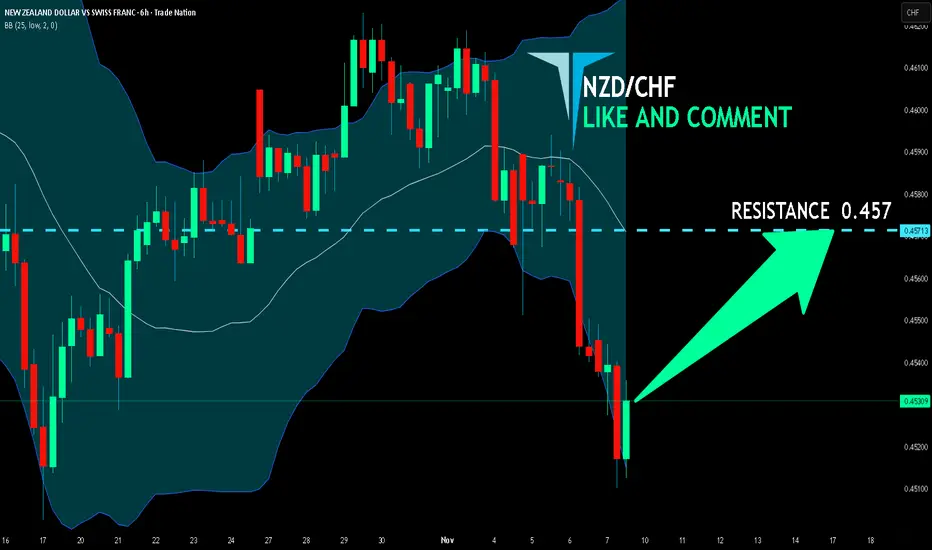
NZD/CHF BULLS ARE STRONG HERE|LONG
Hello, Friends!
NZD/CHF pair is in the uptrend because previous week’s candle is green, while the price is obviously falling on the 6H timeframe. And after the retest of the support line below I believe we will see a move up towards the target above at 0.457 because the pair is oversold due to its proximity to the lower BB band and a bullish correction is likely.
Disclosure: I am part of Trade Nation's Influencer program and receive a monthly fee for using their TradingView charts in my analysis.
✅LIKE AND COMMENT MY IDEAS✅
EUR/USD Could Drop Soon — Watch This 4H FVG Area!Hi everyone, this is my new analysis on EUR/USD.
As you can see, the price is currently in a downtrend on the 4-hour timeframe.
We have a clear Fair Value Gap (FVG) that aligns with the downtrend line. At the same time, the price is approaching the 61.8% Fibonacci retracement level, while the DXY chart is sitting at a support zone.
Based on this confluence, I expect the price to reach the 4H FVG zone soon.
Once it gets there, we need to wait for a Change of Character (CHOCH) to the downside on the 15-minute or 5-minute timeframe before entering a sell position.
I’ve also marked the daily support level on the chart. I expect the price to create a new low and test this daily support before any potential bounce.
⚠️ Important:
If we don’t see any CHOCH on the 15M or 5M timeframe once the price reaches the FVG zone, then this setup becomes invalid.
The setup is only valid if the price taps into the 4H FVG and shows a clear CHOCH to the downside — that’s our signal to go short.
This setup offers a very good risk-to-reward ratio if confirmed.

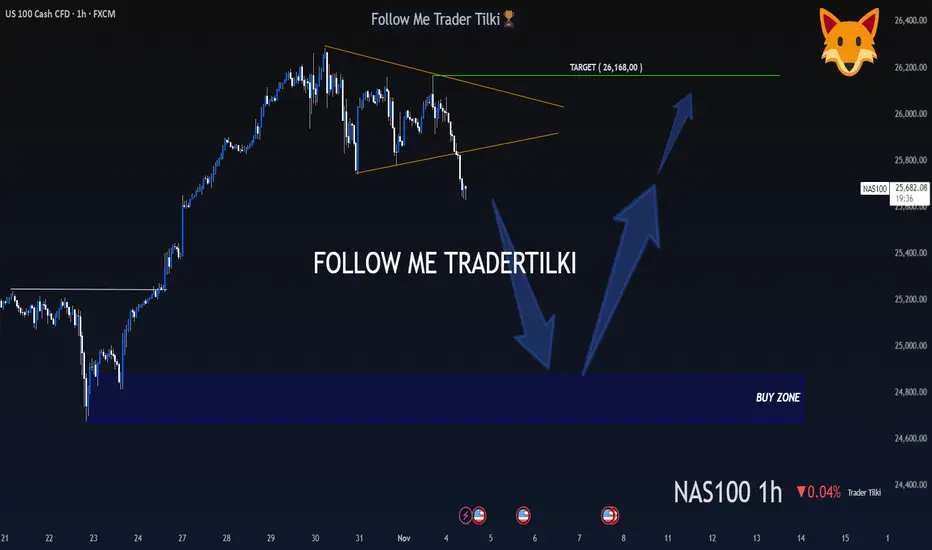
A Hunter Waits Patiently, Then Strikes Like a Lion - US100 - 1HMy dear friends, greetings,
My friends, I have set the buy levels for US100 at 24,872 and 24,677.
I will never enter a trade or put myself at unnecessary risk before these levels are reached.
My friends, in order to consistently win in this market and to become a successful trader, patience is essential.
If you act with patience and strategy, you will always be a winning trader, just like me.
I would also like you to know that my target is set at the 26,168 level.
My friends, every single like from you is my greatest motivation to share these analyses.
I sincerely thank everyone who supports me with their appreciation.
With my respect and love.
NZDUSD LOCAL SHORT|
✅NZDUSD Price retraced to a premium zone, tapping into an unmitigated supply block that aligns with prior imbalance. A short-term bearish delivery is expected toward the discounted area below. Time Frame 1H.
SHORT🔥
✅Like and subscribe to never miss a new idea!✅

CHF-JPY Free Signal! Sell!
Hello,Traders!
CHFJPY tapped into a horizontal supply area after engineering liquidity above internal highs. Expect a bearish reaction as smart money delivers price toward the next demand imbalance.
---------------------
Stop Loss: 190.714
Take Profit: 190.165
Entry: 190.493
Time Frame: 2H
---------------------
Sell!
Comment and subscribe to help us grow!
Check out other forecasts below too!
Disclosure: I am part of Trade Nation's Influencer program and receive a monthly fee for using their TradingView charts in my analysis.

BRIEFING Week #45 : Growth made the TopHere's your weekly update ! Brought to you each weekend with years of track-record history..
Don't forget to hit the like/follow button if you feel like this post deserves it ;)
That's the best way to support me and help pushing this content to other users.
Kindly,
Phil

GBPUSD BULLISH BREAKOUT|LONG|
✅GBPUSD after a clean breakout above the key level, price is retracing to rebalance inefficiency before likely expansion into buy-side liquidity. Smart money longs are now aligned with order flow. Time Frame 2H.
LONG🚀
✅Like and subscribe to never miss a new idea!✅

EUR-USD Local Long! Buy!
Hello,Traders!
EURUSD Price retraced after grabbing liquidity above equal highs and is now reacting from a discounted demand zone. Expect bullish continuation toward the next supply level. Time Frame 2H.
Buy!
Comment and subscribe to help us grow!
Check out other forecasts below too!
Disclosure: I am part of Trade Nation's Influencer program and receive a monthly fee for using their TradingView charts in my analysis.

TESLA Sellers In Panic! BUY!
My dear subscribers,
My technical analysis for TESLA is below:
The price is coiling around a solid key level - 429.39
Bias - Bullish
Technical Indicators: Pivot Points Low anticipates a potential price reversal.
Super trend shows a clear buy, giving a perfect indicators' convergence.
Goal - 446.44
About Used Indicators:
By the very nature of the supertrend indicator, it offers firm support and resistance levels for traders to enter and exit trades. Additionally, it also provides signals for setting stop losses
Disclosure: I am part of Trade Nation's Influencer program and receive a monthly fee for using their TradingView charts in my analysis.
———————————
WISH YOU ALL LUCK

US100 FREE SIGNAL|SHORT|
✅US100 is pushing towards the premium supply zone and after a liquidity sweep above short-term highs we will expect continuation toward the next downside inefficiency as sell-side liquidity gets targeted on Monday!
—————————
Entry: 25,115.5$
Stop Loss: 25,200$
Take Profit: 24,900$
Time Frame: 3H
—————————
** SHORT🔥
✅Like and subscribe to never miss a new idea!✅

EURCAD Sellers In Panic! BUY!
My dear subscribers,
EURCAD looks like it will make a good move, and here are the details:
The market is trading on 1.6246 pivot level.
Bias - Bullish
My Stop Loss - 1.6231
Technical Indicators: Both Super Trend & Pivot HL indicate a highly probable Bullish continuation.
Target - 1.6272
About Used Indicators:
The average true range (ATR) plays an important role in 'Supertrend' as the indicator uses ATR to calculate its value. The ATR indicator signals the degree of price volatility.
Disclosure: I am part of Trade Nation's Influencer program and receive a monthly fee for using their TradingView charts in my analysis.
———————————
WISH YOU ALL LUCK

SPY Massive Long! BUY!
My dear followers,
I analysed this chart on SPY and concluded the following:
The market is trading on 670.89 pivot level.
Bias - Bullish
Technical Indicators: Both Super Trend & Pivot HL indicate a highly probable Bullish continuation.
Target - 678.65
About Used Indicators:
A super-trend indicator is plotted on either above or below the closing price to signal a buy or sell. The indicator changes color, based on whether or not you should be buying. If the super-trend indicator moves below the closing price, the indicator turns green, and it signals an entry point or points to buy.
Disclosure: I am part of Trade Nation's Influencer program and receive a monthly fee for using their TradingView charts in my analysis.
———————————
WISH YOU ALL LUCK

BTCUSD What Next? SELL!
My dear followers,
This is my opinion on the BTCUSD next move:
The asset is approaching an important pivot point 10376
Bias - Bearish
Safe Stop Loss - 10456
Technical Indicators: Supper Trend generates a clear short signal while Pivot Point HL is currently determining the overall Bearish trend of the market.
Goal - 10230
About Used Indicators:
For more efficient signals, super-trend is used in combination with other indicators like Pivot Points.
Disclosure: I am part of Trade Nation's Influencer program and receive a monthly fee for using their TradingView charts in my analysis.
———————————
WISH YOU ALL LUCK

SPY Free Signal! Sell! (For Monday)
Hello,Traders!
SPY has tapped into a premium supply zone, triggering a potential bearish delivery after a clean liquidity grab above equal highs. Expect continuation toward sell-side imbalance.
---------------------
Stop Loss: 674.31$
Take Profit: 666.68$
Entry Level: 670.89$
Time Frame: 2H
---------------------
Sell!
Comment and subscribe to help us grow!
Check out other forecasts below too!
Disclosure: I am part of Trade Nation's Influencer program and receive a monthly fee for using their TradingView charts in my analysis.

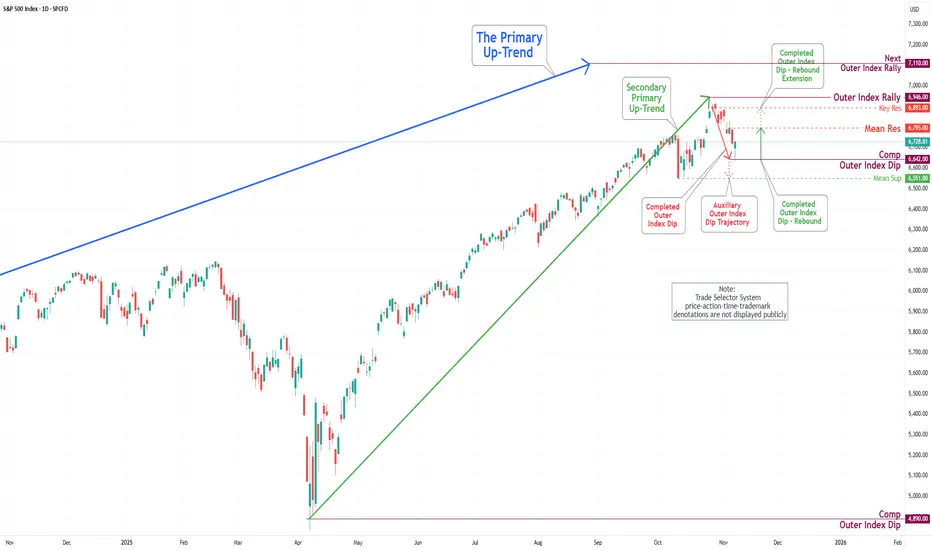
S&P 500 Daily Chart Analysis For Week of Nov 7, 2025Technical Analysis and Outlook:
During the recent trading session, the S&P 500 Index experienced a notable decline, underscoring the significance of our key target, situated at the Mean Support level of 6,740. The index has now completed the Outer Index Dip at 6,642. This positioning indicates the potential for further upward movement, with the target established at the Mean Resistance level of 6,795. The prevailing trend suggests a well-structured extension towards the Key Resistance level of 6,893, with an ultimate target for the Outer Index Rally set at 7,110.
Nevertheless, it is crucial to acknowledge the possibility of a substantial drawdown in the forthcoming week’s trading session. This may lead to a retest of the Outer Index Dip at 6,642, possibly resulting in a further decline to the Mean Support level at 6,551 before ultimately resuming an upward trajectory.
EUR/USD Daily Chart Analysis For Week of Nov 7, 2025Technical Analysis and Outlook:
During the most recent trading session, the Eurodollar market demonstrated considerable volatility, characterized by both significant downward and upward movements. The initial decline caused prices to decrease sharply, reaching and passing the Inner Currency Dip at 1.151, subsequently followed by a vigorous rebound that resulted in a retest of the Mean Resistance level at 1.159.
Current market analysis suggests that the prevailing sentiment is inclined toward a downward trajectory, with prices likely to target the Mean Support level at 1.153. There is a watchful expectation that this movement may lead to a subsequent retest of the Outer Currency Dip at 1.148. Furthermore, it is imperative to monitor the breakout thresholds for the currency, focusing on the two principal handles: Mean Resistance at 1.159 and Mean Support at 1.153.

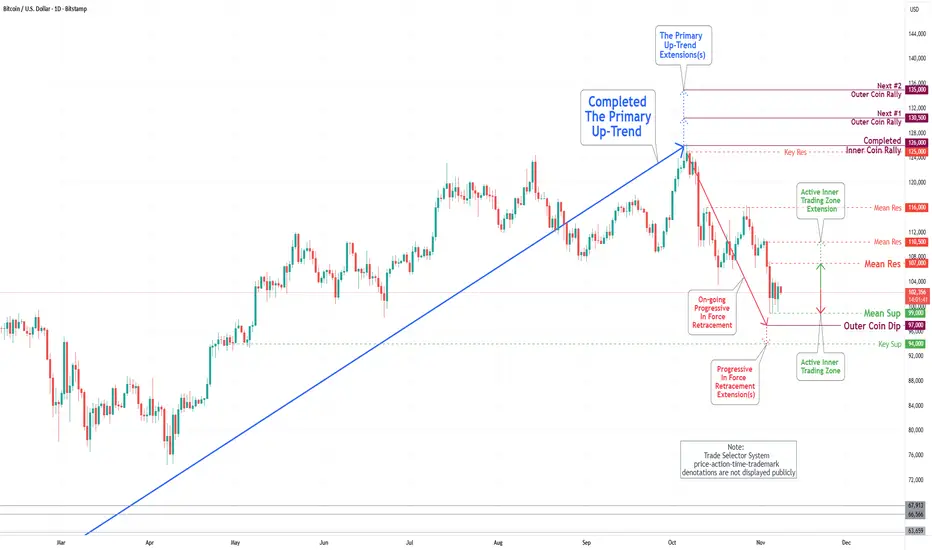
Bitcoin(BTC/USD) Daily Chart Analysis For Week of Nov 7, 2025Technical Analysis and Outlook:
In the previous trading session, the Bitcoin market experienced a notable drawdown over the past week, with the Mean Support established at 101,000, around which trading activity was concentrated. Presently, the price is actively maintained within the range defined by the Mean Resistance at 107,000 and the Mean Support at 97,000.
Current market analysis suggests the likelihood of a retest toward the Mean Support level at 99,000, with a primary emphasis on the potential for further downward movement toward the Outer Coin Dip at 97,000, which may extend to the Key Support level at 94,000. Nonetheless, it is vital to recognize the substantial rebound potential present at these critical levels.
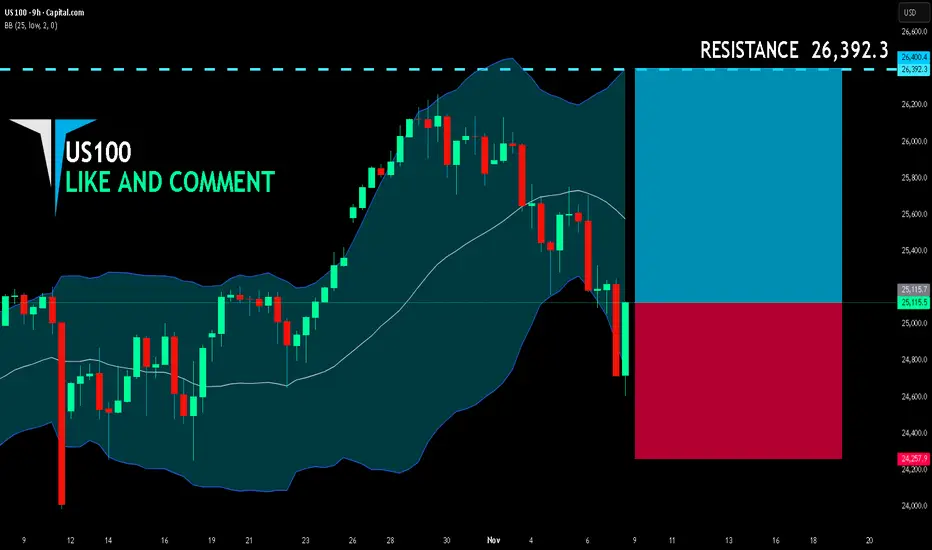
US100 LONG FROM SUPPORT
US100 SIGNAL
Trade Direction: long
Entry Level: 25,115.7
Target Level: 26,392.3
Stop Loss: 24,257.9
RISK PROFILE
Risk level: medium
Suggested risk: 1%
Timeframe: 9h
Disclosure: I am part of Trade Nation's Influencer program and receive a monthly fee for using their TradingView charts in my analysis.
✅LIKE AND COMMENT MY IDEAS✅
CAD/CHF BEARS WILL DOMINATE THE MARKET|SHORT
Hello, Friends!
CAD/CHF pair is trading in a local uptrend which we know by looking at the previous 1W candle which is green. On the 1D timeframe the pair is going up too. The pair is overbought because the price is close to the upper band of the BB indicator. So we are looking to sell the pair with the upper BB line acting as resistance. The next target is 0.561 area.
Disclosure: I am part of Trade Nation's Influencer program and receive a monthly fee for using their TradingView charts in my analysis.
✅LIKE AND COMMENT MY IDEAS✅

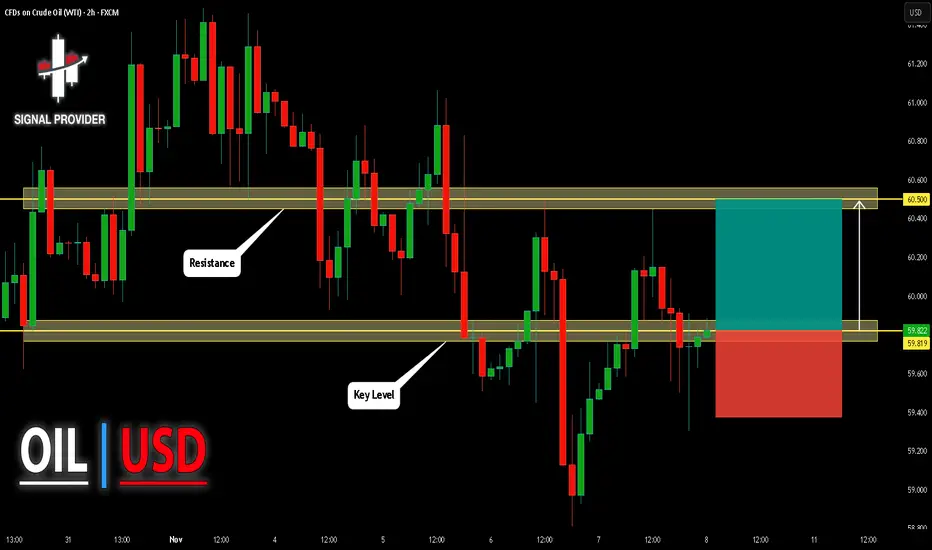
USOIL Will Move Higher! Buy!
Take a look at our analysis for USOIL.
Time Frame: 2h
Current Trend: Bullish
Sentiment: Oversold (based on 7-period RSI)
Forecast: Bullish
The price is testing a key support 59.819.
Current market trend & oversold RSI makes me think that buyers will push the price. I will anticipate a bullish movement at least to 60.500 level.
P.S
Please, note that an oversold/overbought condition can last for a long time, and therefore being oversold/overbought doesn't mean a price rally will come soon, or at all.
Like and subscribe and comment my ideas if you enjoy them!