GOLD 1H CHART ROUTE MAP UPDATE & TRADING PLAN FOR THE WEEKHey Everyone,
Please see our 1h chart levels and targets for the coming week.
We are seeing price play between two weighted levels with a gap above at 4360 and a gap below at 4327, as support. We will need to see ema5 cross and lock on either weighted level to determine the next range.
We will see levels tested side by side until one of the weighted levels break and lock to confirm direction for the next range.
We will keep the above in mind when taking buys from dips. Our updated levels and weighted levels will allow us to track the movement down and then catch bounces up.
We will continue to buy dips using our support levels taking 20 to 40 pips. As stated before each of our level structures give 20 to 40 pip bounces, which is enough for a nice entry and exit. If you back test the levels we shared every week for the past 24 months, you can see how effectively they were used to trade with or against short/mid term swings and trends.
The swing range give bigger bounces then our weighted levels that's the difference between weighted levels and swing ranges.
BULLISH TARGET
4360
EMA5 CROSS AND LOCK ABOVE 4360 WILL OPEN THE FOLLOWING BULLISH TARGETS
4388
EMA5 CROSS AND LOCK ABOVE 4388 WILL OPEN THE FOLLOWING BULLISH TARGETS
4417
EMA5 CROSS AND LOCK ABOVE 4417 WILL OPEN THE FOLLOWING BULLISH TARGETS
4449
BEARISH TARGETS
4327
EMA5 CROSS AND LOCK BELOW 4327 WILL OPEN THE FOLLOWING BEARISH TARGET
4299
EMA5 CROSS AND LOCK BELOW 4299 WILL OPEN THE SWING RANGE
4270
4236
EMA5 CROSS AND LOCK BELOW 4236 WILL OPEN THE SECONDARY SWING RANGE
4212
4183
As always, we will keep you all updated with regular updates throughout the week and how we manage the active ideas and setups. Thank you all for your likes, comments and follows, we really appreciate it!
Mr Gold
GoldViewFX
Tradingideas

Axis Bank | Gann Square of 9 – 45° Reaction Zone | 12 Apr 2022This idea highlights a historical intraday case study on Axis Bank Ltd, demonstrating how Gann Square of 9 price-degree mapping helps identify logical reaction zones.
On 12 April 2022, Axis Bank showed a textbook example of degree-based price behavior using Gann’s geometric framework.
📈 Price–Degree Structure
0° reference: ₹777.80
45° projection: ₹791.81
90° projection: ₹805.94
Price advanced from the 0° base and completed the 45° distance well within the intraday time window.
⏱️ Gann Time Principle
As per Gann’s intraday methodology:
When 45° is reached before 2:30 PM, it often acts as a reaction or resistance zone
In this session, price touched the 45° level and showed a clear reaction, validating the relevance of degree-based price geometry.
📐 Key Observation
Although price later moved toward the 90° level, it remained confined between the 45°–90° range, illustrating how Gann degrees often act as natural market boundaries rather than arbitrary levels.
🧠 Conclusion
This case demonstrates how converting price into degrees using the Gann Square of 9 allows traders to:
Anticipate logical reaction zones
Avoid emotional decision-making
Understand structure instead of chasing momentum
Disclaimer:
This idea is shared strictly for educational and analytical purposes only. It does not constitute any investment advice or trade recommendation.

Axis Bank | Gann Square of 9 – 45° Reversal Case Study | 4 Apr 2This idea documents a historical intraday case study on Axis Bank Ltd, demonstrating how Gann Square of 9 degree levels act as precise resistance zones.
On 4 April 2022, Axis Bank initiated an upward move from the 0° reference near ₹767. Using the Gann Square of 9 calculation, the 45° projection was identified near ₹781.
Price advanced steadily and formed a high at ₹780.55, coming within 0.5 points of the calculated 45° level.
This reaction fell well within the acceptable tolerance range and resulted in a clear intraday rejection from the 45° degree zone.
📐 Key Gann Levels Observed
0° → ₹767
45° → ₹781
🧠 Concept Highlight
According to Gann’s price-degree structure, when price approaches a 45° level within the intraday time window, it often behaves as a temporary resistance or reversal zone.
This example shows:
Respect for angular resistance
Precision of degree-based levels
How small deviations can still validate Gann structure
Disclaimer:
This chart is shared for educational and analytical purposes only. It does not constitute a buy or sell recommendation.

Axis Bank | Gann Degrees & Intraday Reversal | May 25, 2022This idea presents a historical intraday case study on Axis Bank using WD Gann degree calculations to analyze price behavior and reversal zones.
On 25 May 2022, Axis Bank opened with a downward bias. The intraday reference was established using the day’s high at ₹672, marked as the 0-degree (0°) level.
Based on Gann degree progression, the following levels were derived:
0° → ₹672
45° → ₹659
90° → ₹646
As price declined during the session, it approached the 45° level but did not complete the full degree movement before the late afternoon. Around 12:45 PM, the stock reacted sharply from ₹660.05, which was within 1 point of the calculated 45° level (₹659).
This reaction occurred inside acceptable price tolerance and aligned with Gann’s concept of degree-based support, after which the stock moved higher toward ₹667, forming a clean intraday recovery.
📌 Key Observations
Degree levels help define logical support and resistance
Minor deviations around exact levels are normal
Time + price alignment improves trade structure
Not every move needs indicators to be explained
📘 Educational Takeaway
This example shows how Gann geometry converts price movement into measurable zones, helping traders analyze intraday behavior with structure instead of emotion.
Disclaimer:
This chart study is shared for educational and analytical purposes only. It is not a trade recommendation.

GOLD 4H CHART ROUTE MAP UPDATE & TRADING PLAN FOR THE WEEKHey Everyone,
Please see our 4h chart route map and trading plan for the week ahead.
We are now seeing price play between two weighted levels with a gap above at 4381 and a gap below at 4303. We will need to see ema5 cross and lock on either weighted level to determine the next range.
We will see levels tested side by side until one of the weighted levels break and lock to confirm direction for the next range.
We will keep the above in mind when taking buys from dips. Our updated levels and weighted levels will allow us to track the movement down and then catch bounces up.
We will continue to buy dips using our support levels taking 20 to 40 pips. As stated before each of our level structures give 20 to 40 pip bounces, which is enough for a nice entry and exit. If you back test the levels we shared every week for the past 24 months, you can see how effectively they were used to trade with or against short/mid term swings and trends.
The swing range give bigger bounces then our weighted levels that's the difference between weighted levels and swing ranges.
BULLISH TARGET
4381
EMA5 CROSS AND LOCK ABOVE 4381 WILL OPEN THE FOLLOWING BULLISH TARGET
4459
BEARISH TARGET
4303
EMA5 CROSS AND LOCK BELOW 4303 WILL OPEN THE FOLLOWING BEARISH TARGET
4222
EMA5 CROSS AND LOCK BELOW 4222 WILL OPEN THE SWING RANGE
4130
4042
EMA5 CROSS AND LOCK BELOW 4042 WILL OPEN THE SECONDARY SWING RANGE
3964
3873
As always, we will keep you all updated with regular updates throughout the week and how we manage the active ideas and setups. Thank you all for your likes, comments and follows, we really appreciate it!
Mr Gold
GoldViewFX

GOLD DAILY CHART ROUTE MAPPlease see our Daily chart route map that we are tracking.
Same as last week we are seeing price play between the longer daily chart range 4259 and 4444, with the channel half-line acting as primary support.
Last week we stated that we have a body close above 4259 leaving a long range gap open above at 4444 and will need ema5 lock to further confirm and strengthen this. We now also have the ema5 lock confirmation this week.
This is the beauty of our Goldturn channels, which we draw in our unique way, using averages rather than price. This enables us to identify fake-outs and breakouts clearly, as minimal noise in the way our channels are drawn.
We will use our smaller timeframe analysis on the 1H and 4H chart to buy dips from the weighted Goldturns for 30 to 40 pips clean. Ranging markets are perfectly suited for this type of trading, instead of trying to hold longer positions and getting chopped up in the swings up and down in the range.
We will keep the above in mind when taking buys from dips. Our updated levels and weighted levels will allow us to track the movement down and then catch bounces up using our smaller timeframe ideas.
Our long term bias is Bullish and therefore we look forward to drops from rejections, which allows us to continue to use our smaller timeframes to buy dips using our levels and setups.
Buying dips allows us to safely manage any swings rather then chasing the bull from the top.
Thank you all for your likes, comments and follows, we really appreciate it!
Mr Gold
GoldViewFX

EURUSD, H4 - Testing of significant support levelPrice is testing significant level of support which is also another test of the trendline.
So possible bullish reaction once minor resistance at 1.17280 is broken. Target at the next resistance at 1.17600.
Alternatively, if this support and trendline is broken down, the next level of possible demand is is Fair Value Gap at range of 1.16600-1.16800.
Trade carefully!

Cybersecurity Risks in the Global Trading SystemThreats, Vulnerabilities, and Strategic Defenses
In today’s highly interconnected world, the global trading system relies heavily on digital infrastructure. From stock exchanges and commodity markets to forex platforms and cross-border payment systems, technology is the backbone of modern trade. While digitization has improved speed, efficiency, and accessibility, it has also exposed global markets to significant cybersecurity risks. Cyber threats now pose one of the most critical non-financial risks to the stability, trust, and integrity of global trading systems.
Understanding the Global Trading System’s Digital Dependency
The global trading system includes stock exchanges, clearing corporations, depositories, brokerage firms, banks, commodity exchanges, logistics networks, and regulatory systems. These entities are interconnected through real-time data feeds, cloud services, APIs, and payment networks such as SWIFT. Even a minor cyber incident in one node can trigger a cascading effect across global markets.
High-frequency trading (HFT), algorithmic trading, and automated settlement systems depend on uninterrupted data flow and low latency. This dependency makes the system extremely sensitive to cyber disruptions, where milliseconds of delay or data manipulation can result in massive financial losses.
Major Cybersecurity Risks in Global Trading Systems
1. Data Breaches and Information Theft
One of the most common cybersecurity risks is data breaches. Trading platforms store sensitive information such as client identities, bank details, trade positions, proprietary algorithms, and market strategies. A successful breach can lead to insider trading, front-running, identity theft, and financial fraud.
State-sponsored hackers and cybercriminal groups often target financial institutions to steal market-sensitive data, which can be exploited for unfair trading advantages or sold on the dark web.
2. Market Manipulation Through Cyber Attacks
Cyber attackers can manipulate markets by altering data feeds, hacking trading algorithms, or spreading false information. For example, compromising a price feed can trigger automated buy or sell orders, leading to artificial volatility or flash crashes.
In algorithm-driven markets, even small distortions in data can cause massive ripple effects. Attackers may exploit vulnerabilities to manipulate liquidity, inflate volumes, or disrupt price discovery mechanisms.
3. Distributed Denial of Service (DDoS) Attacks
DDoS attacks flood trading platforms or exchanges with traffic, making systems unavailable to legitimate users. During critical market hours, such attacks can halt trading, delay order execution, or prevent access to risk management systems.
DDoS attacks are often used strategically during geopolitical tensions, economic announcements, or high-volatility events to destabilize markets or undermine confidence in financial institutions.
4. Ransomware Attacks on Financial Infrastructure
Ransomware attacks have become increasingly sophisticated. Hackers encrypt critical trading and settlement systems and demand ransom payments to restore access. If clearing and settlement systems are compromised, it can delay trade confirmations, margin calculations, and fund transfers.
Such attacks not only cause financial losses but also damage reputations and erode investor trust in the reliability of global trading systems.
Systemic Risk and Cascading Failures
Cybersecurity risks in global trading systems are not isolated threats—they represent systemic risk. A successful cyberattack on a major exchange, clearing house, or payment network can disrupt multiple markets simultaneously.
For example:
A compromised clearing corporation can delay settlements across thousands of trades.
A hacked forex trading platform can affect currency stability.
A cyberattack on a major bank can freeze liquidity across regions.
These cascading failures can amplify market panic, trigger margin calls, and even lead to broader financial instability.
Geopolitical and State-Sponsored Cyber Threats
Cybersecurity has become a tool of geopolitical conflict. Nation-states increasingly use cyber warfare to target financial infrastructure of rival economies. Global trading systems are prime targets because disrupting financial markets can weaken economic stability without direct military confrontation.
State-sponsored cyberattacks may aim to:
Undermine confidence in a country’s financial markets
Steal economic intelligence
Disrupt trade during sanctions or conflicts
Manipulate commodity or currency markets
This elevates cybersecurity from an IT issue to a matter of national and global economic security.
Third-Party and Supply Chain Vulnerabilities
Global trading systems rely on third-party vendors for cloud services, data analytics, trading software, and connectivity. A vulnerability in any third-party provider can expose multiple institutions simultaneously.
Supply chain attacks—where hackers infiltrate a trusted vendor to access clients—are particularly dangerous. Since vendors often have privileged system access, attackers can bypass traditional security controls and remain undetected for long periods.
Human Error and Insider Threats
Despite advanced security technologies, human error remains a major risk factor. Weak passwords, phishing emails, poor access controls, and lack of cybersecurity awareness can open doors to attackers.
Insider threats—whether malicious or accidental—are equally dangerous. Disgruntled employees or compromised insiders can leak sensitive data, sabotage systems, or provide access credentials to attackers.
Regulatory and Compliance Challenges
Global trading systems operate across multiple jurisdictions, each with different cybersecurity regulations and standards. Inconsistent regulatory frameworks create gaps that attackers can exploit.
Additionally, rapid technological innovation often outpaces regulation. New trading technologies such as decentralized finance (DeFi), blockchain-based trading, and AI-driven systems introduce fresh cybersecurity risks that regulators may not fully address yet.
Impact on Market Confidence and Trust
Trust is the foundation of global trading. Cyber incidents erode investor confidence, reduce participation, and increase risk premiums. Repeated cybersecurity failures can push investors away from affected markets and lead to long-term reputational damage for exchanges and financial institutions.
In extreme cases, loss of trust can cause liquidity shortages, capital flight, and prolonged market instability.
Strengthening Cybersecurity in Global Trading Systems
To mitigate cybersecurity risks, a multi-layered and proactive approach is essential:
Advanced Threat Detection: Use AI and machine learning to identify abnormal trading behavior and cyber intrusions in real time.
Zero-Trust Architecture: Assume no system or user is automatically trusted; verify every access request.
Regular Stress Testing: Conduct cyber stress tests and simulations to assess resilience against large-scale attacks.
Encryption and Data Protection: Secure data at rest and in transit using strong cryptographic standards.
Employee Training: Build cybersecurity awareness to reduce phishing and social engineering risks.
Global Coordination: Regulators, exchanges, and financial institutions must share threat intelligence and coordinate responses to cyber incidents.
Conclusion
Cybersecurity risks in the global trading system represent one of the most significant challenges to modern financial markets. As trading becomes faster, more automated, and more interconnected, the potential impact of cyber threats grows exponentially. These risks go beyond financial losses, threatening market integrity, systemic stability, and global economic trust.
Addressing cybersecurity is no longer optional—it is a strategic imperative. Only through continuous investment in technology, strong governance, international cooperation, and a culture of cyber resilience can the global trading system remain secure, stable, and trustworthy in an increasingly digital world.

GOLD 1H CHART ROUTE MAP UPDATE & TRADING PLAN FOR THE WEEKHey Everyone,
Please see our 1h chart levels and targets for the coming week.
We are seeing price play between two weighted levels with a gap above at 4306 and a gap below at 4270, as support. We will need to see ema5 cross and lock on either weighted level to determine the next range.
We will see levels tested side by side until one of the weighted levels break and lock to confirm direction for the next range.
We will keep the above in mind when taking buys from dips. Our updated levels and weighted levels will allow us to track the movement down and then catch bounces up.
We will continue to buy dips using our support levels taking 20 to 40 pips. As stated before each of our level structures give 20 to 40 pip bounces, which is enough for a nice entry and exit. If you back test the levels we shared every week for the past 24 months, you can see how effectively they were used to trade with or against short/mid term swings and trends.
The swing range give bigger bounces then our weighted levels that's the difference between weighted levels and swing ranges.
BULLISH TARGET
4306
EMA5 CROSS AND LOCK ABOVE 4306 WILL OPEN THE FOLLOWING BULLISH TARGETS
4334
EMA5 CROSS AND LOCK ABOVE 4334 WILL OPEN THE FOLLOWING BULLISH TARGETS
4362
EMA5 CROSS AND LOCK ABOVE 4362 WILL OPEN THE FOLLOWING BULLISH TARGETS
4395
EMA5 CROSS AND LOCK ABOVE 4395 WILL OPEN THE FOLLOWING BULLISH TARGETS
4430
BEARISH TARGETS
4270
EMA5 CROSS AND LOCK BELOW 4270 WILL OPEN THE FOLLOWING BEARISH TARGET
4231
EMA5 CROSS AND LOCK BELOW 4231 WILL OPEN THE FOLLOWING BEARISH TARGET
4184
EMA5 CROSS AND LOCK BELOW 4184 WILL OPEN THE SWING RANGE
4150
4102
As always, we will keep you all updated with regular updates throughout the week and how we manage the active ideas and setups. Thank you all for your likes, comments and follows, we really appreciate it!
Mr Gold
GoldViewFX

GOLD DAILY CHART ROUTE MAPPlease see our Daily chart route map that we are tracking.
Price is currently playing between the longer daily chart range 4259 and 4444, with the channel half-line acting as primary support.
We have a body close above 4259 leaving a long range gap open above at 4444 and will need ema5 lock to further confirm and strengthen this.
This is the beauty of our Goldturn channels, which we draw in our unique way, using averages rather than price. This enables us to identify fake-outs and breakouts clearly, as minimal noise in the way our channels are drawn.
We will use our smaller timeframe analysis on the 1H and 4H chart to buy dips from the weighted Goldturns for 30 to 40 pips clean. Ranging markets are perfectly suited for this type of trading, instead of trying to hold longer positions and getting chopped up in the swings up and down in the range.
We will keep the above in mind when taking buys from dips. Our updated levels and weighted levels will allow us to track the movement down and then catch bounces up using our smaller timeframe ideas.
Our long term bias is Bullish and therefore we look forward to drops from rejections, which allows us to continue to use our smaller timeframes to buy dips using our levels and setups.
Buying dips allows us to safely manage any swings rather then chasing the bull from the top.
Thank you all for your likes, comments and follows, we really appreciate it!
Mr Gold
GoldViewFX

GOLD WEEKLY CHART MID/LONG TERM ROUTE MAPHey everyone,
Please see our weekly chart timeframe Route map and Trading plans for the week ahead.
We are seeing a repeat of the same ranging action again. We still have a long range candle body close gap above at 4294, with 4059 acting as support. We can expect price action to play between these two levels. We now also have EMA5 cross and lock above to strengthen the gap toward 4294. Conversely, a ema5 lock back below 4059 would reopen the broader retracement range.
We’ll keep these long timeframe structures in mind as we continue with our plan to buy dips.
We will keep you all updated as this chart idea unfolds.
Mr Gold

GOLD 4H CHART ROUTE MAP UPDATE & TRADING PLAN FOR THE WEEKHey Everyone,
Please see our 4h chart remaining levels and targets for the coming week with one updated Goldturn.
We are now seeing price play between two weighted levels with a gap above at 4222 and a gap below at 4124. We will need to see ema5 cross and lock on either weighted level to determine the next range.
We will see levels tested side by side until one of the weighted levels break and lock to confirm direction for the next range.
We will keep the above in mind when taking buys from dips. Our updated levels and weighted levels will allow us to track the movement down and then catch bounces up.
We will continue to buy dips using our support levels taking 20 to 40 pips. As stated before each of our level structures give 20 to 40 pip bounces, which is enough for a nice entry and exit. If you back test the levels we shared every week for the past 24 months, you can see how effectively they were used to trade with or against short/mid term swings and trends.
The swing range give bigger bounces then our weighted levels that's the difference between weighted levels and swing ranges.
BULLISH TARGET
4222
EMA5 CROSS AND LOCK ABOVE 4222 WILL OPEN THE FOLLOWING BULLISH TARGET
4328
EMA5 CROSS AND LOCK ABOVE 4328 WILL OPEN THE FOLLOWING BULLISH TARGET
4422
EMA5 CROSS AND LOCK ABOVE 4422 WILL OPEN THE FOLLOWING BULLISH TARGET
4494
BEARISH TARGETS
4131
EMA5 CROSS AND LOCK BELOW 4131 WILL OPEN THE FOLLOWING BEARISH TARGET
4042
EMA5 CROSS AND LOCK BELOW 4042 WILL OPEN THE SWING RANGE
3964
3873
As always, we will keep you all updated with regular updates throughout the week and how we manage the active ideas and setups. Thank you all for your likes, comments and follows, we really appreciate it!
Mr Gold
GoldViewFX

GOLD 1H CHART ROUTE MAP UPDATE & TRADING PLAN FOR THE WEEKHey Everyone,
Please see our 1h chart levels and targets for the coming week, which is still active and in play.
We are seeing price play between two weighted levels with a gap above at 4221 and a gap below at 4169, as support. We will need to see ema5 cross and lock on either weighted level to determine the next range.
We will see levels tested side by side until one of the weighted levels break and lock to confirm direction for the next range.
We will keep the above in mind when taking buys from dips. Our updated levels and weighted levels will allow us to track the movement down and then catch bounces up.
We will continue to buy dips using our support levels taking 20 to 40 pips. As stated before each of our level structures give 20 to 40 pip bounces, which is enough for a nice entry and exit. If you back test the levels we shared every week for the past 24 months, you can see how effectively they were used to trade with or against short/mid term swings and trends.
The swing range give bigger bounces then our weighted levels that's the difference between weighted levels and swing ranges.
BULLISH TARGET
4221
EMA5 CROSS AND LOCK ABOVE 4221 WILL OPEN THE FOLLOWING BULLISH TARGETS
4250
EMA5 CROSS AND LOCK ABOVE 4250 WILL OPEN THE FOLLOWING BULLISH TARGETS
4284
EMA5 CROSS AND LOCK ABOVE 4284 WILL OPEN THE FOLLOWING BULLISH TARGETS
4320
EMA5 CROSS AND LOCK ABOVE 4320 WILL OPEN THE FOLLOWING BULLISH TARGETS
4361
BEARISH TARGETS
4169
EMA5 CROSS AND LOCK BELOW 4169 WILL OPEN THE SWING RANGE
4130
4093
EMA5 CROSS AND LOCK BELOW 4093 WILL OPEN THE SECONDARY SWING RANGE
4049
4015
As always, we will keep you all updated with regular updates throughout the week and how we manage the active ideas and setups. Thank you all for your likes, comments and follows, we really appreciate it!
Mr Gold
GoldViewFX

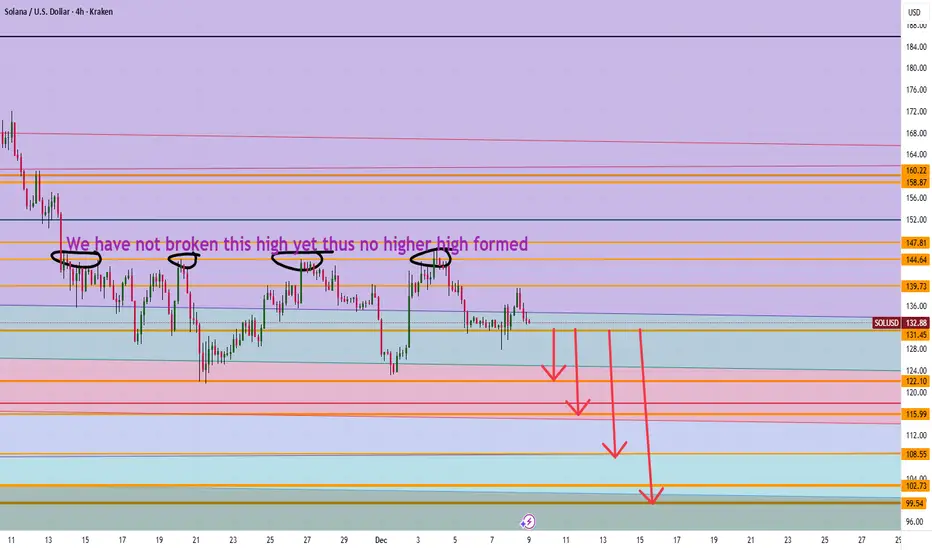
Is Solana heading to $100 It appears we have not made new higher highs in price action on the 4 hour and thus a possible movement down to $108 then 100 levels make sense. However if we can break 139 level then 147 can make sense going up.
Trade Smarter Live Better
Kris
GOLD DAILY CHART ROUTE MAPHey everyone,
Please see our Daily chart route map that we are tracking.
Price is currently playing between the longer daily chart range 4128 and 4259, with the channel half-line acting as support.
We need to see a body close or ema5 cross and lock above or below the weighted levels to confirm the next range. We're also watching for a break above 4259 to confirm a continuation above.
This is the beauty of our Goldturn channels, which we draw in our unique way, using averages rather than price. This enables us to identify fake-outs and breakouts clearly, as minimal noise in the way our channels are drawn.
We will use our smaller timeframe analysis on the 1H and 4H chart to buy dips from the weighted Goldturns for 30 to 40 pips clean. Ranging markets are perfectly suited for this type of trading, instead of trying to hold longer positions and getting chopped up in the swings up and down in the range.
We will keep the above in mind when taking buys from dips. Our updated levels and weighted levels will allow us to track the movement down and then catch bounces up using our smaller timeframe ideas.
Our long term bias is Bullish and therefore we look forward to drops from rejections, which allows us to continue to use our smaller timeframes to buy dips using our levels and setups.
Buying dips allows us to safely manage any swings rather then chasing the bull from the top.
Thank you all for your likes, comments and follows, we really appreciate it!
Mr Gold
GoldViewFX

$META | COVERAGE INITIATED — Personal Position Update [W49]COVERAGE INITIATED — Bullish Classification (Trend Shift Identified)
META — WEEK 49 TREND REPORT | 12/05/2025
Ticker: NASDAQ:META
Timeframe: W
This is a reactive structural classification based on the weekly chart as of this timestamp. Price conditions are evaluated as they stand — nothing here is predictive or forward-assumptive.
⸻
Author’s Note — Personal Position Update
I initiated my own position on [ NASDAQ:META ] during Week [ 49 ], entering at $ [ 673.42 ].
This decision follows my personal criteria: I only participate when my system identifies a verified structural trend shift supported by both a confirmed weekly flag and a qualifying candle state. This note reflects my activity only and is not a suggestion for anyone else.
As of this update, my position is currently up ~ [ 0% ] from my entry.
My structural exit level is $ [ 670.20 ] on a weekly-close basis. This level will continue to adjust upward automatically as the structure strengthens. If price closes below that threshold, my system classifies the trend as structurally compromised, and that is where I personally exit.
This update exists solely to document my own participation and the structural levels I monitor. It is not predictive and does not imply any future outcome.
⸻
Structural Integrity
• 1) Current Trend Condition [ Numbers to Watch ]
• Current Price @ $
• Trend Duration @ +0 Weeks
( Bullish )
• Trend Reversal Level ( Bearish ) @ $
• Trend Reversal Level ( Bearish Confirmation ) @ $
• Pullback Correction Retracement @ $
• Correction Structural Support @ $
⸻
2) Structure Health
• Retracement Phase:
Uptrend (operating above 78.6%)
• Position Status:
Caution (interacting with structural layers)
⸻
3) Temperature :
Warming Phase
⸻
4) Momentum :
Neutral
⸻
Structural Alignment
NEUTRAL STRUCTURAL CONDITION
This mark represents a period where directional behavior was unclear. Market movement here reflected compression, chop, or indecision — neither trend direction was dominant. It does not signal continuation or reversal, only that price action was not showing strong alignment in either direction.
⸻
Methodology Overview
This classification framework evaluates directional conditions using internal trend-interpretation logic that references price behavior relative to its structural layers. These relationships are used to identify when price movement aligns with the framework’s criteria for directional phases, transition points, or regime shifts. Visual elements or structural labels reflect these internal interpretations, rather than explicit trading signals or preset indicator crossovers. This framework is observational only and does not imply future outcomes.

$PLTR | COVERAGE INITIATED — Personal Position Update [W49]COVERAGE INITIATED — Bullish Classification (Trend Shift Identified)
PLTR — WEEK 49 TREND REPORT | 12/05/2025
Ticker: NASDAQ:PLTR
Timeframe: W
This is a reactive structural classification based on the weekly chart as of this timestamp. Price conditions are evaluated as they stand — nothing here is predictive or forward-assumptive.
⸻
Author’s Note — Personal Position Update
I initiated my own position on [ NASDAQ:PLTR ] during Week [ 49 ], entering at $ [ 181.76 ].
This decision follows my personal criteria: I only participate when my system identifies a verified structural trend shift supported by both a confirmed weekly flag and a qualifying candle state. This note reflects my activity only and is not a suggestion for anyone else.
As of this update, my position is currently up ~ [ 0% ] from my entry.
My structural exit level is $ [ 177.54 ] on a weekly-close basis. This level will continue to adjust upward automatically as the structure strengthens. If price closes below that threshold, my system classifies the trend as structurally compromised, and that is where I personally exit.
This update exists solely to document my own participation and the structural levels I monitor. It is not predictive and does not imply any future outcome.
⸻
Structural Integrity
• 1) Current Trend Condition [ Numbers to Watch ]
• Current Price @ $
• Trend Duration @ +0 Weeks
( Bullish )
• Trend Reversal Level ( Bearish ) @ $
• Trend Reversal Level ( Bearish Confirmation ) @ $
• Pullback Retracement @ $
• Correction Support @ $
⸻
2) Structure Health
• Retracement Phase:
Uptrend (operating above 78.6%)
• Position Status:
Healthy (price above both structural layers)
⸻
3) Temperature :
Neutral Phase
⸻
4) Momentum :
Bullish
⸻
Structural Alignment
NEUTRAL STRUCTURAL CONDITION
This mark represents a period where directional behavior was unclear. Market movement here reflected compression, chop, or indecision — neither trend direction was dominant. It does not signal continuation or reversal, only that price action was not showing strong alignment in either direction.
⸻
Methodology Overview
This classification framework evaluates directional conditions using internal trend-interpretation logic that references price behavior relative to its structural layers. These relationships are used to identify when price movement aligns with the framework’s criteria for directional phases, transition points, or regime shifts. Visual elements or structural labels reflect these internal interpretations, rather than explicit trading signals or preset indicator crossovers. This framework is observational only and does not imply future outcomes.

GOLD MARKET UPDATEHey Everyone,
As we close out the week, price action on the 1 hour chart continues to consolidate within the defined Goldturn range between 4193 and 4233. The 4193 weighted Goldturn has held as a structural support level, generating the rebound that carried price back into 4233.
Earlier in the week, we observed a cross and lock above 4233, which leaves the 4275 gap unfilled. This upside inefficiency will remain on our radar as long as price holds above the mid range structure.
We will return Sunday with a full multi-timeframe breakdown and detailed trade tracking plan for the upcoming week.
Mr Gold

GOLD DAILY CHART ROUTE MAPHey everyone,
Please see our updated Daily chart route map with updated levels.
Price is currently playing between the longer daily chart range 4128 and 3980, with the channel half-line acting as support.
If this support holds, we should see a move toward the 4128 target. A body close or ema5 cross and lock below the half-line would open the swing range for a test and bounce. We're also watching for a break above 41238 to confirm a continuation above.
This is the beauty of our Goldturn channels, which we draw in our unique way, using averages rather than price. This enables us to identify fake-outs and breakouts clearly, as minimal noise in the way our channels are drawn.
We will use our smaller timeframe analysis on the 1H and 4H chart to buy dips from the weighted Goldturns for 30 to 40 pips clean. Ranging markets are perfectly suited for this type of trading, instead of trying to hold longer positions and getting chopped up in the swings up and down in the range.
We will keep the above in mind when taking buys from dips. Our updated levels and weighted levels will allow us to track the movement down and then catch bounces up using our smaller timeframe ideas.
Our long term bias is Bullish and therefore we look forward to drops from rejections, which allows us to continue to use our smaller timeframes to buy dips using our levels and setups.
Buying dips allows us to safely manage any swings rather then chasing the bull from the top.
Thank you all for your likes, comments and follows, we really appreciate it!
Mr Gold
GoldViewFX
Q4 | W49 | D1 | Y25 - EURUSD FRGNT DAILY FORECAST POST BREAKDOWN📅 Q4 | W49 | D1 | Y25 |
📊 EURUSD FRGNT DAILY FORECAST
🔍 Analysis Approach:
I’m applying Smart Money Concepts, focusing on:
Identifying Points of Interest on the Higher Time Frames (HTFs) 🕰️
Using those POIs to define a clear trading range 📐
Refining those zones on Lower Time Frames (LTFs) 🔎
Waiting for a Break of Structure (BoS) for confirmation ✅
This method allows me to stay precise, disciplined, and aligned with the market narrative, rather than chasing price.
💡 My Motto:
"Capital management, discipline, and consistency in your trading edge."
A positive risk-to-reward ratio, paired with a high win rate, is the backbone of any solid trading plan 📈🔐
⚠️ Losses?
They’re part of the mathematical game of trading 🎲
They don’t define you — they’re necessary, they happen, and we move forward 📊➡️
🙏 I appreciate you taking the time to review my Daily Forecast.
Stay sharp, stay consistent, and protect your capital
— FRNGT 🚀
FX:EURUSD

XAUUSD / GOLD trade ideaGOLD has just broken above a major level of resistance which has now turned into a support after a retest. An anticipation of a further push to the upside and possibly a push to the next key level. Waiting for the right confirmations to execute

GOLD MONTHLY CHART LONG TERM/RANGE ROUTE MAPHey Everyone,
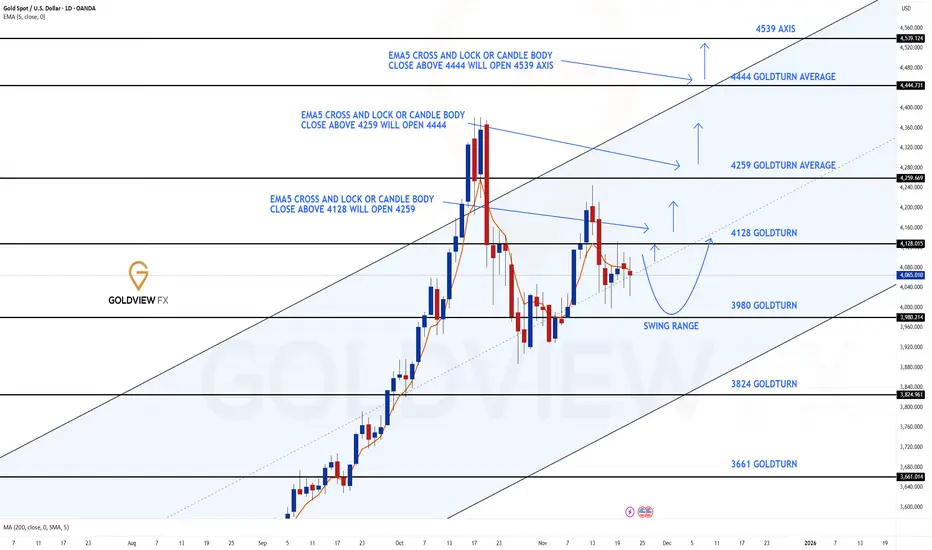
We’ve just released our new Monthly Chart idea, which we’ll now be tracking following the completion of our previous long term monthly chart idea. It’s time to shift focus to the next big setup.
Currently, price is trading above the channel midline, and we’ve also seen a candle body close above 4000 for November month opening a long range gap to 4436 AXIS.
EMA5 cross and lock would further confirm this but its lagging on the longer time frame and therefore not enough time to action if waiting for ema5 confirmation. A candle body close is suffice for us to use to track the levels on this timeframe when EMA5 lags behind.
While the candle body close above 4000 confirms the bullish long term structure, we’re also mindful of the potential for a short term retracement, particularly around the EMA5 detachment zone (highlighted with a circle on the chart). This would offer a healthy dip opportunity, aligning perfectly with our strategy to buy into weakness on the way up.
For the bigger structure to remain intact, we’ll be looking for 4000 to continue holding as key primary structural support. As long as that level is respected, the long term gap toward 4436 remains firmly in play. 3532 remains our secondary structural support, also our swing range inline with the channel half line, providing a long term pivotal structural level of support.
This is a higher timeframe idea that we’ll be building on as structure continues to unfold.
We will continue to use all support structures, across all our multi time frame chart ideas to buy dips also keeping in mind our long term gaps above. Short term we may look bearish but looking at the monthly chart allows us to see the bigger picture and the overall long term Bullish trend.
As always, we will keep you all updated with regular updates throughout the week and how we manage the active ideas and setups. Thank you all for your likes, comments and follows, we really appreciate it!
Mr Gold
GoldViewFX

GOLD 1H CHART ROUTE MAP UPDATE & TRADING PLAN FOR THE WEEKHey Everyone,
Please see our updated 1h chart levels and targets for the coming week.
We are seeing price play between two weighted levels with a gap above at 4100 and a gap below at 4057. We will need to see ema5 cross and lock on either weighted level to determine the next range.
We will see levels tested side by side until one of the weighted levels break and lock to confirm direction for the next range.
We will keep the above in mind when taking buys from dips. Our updated levels and weighted levels will allow us to track the movement down and then catch bounces up.
We will continue to buy dips using our support levels taking 20 to 40 pips. As stated before each of our level structures give 20 to 40 pip bounces, which is enough for a nice entry and exit. If you back test the levels we shared every week for the past 24 months, you can see how effectively they were used to trade with or against short/mid term swings and trends.
The swing range give bigger bounces then our weighted levels that's the difference between weighted levels and swing ranges.
BULLISH TARGET
4100
EMA5 CROSS AND LOCK ABOVE 4100 WILL OPEN THE FOLLOWING BULLISH TARGETS
4140
EMA5 CROSS AND LOCK ABOVE 4140 WILL OPEN THE FOLLOWING BULLISH TARGET
4193
EMA5 CROSS AND LOCK ABOVE 4193 WILL OPEN THE FOLLOWING BULLISH TARGET
4233
EMA5 CROSS AND LOCK ABOVE 4233 WILL OPEN THE FOLLOWING BULLISH TARGET
4275
BEARISH TARGETS
4057
EMA5 CROSS AND LOCK BELOW 4057 WILL OPEN THE FOLLOWING BEARISH TARGET
4016
EMA5 CROSS AND LOCK BELOW 4016 WILL OPEN THE FOLLOWING BEARISH TARGET
3965
EMA5 CROSS AND LOCK BELOW 3965 WILL OPEN THE SWING RANGE
3923
3861
As always, we will keep you all updated with regular updates throughout the week and how we manage the active ideas and setups. Thank you all for your likes, comments and follows, we really appreciate it!
Mr Gold
GoldViewFX
