Eurodollar & Offshore Banking MarketsPart I: The Eurodollar Market
1. What is a Eurodollar?
At its simplest, a Eurodollar is a U.S. dollar-denominated deposit held outside the United States. For example, if a bank in London, Paris, or Hong Kong holds deposits in U.S. dollars, those deposits are Eurodollars.
Key points:
They are not issued by the U.S. Federal Reserve but still represent claims in U.S. dollars.
Despite the name, Eurodollars are not confined to Europe; they can exist in Asia, the Middle East, or the Caribbean.
They emerged as a way for banks and corporations to avoid U.S. regulations on interest rates and reserve requirements.
2. Historical Background
The Eurodollar market traces its origins to the 1950s and Cold War tensions. Several factors contributed:
Soviet Union and U.S. dollars: The USSR, fearing that its U.S. dollar deposits in American banks might be frozen during geopolitical conflicts, moved its dollar holdings to European banks.
U.S. banking regulations: At the time, U.S. banks faced regulations such as Regulation Q, which capped the interest they could pay on deposits. Foreign banks were not subject to these rules, making them more attractive to depositors.
Rise of multinational trade: Post-WWII reconstruction and expanding global trade increased the demand for dollars as the world’s reserve currency.
By the 1960s, London had emerged as the global hub for Eurodollar transactions, giving rise to a powerful offshore dollar market.
3. Growth and Development
From its modest beginnings, the Eurodollar market exploded in size. By the 1980s, it had grown into trillions of dollars, outpacing many domestic financial markets. The reasons for its rapid growth include:
Regulatory arbitrage: Banks outside the U.S. could offer higher interest rates and greater flexibility.
Global trade dominance of the dollar: Oil, commodities, and manufactured goods were priced in U.S. dollars, fueling the need for offshore dollar financing.
Institutional investors: Pension funds, sovereign wealth funds, and corporations used Eurodollars for liquidity and hedging.
Today, the Eurodollar market remains one of the largest financial markets in the world, although it has become less visible due to the rise of new funding channels and regulatory reforms.
4. How the Eurodollar Market Works
Deposits: A corporation, government, or investor deposits U.S. dollars in a non-U.S. bank.
Loans: That bank can then lend those dollars to other entities—governments, corporations, or other banks.
Interbank lending: The Eurodollar market is largely an interbank market, where banks borrow and lend dollars to manage liquidity.
Benchmark rates: For decades, Eurodollar interest rates were benchmarked by LIBOR (London Interbank Offered Rate), which became a global standard until its phase-out in 2023.
5. Importance of the Eurodollar Market
Liquidity source: Provides massive pools of dollar liquidity for international trade and investment.
Financing channel: Enables borrowers outside the U.S. to access dollar funding without dealing directly with U.S. banks.
Influences monetary policy: The Eurodollar market often dilutes the Federal Reserve’s control over dollar liquidity since so much activity occurs offshore.
Global benchmark: Eurodollar rates long influenced bond yields, derivatives, and loan agreements worldwide.
Part II: Offshore Banking Markets
1. What is Offshore Banking?
Offshore banking refers to holding financial accounts or conducting financial transactions in a country other than one’s own—usually in a jurisdiction with favorable tax, secrecy, or regulatory frameworks.
Key features:
Offshore banks are typically located in financial centers like the Cayman Islands, Switzerland, Singapore, Luxembourg, and Panama.
They cater to multinational corporations, wealthy individuals, hedge funds, and even governments.
Offshore banking often overlaps with the Eurodollar market, since many offshore banks hold large U.S. dollar deposits.
2. Why Do Offshore Banking Markets Exist?
The rise of offshore banking is tied to several motivations:
Tax optimization: Offshore centers often have low or zero taxes.
Confidentiality: Many jurisdictions protect account-holder secrecy.
Regulatory flexibility: Offshore markets usually impose fewer restrictions on lending, derivatives, or leverage.
Globalization of finance: Companies and investors prefer jurisdictions with ease of cross-border transfers.
3. Evolution of Offshore Banking
Early roots: Switzerland pioneered offshore banking in the early 20th century with its famous banking secrecy laws.
1960s boom: As global capital flows increased, small island nations like the Cayman Islands, Bermuda, and the Bahamas developed into tax havens.
Modern era: Offshore financial centers now play host to hedge funds, insurance companies, and multinational corporate treasury operations.
4. Offshore Banking Activities
Offshore banks and markets offer a wide range of financial services:
Accepting deposits in multiple currencies (especially U.S. dollars).
Syndicated lending to corporations and governments.
Hosting investment funds (hedge funds, private equity).
Structured finance and derivatives trading.
Tax-efficient corporate structures and trusts.
5. Key Offshore Financial Centers
Cayman Islands: World’s largest hub for hedge funds.
Luxembourg: Center for mutual funds and investment vehicles.
Singapore & Hong Kong: Major Asian offshore centers.
Switzerland: Traditional private banking and wealth management.
Panama & Bermuda: Shipping registries, insurance, and banking.
Part III: Eurodollar and Offshore Banking Interconnection
The Eurodollar market and offshore banking are deeply intertwined:
Dollar dominance: Most offshore banking activity is denominated in U.S. dollars, linking it directly to the Eurodollar system.
Regulatory escape: Both markets developed as ways to escape stricter U.S. or domestic regulations.
Liquidity networks: Offshore banks often use Eurodollar deposits to fund lending and investment activities.
Shadow banking overlap: Many offshore banking activities resemble “shadow banking,” operating outside traditional regulatory oversight.
For example:
A hedge fund in the Cayman Islands may borrow Eurodollars from a London-based bank to finance a leveraged trade.
A corporation might use offshore subsidiaries to issue Eurodollar bonds and avoid domestic capital controls.
Part IV: Benefits and Risks
Benefits
Global liquidity: Eurodollars and offshore markets provide deep pools of capital.
Efficient financing: Corporations and governments can raise money at competitive rates.
Flexibility: Offshore markets are often more innovative and less constrained.
Reserve diversification: Countries can park dollar reserves outside the U.S. financial system.
Risks
Regulatory blind spots: Lack of oversight can lead to instability.
Systemic risk: Eurodollar funding shortages have triggered crises (e.g., 2008 global financial crisis).
Tax evasion & illicit finance: Offshore banking is often linked to money laundering and tax havens.
Monetary policy leakage: The Federal Reserve cannot fully control dollar liquidity abroad.
Part V: Case Studies
1. The 2008 Financial Crisis
During the crisis, global banks faced a shortage of dollar liquidity. Many European banks, heavily reliant on Eurodollar funding, found themselves unable to roll over short-term borrowing. The Federal Reserve had to establish swap lines with foreign central banks to provide emergency dollars—showing how central offshore dollar markets are to global stability.
2. LIBOR Scandal
For decades, Eurodollar deposits set the LIBOR benchmark rate. In the 2010s, scandals revealed manipulation by major banks, undermining trust and leading to LIBOR’s replacement with alternative benchmarks (e.g., SOFR in the U.S.).
3. Panama Papers & Offshore Secrecy
The 2016 Panama Papers leak exposed how corporations, politicians, and wealthy individuals used offshore structures to hide wealth, evade taxes, or launder money. It highlighted the dark side of offshore banking markets.
Part VI: The Future of Eurodollars and Offshore Banking
Shift to digital currencies: Central Bank Digital Currencies (CBDCs) could reshape offshore markets by offering direct alternatives to Eurodollars.
Greater regulation: International pressure is increasing on tax havens and offshore secrecy jurisdictions.
Continued dollar dominance: Despite talk of “de-dollarization,” the Eurodollar system remains deeply entrenched in global finance.
Asia’s rise: Offshore centers in Singapore and Hong Kong are expected to play an even larger role in the future.
Conclusion
The Eurodollar and offshore banking markets are the invisible arteries of global finance. They emerged from the need to bypass restrictions and optimize global capital flows, but over time, they became fundamental pillars of the world economy.
On one hand, they provide liquidity, efficiency, and flexibility for international trade and investment. On the other, they pose serious challenges: regulatory blind spots, risks to financial stability, and opportunities for illicit financial activities.
As the global economy evolves—with digital finance, geopolitical shifts, and regulatory changes—the role of Eurodollars and offshore banking will also transform. Yet, their core purpose—channeling capital across borders—will ensure they remain central to the world’s financial system.
Tradingideas

Petrodollar & Oil Trade Mechanisms1. Origins of the Petrodollar System
1.1 Oil and the Bretton Woods Order
After World War II, the Bretton Woods Agreement (1944) created a global financial system where most currencies were pegged to the U.S. dollar, and the dollar itself was pegged to gold at $35 per ounce. This made the dollar the cornerstone of world trade. Since oil was becoming a critical global resource, it naturally started being priced in dollars.
1.2 The Collapse of Bretton Woods
In 1971, President Richard Nixon ended the convertibility of the dollar to gold. This “Nixon Shock” meant the U.S. dollar was no longer backed by gold, leading to concerns about its stability. At the same time, oil demand was booming worldwide, and the U.S. needed a way to preserve the dollar’s dominance.
1.3 U.S.–Saudi Deal and Birth of Petrodollars
In 1974, the U.S. struck a historic deal with Saudi Arabia, the world’s largest oil exporter and de facto leader of OPEC (Organization of Petroleum Exporting Countries). The agreement included:
Saudi Arabia pricing its oil exclusively in U.S. dollars.
Investing surplus revenues in U.S. Treasury securities and financial markets.
In return, the U.S. provided military protection and security guarantees.
Other OPEC members followed suit. This was the birth of the petrodollar system, where oil exports globally were priced and traded in U.S. dollars. The result: demand for dollars surged worldwide, cementing the U.S. currency as the world’s reserve currency.
2. How the Petrodollar System Works
2.1 Dollar-Denominated Oil
Under the petrodollar system, any country wishing to buy oil must first acquire U.S. dollars. This creates constant global demand for dollars, ensuring its strength and liquidity in foreign exchange markets.
2.2 Recycling of Petrodollars
Oil-exporting nations like Saudi Arabia, Kuwait, and the UAE generate huge dollar revenues. These dollars are then recycled in two ways:
Investment in U.S. assets: Treasuries, bonds, real estate, and equities.
Loans to developing countries: Petrodollar surpluses often flow into global banks, which lend them to countries in need of capital.
This cycle—oil buyers purchasing dollars, exporters reinvesting dollars—sustains global financial flows.
2.3 U.S. Strategic Advantage
Because oil trade requires dollars, the U.S. enjoys unique privileges:
Ability to run persistent trade deficits without collapsing currency value.
Financing government spending through foreign purchases of U.S. debt.
Strengthening its geopolitical influence by controlling financial channels linked to the dollar.
In essence, the petrodollar acts as a form of “hidden tax” on the world, since global demand for dollars supports U.S. economic power.
3. Oil Trade Mechanisms in Practice
3.1 Global Oil Markets
Oil is traded in both physical markets and futures markets:
Physical market: Actual crude is bought and sold, usually under long-term contracts or spot deals.
Futures market: Contracts on exchanges (like NYMEX or ICE) allow traders to speculate or hedge against oil price movements.
Both markets are dominated by U.S. dollar pricing benchmarks such as:
WTI (West Texas Intermediate) – benchmark for U.S. oil.
Brent Crude – benchmark for international oil trade.
3.2 Shipping & Logistics
Oil trade relies heavily on maritime transport. Tanker routes like the Strait of Hormuz, Suez Canal, and Strait of Malacca are chokepoints critical to supply. Insurance, shipping contracts, and freight charges also link back to dollar-based systems.
3.3 Role of OPEC and Non-OPEC Producers
OPEC, founded in 1960, has historically coordinated oil output to influence prices. But newer players like Russia, the U.S. (via shale oil), and Brazil also play major roles. Despite these shifts, the dollar remains the settlement currency.
3.4 Derivatives and Financialization
Beyond physical barrels, oil is increasingly a financial asset. Banks, hedge funds, and institutional investors use futures, options, and swaps to speculate or manage risk. The fact that all these instruments are denominated in dollars further entrenches the petrodollar.
4. Geopolitical Implications of the Petrodollar
4.1 Dollar Hegemony
The petrodollar is a cornerstone of U.S. financial dominance. Control over oil trade means:
U.S. sanctions become extremely powerful (cutting nations off from dollar-based transactions).
Countries are incentivized to hold dollar reserves.
American banks and financial institutions dominate global capital flows.
4.2 Middle East Politics
The U.S.–Saudi alliance is at the heart of the petrodollar system. U.S. military presence in the Middle East has often been tied to protecting oil flows and ensuring dollar-denominated trade.
4.3 Wars and Petrodollar Resistance
Countries that attempted to bypass the petrodollar often faced geopolitical pushback:
Iraq (2000): Saddam Hussein switched oil sales to euros. The U.S. invasion in 2003 reversed this.
Libya (2010): Muammar Gaddafi proposed a gold-backed African dinar for oil. NATO intervention soon followed.
Iran: Has long sought to sell oil in euros, yuan, or barter arrangements, facing heavy U.S. sanctions.
4.4 Rise of China and Yuan Internationalization
China, the world’s largest oil importer, has pushed for alternative arrangements:
Launching Shanghai crude oil futures denominated in yuan.
Signing oil-for-yuan agreements with Russia, Iran, and others.
Promoting the “petroyuan” as a challenger to the petrodollar.
5. Economic Effects of the Petrodollar System
5.1 On the U.S.
Benefits: Cheap financing, stronger global financial role, ability to run deficits.
Risks: Overreliance on dollar demand can mask structural weaknesses in U.S. manufacturing and trade.
5.2 On Oil Exporters
Oil-rich nations earn vast revenues, but dependence on dollars ties them to U.S. monetary policy. Petrodollar inflows can also create “Dutch Disease”—overdependence on oil revenues at the expense of other sectors.
5.3 On Importing Countries
Nations must secure dollars to pay for oil. This can create vulnerability during dollar shortages, especially in developing countries, leading to debt crises (e.g., Latin America in the 1980s).
5.4 On Global Finance
Petrodollar recycling has fueled global liquidity. But when oil prices collapse, dollar inflows shrink, causing volatility in emerging markets and banking systems.
6. Challenges to the Petrodollar System
6.1 Shift Toward Multipolarity
The world is moving toward multipolar finance, with alternatives like:
Petroyuan (China).
Digital currencies and blockchain settlements.
Barter systems (oil-for-goods agreements).
6.2 U.S. Sanctions Overuse
While sanctions are a powerful tool, their frequent use pushes countries to seek alternatives to dollar-based trade. Russia, Iran, and Venezuela are examples of nations turning to non-dollar settlements.
6.3 Renewable Energy Transition
As the world moves toward renewable energy and electric vehicles, long-term oil demand may decline. This could erode the centrality of the petrodollar in the global system.
6.4 De-dollarization Movements
Countries like BRICS members (Brazil, Russia, India, China, South Africa) are actively promoting alternatives to dollar dominance. The creation of BRICS financial frameworks could reduce reliance on the petrodollar.
Conclusion
The petrodollar system has been one of the most powerful and enduring mechanisms in the modern global economy. It links the world’s most traded commodity—oil—to the U.S. dollar, reinforcing American financial dominance for nearly five decades. Oil trade mechanisms, whether through physical barrels, futures contracts, or financial derivatives, all flow through this system, shaping the destiny of nations.
However, the petrodollar is not invincible. Geopolitical rivalries, overuse of U.S. sanctions, the rise of China, and the gradual energy transition toward renewables are all eroding its absolute dominance. While the dollar is unlikely to lose its central role overnight, the world is clearly moving toward a more multipolar currency system for energy trade.
The story of the petrodollar is not just about oil or money—it is about power, politics, and the architecture of the global economy. Its future will depend on how nations navigate energy transitions, financial innovations, and geopolitical shifts in the decades to come.

GOLD ROUTE MAP UPDATEHey Everyone,
Great start to the week with our 1H chart idea playing out as analysed.
We started with our Bullish target 3653 being hit, followed with emA5 cross and lock opening 3678 - This was also hit perfectly completing the setup.
We will now look for a ema56 cross and lock above 3678 for a continuation into 3702 or failure to lock above 3678 will follow with a rejection into the lower Goldturns for support and bounce.
We will keep the above in mind when taking buys from dips. Our updated levels and weighted levels will allow us to track the movement down and then catch bounces up.
We will continue to buy dips using our support levels taking 20 to 40 pips. As stated before each of our level structures give 20 to 40 pip bounces, which is enough for a nice entry and exit. If you back test the levels we shared every week for the past 24 months, you can see how effectively they were used to trade with or against short/mid term swings and trends.
The swing range give bigger bounces then our weighted levels that's the difference between weighted levels and swing ranges.
BULLISH TARGET
3653 - DONE
EMA5 CROSS AND LOCK ABOVE 3653 WILL OPEN THE FOLLOWING BULLISH TARGETS
3678 - DONE
EMA5 CROSS AND LOCK ABOVE 3678 WILL OPEN THE FOLLOWING BULLISH TARGET
3702
EMA5 CROSS AND LOCK ABOVE 3702 WILL OPEN THE FOLLOWING BULLISH TARGET
3727
EMA5 CROSS AND LOCK ABOVE 3727 WILL OPEN THE FOLLOWING BULLISH TARGET
3747
EMA5 CROSS AND LOCK ABOVE 3747 WILL OPEN THE FOLLOWING BULLISH TARGET
3768
BEARISH TARGETS
3622
EMA5 CROSS AND LOCK BELOW 3622 WILL OPEN THE FOLLOWING BEARISH TARGET
3585
EMA5 CROSS AND LOCK BELOW 3585 WILL OPEN THE SWING RANGE
3556
3528
As always, we will keep you all updated with regular updates throughout the week and how we manage the active ideas and setups. Thank you all for your likes, comments and follows, we really appreciate it!
Mr Gold
GoldViewFX

Bitcoin Short Opportunity Before the Next Leg UpBitcoin is currently showing noticeable weakness in buying momentum.
Most likely, it will drop to the 113K–112K area to retest before moving higher again.
✅ My Personal Strategy:
Entry (Sell): 115,600
🎯 Target 1: 114,000
🎯Target 2: 113,600
Stop-Loss: Daily close above 117,400
Please note:
This is not financial advice – I’m only sharing my personal trades.
Always do your own research before taking action.
👍 Don’t forget to like if you found this useful, and feel free to follow me for more analysis of this kind.
Best of luck 🌹

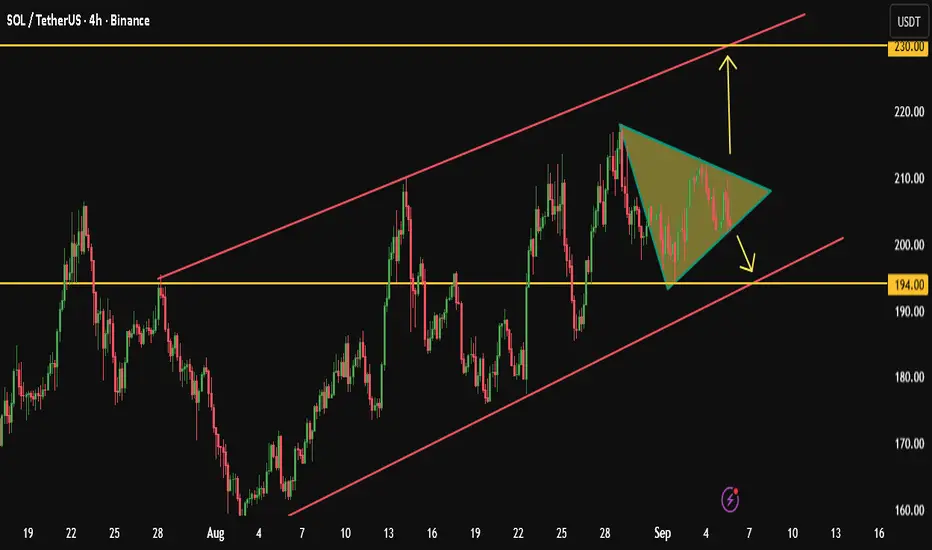
SOL inside ascending triangle,breakout will define the next moveCurrently, SOL price is consolidating within a symmetrical triangle pattern inside an ascending channel.
A breakout in either direction will determine the next move, towards 230 if it breaks upward, or towards 194 if it breaks downward.
As shown on the chart, Solana has been moving within an ascending channel since late July.
At the moment, a Symmetrical Triangle is forming, and volatility is tightening inside the pattern.
This suggests that a breakout move is imminent, most likely within the coming days (up to a week).
If price breaks to the upside:
potential move towards the upper boundary of the channel around 230.
If price breaks to the downside:
potential decline towards the lower boundary of the channel around 194.
Let’s watch closely for the breakout confirmation.
Best regards 🌹
please note :
this is not financial advice — it reflects only my personal opinion.
PLEASE always do your own research before trading .. Good luck with your trades.
GOLD 1H CHART ROUTE MAP UPDATE & TRADING PLAN FOR THE WEEKHey Everyone,
Please see our updated 1h chart levels and targets for the coming week.
We are seeing price play between two weighted levels with a gap above at 3653 and a gap below at 3622. We will need to see ema5 cross and lock on either weighted level to determine the next range.
We will see levels tested side by side until one of the weighted levels break and lock to confirm direction for the next range.
We will keep the above in mind when taking buys from dips. Our updated levels and weighted levels will allow us to track the movement down and then catch bounces up.
We will continue to buy dips using our support levels taking 20 to 40 pips. As stated before each of our level structures give 20 to 40 pip bounces, which is enough for a nice entry and exit. If you back test the levels we shared every week for the past 24 months, you can see how effectively they were used to trade with or against short/mid term swings and trends.
The swing range give bigger bounces then our weighted levels that's the difference between weighted levels and swing ranges.
BULLISH TARGET
3653
EMA5 CROSS AND LOCK ABOVE 3653 WILL OPEN THE FOLLOWING BULLISH TARGETS
3678
EMA5 CROSS AND LOCK ABOVE 3678 WILL OPEN THE FOLLOWING BULLISH TARGET
3702
EMA5 CROSS AND LOCK ABOVE 3702 WILL OPEN THE FOLLOWING BULLISH TARGET
3727
EMA5 CROSS AND LOCK ABOVE 3727 WILL OPEN THE FOLLOWING BULLISH TARGET
3747
EMA5 CROSS AND LOCK ABOVE 3747 WILL OPEN THE FOLLOWING BULLISH TARGET
3768
BEARISH TARGETS
3622
EMA5 CROSS AND LOCK BELOW 3622 WILL OPEN THE FOLLOWING BEARISH TARGET
3585
EMA5 CROSS AND LOCK BELOW 3585 WILL OPEN THE SWING RANGE
3556
3528
As always, we will keep you all updated with regular updates throughout the week and how we manage the active ideas and setups. Thank you all for your likes, comments and follows, we really appreciate it!
Mr Gold
GoldViewFX

GOLD 4H CHART ROUTE MAP UPDATE & TRADING PLAN FOR THE WEEKHey Everyone,
Please see our updated 4h chart levels and targets for the coming week.
We are seeing price play between two weighted levels with a gap above at 3655 and a gap below at 3615. We will need to see ema5 cross and lock on either weighted level to determine the next range.
We will see levels tested side by side until one of the weighted levels break and lock to confirm direction for the next range.
We will keep the above in mind when taking buys from dips. Our updated levels and weighted levels will allow us to track the movement down and then catch bounces up.
We will continue to buy dips using our support levels taking 20 to 40 pips. As stated before each of our level structures give 20 to 40 pip bounces, which is enough for a nice entry and exit. If you back test the levels we shared every week for the past 24 months, you can see how effectively they were used to trade with or against short/mid term swings and trends.
The swing range give bigger bounces then our weighted levels that's the difference between weighted levels and swing ranges.
BULLISH TARGET
3655
EMA5 CROSS AND LOCK ABOVE 3655 WILL OPEN THE FOLLOWING BULLISH TARGETS
3696
EMA5 CROSS AND LOCK ABOVE 3696 WILL OPEN THE FOLLOWING BULLISH TARGET
3738
BEARISH TARGETS
3615
EMA5 CROSS AND LOCK BELOW 3615 WILL OPEN THE FOLLOWING BEARISH TARGET
3583
EMA5 CROSS AND LOCK BELOW 3583 WILL OPEN THE FOLLOWING BEARISH TARGET
3545
EMA5 CROSS AND LOCK BELOW 3545 WILL OPEN THE FOLLOWING BEARISH TARGET
3509
EMA5 CROSS AND LOCK BELOW 3509 WILL OPEN THE SWING RANGE
3458
3409
EMA5 CROSS AND LOCK BELOW 3409 WILL OPEN THE SECONDARY SWING RANGE
3360
3320
As always, we will keep you all updated with regular updates throughout the week and how we manage the active ideas and setups. Thank you all for your likes, comments and follows, we really appreciate it!
Mr Gold
GoldViewFX

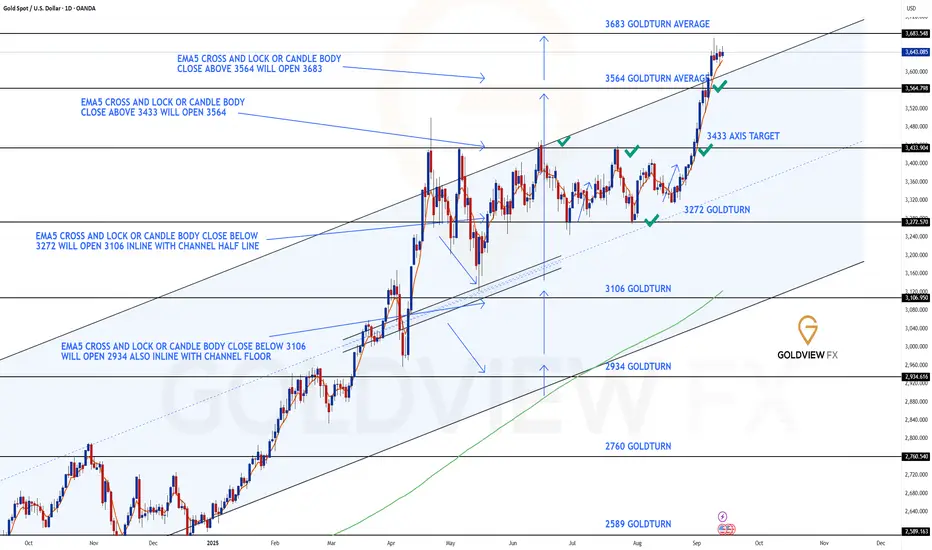
GOLD DAILY CHART ROUTE MAPDaily Chart Update
3564 Target Hit, Fresh Gap at 3683 & Breakout Confirmation
As projected in our previous update, the 3564 target has now been reached perfectly following EMA5 lock confirmation above 3433. This milestone completes the initial breakout structure and validates the bullish momentum sequence laid out earlier.
With 3564 achieved, price action has now opened a long-range gap toward 3683. The EMA5 cross and lock above 3564 provides strong continuation evidence, but we must now monitor whether support can be sustained above the channel top. A successful hold here will confirm continuation higher; however, a break back within the channel would classify this as a fake breakout attempt.
Current Outlook
🔹 3564 Target Reached
Upside momentum played out as expected, with EMA5 lock above 3433 providing early confirmation. The move delivered a clean hit of the 3564 target zone.
🔹 Next Objective – 3683
Momentum now extends toward 3683, with EMA5 lock above 3564 giving weight to this projection. Sustaining price above the channel top remains crucial to validating the next leg higher.
🔹 Breakout Validation Needed
Continuation depends on maintaining support above channel resistance. Failure to hold here risks invalidating the breakout and shifting price back into the prior range.
Updated Key Levels
📉 Support – 3272 (pivotal floor)
📉 Short-Term Supports – 3433 & 3564
📈 Resistance / Next Upside Objective – 3683
Thanks as always for your continued support,
Mr Gold
GoldViewFX
GOLD WEEKLY CHART MID/LONG TERM ROUTE MAPWeekly Chart Update
3659 Target Achieved, Rejection at 3659 & now Range Play Between Key Levels
As projected, price delivered into the 3659 target after securing a weekly body close above 3576, just as anticipated. This completed the next upside step in sequence.
However, despite momentum into 3659, we did not see a candle body close and EMA5 lock above this level. The lack of confirmation left a rejection in place, establishing 3659 as firm resistance while 3576 now acts as immediate support. Price action is currently playing within this range, and a decisive break above or below will determine the next directional move.
Current Outlook
🔹 3659 Target Achieved
The weekly structure unfolded exactly as expected, with the 3576 breakout leading to a clean push into 3659.
🔹 Rejection at 3659
No body close above 3659 leaves this level as strong resistance for now. Without lock confirmation, bullish continuation into 3732 remains unconfirmed.
🔹 Range Play Between 3659 & 3576
We now look for a confirmed break above 3659 to unlock 3732, or a breakdown below 3576 that would risk pulling price back into the prior channel range.
Updated Levels to Watch
📉 Support – 3576 & 3482
Key floors for maintaining bullish structure. A break back below 3576 puts 3482 in play as the next test.
📈 Resistance – 3659 / Next Objective 3732
3659 remains the ceiling. A sustained close above here opens 3732 as the next target zone.
Plan
Price is consolidating between 3659 resistance and 3576 support. The next move depends on which boundary breaks:
Above 3659: Unlocks 3732 with bullish continuation.
Below 3576: Signals rejection and risks a deeper correction into 3482.
Thanks as always for your support,
Mr Gold
GoldViewFX

Why Forex Reserves Matter in Trading1. What Are Forex Reserves?
Forex reserves are assets held by a nation’s central bank in foreign currencies, precious metals like gold, Special Drawing Rights (SDRs) from the International Monetary Fund (IMF), and other reserve assets. These reserves are not just passive holdings; they are active instruments used for monetary policy, currency stabilization, and ensuring global payment obligations.
Key Components of Forex Reserves
Foreign Currencies – Typically held in USD, EUR, JPY, GBP, and increasingly CNY.
Gold Holdings – A traditional hedge against inflation and currency risk.
SDRs (Special Drawing Rights) – An IMF-backed reserve asset that supplements official reserves.
IMF Reserve Position – Access to IMF funding if needed.
2. Why Countries Accumulate Forex Reserves
Stability in Currency Markets
Countries need reserves to intervene in forex markets to prevent excessive volatility in their domestic currency.
Confidence for International Trade
Exporters and importers prefer dealing with countries that can guarantee payment stability.
Debt Servicing
Reserves allow governments to service foreign debt obligations without defaulting.
Buffer Against Economic Shocks
Acts as insurance against sudden capital flight, trade imbalances, or geopolitical crises.
Support for Sovereign Credit Ratings
Higher reserves improve investor confidence and reduce borrowing costs.
3. Importance of Forex Reserves in Global Trading
3.1 Stabilizing Currency Values
A currency’s exchange rate plays a central role in trade competitiveness. For example, if the Indian Rupee depreciates too rapidly, imports like oil and electronics become expensive. The Reserve Bank of India (RBI) can sell USD from its reserves to supply dollars in the forex market, stabilizing the rupee.
3.2 Controlling Inflation
Imported inflation is a major risk for countries dependent on foreign goods. By using reserves to maintain a stable currency, central banks reduce inflationary pressures, which directly impacts stock and bond markets.
3.3 Investor Confidence
High reserves attract foreign institutional investors (FIIs) because they see lower risk of capital restrictions. Conversely, low reserves signal vulnerability, causing capital flight.
3.4 Crisis Management
During the 1997 Asian Financial Crisis, countries with low reserves like Thailand suffered massive currency collapses, while nations with higher reserves recovered faster.
4. How Forex Reserves Impact Trading Across Markets
4.1 Currency Trading (Forex Markets)
Traders closely monitor reserve levels to predict central bank interventions.
A rise in reserves indicates strong capital inflows or trade surpluses, usually strengthening the currency.
A fall in reserves may mean heavy intervention to defend the domestic currency, creating volatility.
4.2 Equity Markets
Strong reserves signal economic resilience, attracting long-term investments.
For export-driven companies, reserve usage can stabilize currency swings, reducing earnings risk.
4.3 Bond Markets
Nations with healthy reserves are seen as safer borrowers.
Sovereign bond yields fall when reserves are high, lowering borrowing costs.
4.4 Commodity Trading
Forex reserves influence global demand for commodities. For example, when China builds reserves, it often buys U.S. Treasuries and commodities, boosting global demand.
Gold prices also respond directly to central bank reserve diversification strategies.
5. Case Studies: Forex Reserves and Trading Dynamics
5.1 China
Holds the world’s largest reserves (over $3 trillion).
Uses reserves to keep the yuan stable, ensuring export competitiveness.
Global traders watch China’s reserve reports to gauge trade and commodity flows.
5.2 India
As of 2025, India’s reserves are above $650 billion.
Provides a cushion against oil import costs and FII outflows.
Traders interpret rising Indian reserves as bullish for the rupee and equity markets.
5.3 Russia (Post-Sanctions)
Sanctions froze Russia’s dollar reserves in 2022.
Moscow shifted to gold and yuan, changing global reserve composition.
Traders saw sharp volatility in ruble trading due to limited access to USD reserves.
6. Forex Reserves as a Trading Indicator
For traders, reserves serve as a leading indicator of currency and capital flow trends.
Rising Reserves: Suggests export growth, capital inflows, and stable currency → bullish sentiment.
Falling Reserves: Signals interventions, capital flight, or trade deficits → bearish sentiment.
Traders often combine reserve data with:
Balance of Payments (BoP) reports
Capital account movements
Central bank policy signals
7. Risks of Over-Reliance on Reserves
While reserves are critical, there are risks:
Opportunity Cost – Funds invested in low-yield assets like U.S. Treasuries could have been used domestically.
Geopolitical Risk – Sanctions can freeze reserves held abroad.
Currency Depreciation of Reserve Assets – Holding too many USD assets can hurt if the dollar weakens.
False Security – Excessive reliance may delay structural economic reforms.
8. Future of Forex Reserves in Global Trading
Shift Toward Gold & Yuan – Central banks are diversifying away from the USD.
Digital Reserves (CBDCs) – Future reserves may include digital currencies issued by central banks.
Geopolitical Weaponization of Reserves – The Russia-Ukraine war highlighted how reserves can be frozen, making diversification essential.
AI and Data-Driven Reserve Management – Advanced analytics will improve reserve allocation strategies.
9. Lessons for Traders and Investors
Currency traders should track reserve levels as part of fundamental analysis.
Equity investors should see reserves as a buffer against volatility.
Bond traders should link reserves with sovereign credit risk.
Commodity traders should monitor how reserve diversification affects gold and oil demand.
Conclusion
Forex reserves are not just a financial cushion for governments; they are a critical trading signal that reflects a country’s economic health, ability to withstand crises, and global credibility. From stabilizing exchange rates to influencing global capital flows, reserves touch every corner of financial markets.
For traders, understanding the dynamics of reserves means being able to anticipate currency movements, equity flows, bond yields, and commodity prices with greater accuracy. In a world of heightened volatility, forex reserves remain one of the most powerful forces shaping international trade and financial stability.
Floating vs. Pegged Exchange Rates in the Global MarketUnderstanding Exchange Rate Systems
1. Floating Exchange Rate
A floating exchange rate (also called a flexible exchange rate) is determined primarily by the free interaction of demand and supply in the forex market. Governments and central banks may intervene occasionally to smooth out volatility, but fundamentally, market forces dictate the price.
For example:
If global investors demand more U.S. dollars for trade or investment, the dollar appreciates.
If demand weakens, the dollar depreciates.
Countries like the United States, Japan, the Eurozone, Canada, and the UK operate under floating exchange rate regimes.
2. Pegged Exchange Rate
A pegged or fixed exchange rate system involves a government or central bank fixing its currency’s value relative to another “anchor” currency, often the U.S. dollar or the euro. This peg is maintained through direct intervention in forex markets or monetary policy adjustments.
For instance:
Hong Kong pegs the Hong Kong dollar to the U.S. dollar at a fixed rate of around 7.8 HKD/USD.
Saudi Arabia pegs the riyal to the dollar, ensuring stability for its oil exports priced in USD.
Pegged systems can be hard pegs (currency board arrangements or dollarization) or soft pegs (adjustable or crawling pegs).
Historical Context
The Gold Standard (1870s–1914)
Currencies were pegged to gold at a fixed rate. This ensured global stability but limited monetary flexibility.
Bretton Woods System (1944–1971)
After WWII, countries pegged their currencies to the U.S. dollar, which itself was convertible into gold at $35/ounce. The system collapsed in 1971 when the U.S. suspended dollar-gold convertibility, paving the way for floating exchange rates.
Post-1970s Era
Most advanced economies adopted floating exchange rates, while developing countries often retained pegged systems to ensure stability.
Mechanisms of Floating vs. Pegged
Floating Exchange Rate Mechanism
Market Driven: Currency value fluctuates daily based on demand/supply.
Determinants: Trade balance, interest rate differentials, inflation, speculation, capital flows.
Volatility: High sensitivity to market news, geopolitical events, and investor sentiment.
Pegged Exchange Rate Mechanism
Official Fix: Government declares a fixed parity with another currency.
Central Bank Role: Uses reserves of foreign currency to buy/sell its own currency to defend the peg.
Policy Trade-off: Sacrifices independent monetary policy for stability.
Advantages & Disadvantages
Floating Exchange Rates
Advantages:
Automatic Adjustment – Trade imbalances are corrected naturally. A deficit leads to currency depreciation, making exports cheaper and imports costlier, restoring balance.
Monetary Independence – Central banks can use interest rates for domestic goals (inflation, growth).
Shock Absorption – Floating currencies can absorb external shocks like oil price fluctuations.
No Need for Reserves – Less dependence on large forex reserves.
Disadvantages:
Volatility – Exchange rates can swing dramatically, hurting exporters/importers.
Speculative Attacks – Vulnerable to speculative flows and sudden capital flight.
Imported Inflation – A weaker currency raises import costs.
Uncertainty in Trade – Businesses face risks in cross-border contracts.
Pegged Exchange Rates
Advantages:
Stability – Predictable exchange rates encourage trade, investment, and confidence.
Inflation Control – Pegging to a stable currency (like the USD) can anchor inflation expectations.
Investor Confidence – Reduces currency risk, attracting foreign capital.
Economic Integration – Helps small, open economies integrate into global markets.
Disadvantages:
Loss of Monetary Policy Independence – Central banks cannot freely adjust interest rates.
Risk of Currency Crisis – Maintaining a peg under speculative attack can deplete reserves (e.g., Asian Financial Crisis, 1997).
Distorted Trade Balances – Pegs can create artificial competitiveness or overvaluation.
Cost of Reserves – Countries must hold massive forex reserves to defend the peg.
Global Case Studies
Floating Exchange Rate Examples
United States (USD) – The dollar floats freely, driven by capital flows, interest rate policies of the Federal Reserve, and global demand for safe assets. Despite volatility, it remains the world’s reserve currency.
Eurozone (EUR) – The euro floats against global currencies. The European Central Bank targets inflation, not exchange rate levels, showcasing independence.
Japan (JPY) – Historically intervened to weaken the yen to support exporters but maintains a floating regime.
Pegged Exchange Rate Examples
Hong Kong Dollar (HKD) – Pegged to USD since 1983 at ~7.8. The currency board system ensures credibility but ties Hong Kong’s interest rates to U.S. policy.
Saudi Riyal (SAR) – Pegged to USD to stabilize oil trade revenues. Provides certainty but makes the economy vulnerable to U.S. monetary policy shifts.
China (CNY) – Historically pegged to USD, now operates a managed float. The People’s Bank of China intervenes to guide the yuan’s value, balancing trade competitiveness and stability.
Argentina (1990s) – Pegged peso to USD at 1:1 to fight hyperinflation. Initially successful but collapsed in 2001 due to unsustainable debt and loss of competitiveness.
Impact on Global Markets
Trade Flows
Floating currencies allow natural adjustment, promoting fair competition.
Pegged currencies provide certainty but may lead to trade distortions if misaligned.
Capital Flows & Investment
Stability of pegged systems attracts FDI but risks sudden collapse.
Floating regimes can deter investment due to volatility, though hedging instruments mitigate this.
Financial Stability
Pegged regimes are prone to speculative crises (e.g., Thailand 1997, UK’s “Black Wednesday” 1992).
Floating systems face volatility but rarely collapse outright.
Global Imbalances
Persistent pegs (e.g., China’s undervalued yuan in early 2000s) contribute to global trade imbalances, fueling disputes with trading partners.
Future Trends
Rise of Managed Floats – Pure floats and hard pegs are rare. Most countries adopt intermediate systems for balance.
Digital Currencies & Exchange Rates – Central Bank Digital Currencies (CBDCs) could change how pegs/floats operate in practice.
Multipolar Currency World – As China, India, and others gain influence, multiple anchor currencies may coexist, complicating peg strategies.
Geopolitical Pressures – Sanctions, capital controls, and global fragmentation will influence exchange rate choices.
Conclusion
Floating and pegged exchange rates represent two ends of a spectrum in international monetary policy. Floating systems emphasize market freedom, flexibility, and autonomy, while pegged systems prioritize stability, predictability, and investor confidence. Both have strengths and vulnerabilities, and their suitability depends on a country’s economic structure, development stage, and integration with global markets.
In today’s interconnected world, a majority of nations operate hybrid or managed float systems, reflecting the need for both stability and adaptability. As global trade, digital finance, and geopolitical dynamics evolve, the debate between floating and pegged exchange rates will remain central to discussions on international economic governance.
Role of SWIFT in Cross-Border Payments1. The Origins of SWIFT
1.1 The Pre-SWIFT Era
Before SWIFT, banks relied heavily on telex messages to transmit payment instructions. Telex systems were slow, error-prone, lacked standardized formats, and required human intervention to decode and re-key messages. This often resulted in delays, fraud, and disputes in cross-border settlements.
By the early 1970s, with international trade booming, the shortcomings of telex became unsustainable. Leading banks realized the need for a global, standardized, automated, and secure communication system.
1.2 Founding of SWIFT
In 1973, 239 banks from 15 countries established SWIFT as a cooperative society headquartered in Brussels, Belgium. The goal was to build a shared platform for financial messaging, independent of any single nation or commercial entity. By 1977, SWIFT was operational with 518 member institutions across 22 countries.
2. What SWIFT Does
2.1 Messaging, Not Money Movement
A common misconception is that SWIFT transfers money. In reality, SWIFT does not hold funds, settle payments, or maintain accounts for members. Instead, it provides a standardized and secure messaging system that allows banks to communicate financial instructions such as:
Cross-border payments
Securities transactions
Treasury deals
Trade finance documents
2.2 SWIFT Message Types
SWIFT messages follow standardized formats known as MT (Message Type) series. For instance:
MT103 – Single customer credit transfer (used for cross-border payments)
MT202 – General financial institution transfer
MT799 – Free-format message (often used in trade finance)
In recent years, SWIFT has transitioned to ISO 20022, an XML-based messaging standard that provides richer data, improving compliance, transparency, and automation.
2.3 Secure Network Infrastructure
SWIFT operates through a secure, private IP-based network known as SWIFTNet, supported by data centers in Europe, the U.S., and Asia. Messages are encrypted, authenticated, and routed through SWIFT’s infrastructure to ensure confidentiality, integrity, and availability.
3. Role of SWIFT in Cross-Border Payments
3.1 Standardization of Payment Messages
One of SWIFT’s biggest contributions is standardization. By creating globally accepted message formats, SWIFT eliminates ambiguity in payment instructions. This reduces operational risks, errors, and disputes. For example, an MT103 message is universally understood by banks in over 200 countries.
3.2 Speed and Efficiency
Before SWIFT, payments could take days or even weeks to process. With SWIFT, instructions are transmitted instantly across borders. While actual settlement still depends on correspondent banking arrangements, messaging delays have been nearly eliminated.
3.3 Security and Trust
Cross-border transactions involve huge sums of money, often in the billions. SWIFT provides strong encryption, authentication, and anti-fraud protocols, making it the most trusted network for international payments.
3.4 Connectivity in Global Trade
SWIFT connects over 11,000 financial institutions in more than 200 countries and territories. This global reach makes it the backbone of cross-border trade, enabling corporates, banks, and governments to transact seamlessly.
3.5 Correspondent Banking and SWIFT
Cross-border payments usually require multiple intermediaries (correspondent banks) when two banks don’t have a direct relationship. SWIFT facilitates this process by transmitting messages along the chain of correspondent banks, ensuring funds are eventually credited to the beneficiary.
4. SWIFT in Action: An Example
Imagine a customer in India sending $10,000 to a supplier in Germany.
The Indian customer instructs their bank to transfer the funds.
The Indian bank creates an MT103 message via SWIFT, directing its correspondent bank in Europe to debit its account and credit the German bank.
The German bank receives the SWIFT message and credits the supplier’s account.
The supplier receives funds, while SWIFT has acted only as the messaging medium.
This standardized, secure communication ensures accuracy, speed, and reliability.
5. SWIFT’s Economic and Geopolitical Importance
5.1 Enabler of Globalization
SWIFT underpins international trade by making payments predictable and efficient. Without it, global supply chains, remittances, and investment flows would be significantly slower and riskier.
5.2 Role in Sanctions and Geopolitics
Because of its centrality, SWIFT has become a geopolitical tool. For instance, Iranian banks were cut off from SWIFT in 2012 and again in 2018, severely restricting Iran’s access to global markets. Similarly, Russian banks faced SWIFT restrictions in 2022 after the Ukraine invasion.
5.3 Dependence and Alternatives
The reliance on SWIFT has raised concerns about overdependence. Some countries have developed alternatives:
CIPS (China’s Cross-Border Interbank Payment System)
SPFS (Russia’s System for Transfer of Financial Messages)
UPI-based cross-border initiatives (India)
Still, SWIFT remains the dominant system due to its network effects and global acceptance.
6. Evolution and Innovations in SWIFT
6.1 SWIFT gpi (Global Payments Innovation)
Launched in 2017, SWIFT gpi transformed cross-border payments by introducing:
End-to-end tracking (like a parcel tracking system for money)
Same-day use of funds in many cases
Transparency in fees and FX rates
Confirmation of credit to beneficiary
Today, gpi covers over 80% of SWIFT cross-border traffic, making payments faster, cheaper, and more transparent.
6.2 ISO 20022 Migration
SWIFT is migrating from legacy MT messages to ISO 20022 by 2025. This shift will enable:
Richer data for compliance (e.g., sanctions screening, AML checks)
Better automation and reconciliation
Interoperability with domestic real-time payment systems
6.3 Future Technologies
SWIFT is also experimenting with blockchain, central bank digital currencies (CBDCs), and tokenized assets. For instance, SWIFT has piloted experiments linking CBDCs across different countries, positioning itself as a neutral connector even in a digital currency world.
7. Challenges Facing SWIFT
7.1 Competition from Alternatives
Regional systems like China’s CIPS or blockchain-based solutions like RippleNet challenge SWIFT’s dominance. Fintech innovations promise faster, cheaper transfers without multiple intermediaries.
7.2 Costs and Fees
While SWIFT is efficient, cross-border payments often remain costly due to correspondent bank charges. Fintech challengers are pushing for lower-cost solutions.
7.3 Cybersecurity Risks
Being the backbone of global payments, SWIFT is a prime cyber target. Incidents like the 2016 Bangladesh Bank hack, where hackers exploited SWIFT credentials to steal $81 million, highlight vulnerabilities. SWIFT responded with its Customer Security Programme (CSP) to strengthen defenses.
7.4 Geopolitical Pressures
SWIFT’s role in sanctions makes it politically sensitive. Its neutrality is constantly tested as major powers use access to SWIFT as leverage in global disputes.
8. The Future of Cross-Border Payments and SWIFT
8.1 Towards Instant Payments
Global efforts are underway to make cross-border payments as fast as domestic transfers. SWIFT is adapting by linking with real-time domestic systems and enhancing gpi.
8.2 Digital Currencies and Blockchain
The rise of CBDCs, stablecoins, and blockchain networks may disrupt SWIFT’s role. However, SWIFT’s vast network gives it an edge to act as an interoperability layer, connecting legacy systems with digital currencies.
8.3 Regulatory Harmonization
Cross-border payments face compliance challenges (AML, KYC, sanctions). SWIFT’s data-rich ISO 20022 messages can help improve regulatory oversight while maintaining efficiency.
8.4 Balancing Neutrality and Politics
SWIFT’s survival depends on maintaining neutrality while navigating political pressures. Its governance as a cooperative helps, but geopolitical rivalries may accelerate regional alternatives.
9. Conclusion
For over four decades, SWIFT has been the invisible backbone of cross-border payments. By providing a standardized, secure, and reliable messaging system, it has enabled globalization, facilitated trillions in trade and finance, and connected thousands of institutions worldwide.
Its contributions include:
Standardization of payment messages
Enhanced speed, security, and reliability
Support for correspondent banking
Enabling sanctions enforcement and geopolitical leverage
Constant evolution through SWIFT gpi and ISO 20022
Yet, challenges loom: fintech disruptions, geopolitical tensions, cybersecurity risks, and the rise of digital currencies. SWIFT’s ability to innovate and maintain global trust will determine whether it remains the nerve center of international payments in the digital era.
In summary, while SWIFT does not move money directly, its role as the messenger of global finance is irreplaceable—at least for now. The future of cross-border payments may involve blockchain, CBDCs, or regional systems, but SWIFT’s global reach, trust, and adaptability ensure that it will continue to play a central role in shaping how money flows across borders.
Role of G7 and G20 in World Markets1. Historical Background
1.1 Origins of the G7
The G7 originated in the 1970s oil crisis and currency instability. The breakdown of the Bretton Woods system (1971) and the 1973 oil shock forced leaders of the US, UK, France, West Germany, Italy, and Japan to coordinate policies.
The first meeting took place in 1975 at Rambouillet, France. Canada joined in 1976, making it the G7.
The forum was designed as an informal space for dialogue among advanced economies, free from the rigid bureaucracy of the IMF or UN.
1.2 Expansion into G20
By the late 1990s, globalization had empowered emerging markets like China, India, Brazil, and South Africa.
The Asian Financial Crisis of 1997–98 exposed the limitations of the G7, which could not represent the interests of developing nations.
The G20 was created in 1999, initially as a forum for finance ministers and central bank governors.
Following the 2008 Global Financial Crisis, the G20 was elevated to a leaders’ summit level, becoming the “premier forum for international economic cooperation.”
2. Membership & Structure
2.1 G7
Members: United States, Canada, United Kingdom, France, Germany, Italy, Japan, and the EU (as an observer).
Characteristics: Advanced, high-income democracies with strong global financial markets.
Focus: Monetary policy coordination, financial stability, trade, development aid, sanctions, and geopolitical security.
2.2 G20
Members: 19 countries + European Union. Includes major emerging economies like China, India, Brazil, Russia, South Africa, Mexico, Indonesia, Turkey, Argentina, Saudi Arabia, and others.
Coverage: Represents 85% of global GDP, 75% of international trade, and two-thirds of the world’s population.
Focus: Broader economic and financial stability, trade, infrastructure investment, climate change, digital economy, inclusive development.
3. Role in Financial Markets
3.1 Market Stability
The G7 historically acted as a currency stabilizer. For example, the Plaza Accord (1985) coordinated interventions to weaken the US dollar, reshaping forex markets.
The Louvre Accord (1987) similarly stabilized exchange rates. These decisions had immediate effects on bond yields, commodity prices, and stock market sentiment.
The G20, after 2008, coordinated stimulus packages worth trillions of dollars. This joint effort restored investor confidence, stabilized equity markets, and prevented a deeper depression.
3.2 Regulatory Standards
Both groups influence the Basel Committee on Banking Supervision, which sets global banking capital requirements.
The G20’s Financial Stability Board (FSB) was established in 2009 to monitor risks, enforce transparency, and reduce systemic threats. This has reshaped financial markets, particularly derivatives and shadow banking oversight.
3.3 Debt Management & Sovereign Risk
G7 finance ministers often negotiate debt relief for low-income countries, working alongside the IMF and World Bank.
The G20 launched the Debt Service Suspension Initiative (DSSI) in 2020, allowing the poorest nations to defer debt payments during the pandemic—affecting global bond market pricing of sovereign risk.
4. Role in Global Trade
4.1 G7’s Trade Leadership
G7 economies historically dominated WTO negotiations and set the tone for trade liberalization.
The G7 often pushes for open markets, free trade agreements, and intellectual property rights protection.
However, it has also been accused of protectionism—for instance, through agricultural subsidies or technology restrictions.
4.2 G20 and Trade Balancing
The G20 plays a bigger role in mediating between advanced and emerging economies.
After 2008, the G20 pledged to avoid protectionism and keep markets open. This was crucial in preventing a collapse of world trade.
More recently, the G20 has dealt with US-China trade tensions, global supply chain resilience, and reforms of the WTO dispute system.
5. Role in Investment & Infrastructure
5.1 Investment Flows
G7 countries, as capital exporters, dominate foreign direct investment (FDI) and global finance. Their regulatory policies shape global flows.
The G20 promotes inclusive investment frameworks, encouraging capital flows into Africa, Asia, and Latin America.
5.2 Infrastructure Financing
The G20 launched the Global Infrastructure Hub (2014) to connect investors with large-scale infrastructure projects.
The Partnership for Global Infrastructure and Investment (PGII), promoted by G7 in 2022, was designed as a counter to China’s Belt and Road Initiative (BRI).
6. Role in Crisis Management
6.1 2008 Financial Crisis
G7 alone lacked credibility, as emerging markets were now critical players.
The G20’s emergency summits (2008–2009) led to coordinated fiscal stimulus, global liquidity injections, and bank recapitalizations. This stabilized world stock markets.
6.2 Eurozone Debt Crisis (2010–2012)
G7 central banks coordinated to provide liquidity and backstop the euro.
G20 forums pressured European leaders to balance austerity with growth measures.
6.3 COVID-19 Pandemic (2020–2021)
G20 pledged $5 trillion in economic stimulus, central banks slashed interest rates, and liquidity lines were extended across borders.
G7 coordinated on vaccine financing (COVAX) and kept supply chains for medical goods functioning.
7. Role in Currency & Monetary Policy
G7 historically managed exchange rate diplomacy (e.g., Plaza Accord).
The G20 now addresses global imbalances, such as China’s currency valuation, US trade deficits, and emerging market vulnerabilities.
Both groups’ central banks’ policies (Fed, ECB, BOJ, PBOC, etc.) directly influence capital markets worldwide.
8. Role in Technology & Digital Economy
G7 promotes data governance, cybersecurity standards, AI regulations, and digital taxation frameworks.
G20 addresses digital inclusion, fintech growth, cross-border payment systems, and crypto regulation.
These policies affect stock valuations in the tech sector, investor confidence, and cross-border capital mobility.
9. Future Outlook
The G7 will likely remain a strategic and political coordination forum for Western democracies, focusing on sanctions, technology standards, and security-linked economics.
The G20 will remain the central platform for global economic governance, especially in addressing:
Climate financing
Sustainable debt frameworks
Digital currencies (CBDCs)
AI-driven market disruptions
Geopolitical risks in trade and energy
Their role will be critical as the world transitions into a multipolar economic order where no single power dominates.
10. Conclusion
The G7 and G20 act as twin pillars of global economic governance. While the G7 provides leadership from advanced democracies, the G20 reflects the diversity of the modern global economy. Their combined influence extends across financial markets, trade, investment, crisis management, energy security, and digital governance.
Though criticized for exclusivity, lack of enforcement, or internal divisions, both remain indispensable. In times of global crisis—whether financial collapse, pandemics, or geopolitical shocks—they have demonstrated the capacity to restore market confidence and stabilize the world economy.
Ultimately, the G7 and G20 do not replace institutions like the IMF, World Bank, or WTO, but they provide the political will and high-level coordination necessary to steer the world through uncertainty. In a world of interconnected markets, their role will only deepen in shaping the future of global capitalism.
World Bank & Emerging Market DevelopmentUnderstanding Emerging Markets
1. Defining Emerging Markets
An “emerging market” is typically defined as an economy that is not yet fully developed but exhibits high growth potential. They are characterized by:
Rising GDP growth rates.
Rapid urbanization and industrialization.
Expanding financial markets.
Increasing foreign direct investment (FDI).
Growing importance in global trade.
Examples include India, Brazil, South Africa, Turkey, Mexico, Vietnam, and Indonesia, as well as frontier economies like Kenya, Bangladesh, and Ethiopia.
2. Characteristics of Emerging Markets
Demographics: Large young populations, creating both opportunities (labor force, consumption) and challenges (employment, education).
Infrastructure Needs: Roads, ports, electricity, and digital networks are often underdeveloped.
Governance Challenges: Issues of corruption, weak institutions, and political instability persist.
Vulnerability to Shocks: They depend on commodities, remittances, and global capital flows, making them exposed to volatility.
Dual Economies: Often a mix of modern urban centers with advanced industries and rural areas dependent on agriculture.
The World Bank: An Overview
1. Structure of the World Bank Group (WBG)
The World Bank is part of the World Bank Group, which includes:
IBRD (International Bank for Reconstruction and Development) – provides loans to middle-income and creditworthy low-income countries.
IDA (International Development Association) – provides concessional loans and grants to the poorest countries.
IFC (International Finance Corporation) – promotes private sector development.
MIGA (Multilateral Investment Guarantee Agency) – offers political risk insurance and credit enhancement.
ICSID (International Centre for Settlement of Investment Disputes) – provides arbitration facilities for investment disputes.
2. Objectives of the World Bank
Reducing extreme poverty.
Promoting sustainable economic development.
Facilitating investment in infrastructure, education, health, and governance.
Supporting private sector growth and job creation.
Strengthening resilience to climate change and global crises.
World Bank’s Role in Emerging Market Development
1. Financing Infrastructure
One of the World Bank’s biggest contributions is funding infrastructure projects: roads, ports, power plants, water systems, and digital networks. Infrastructure lays the foundation for industrialization, trade, and productivity growth.
In India, the World Bank has funded rural electrification and metro transport systems.
In Africa, it has supported the Africa Power Project to expand electricity access.
2. Poverty Reduction Programs
The World Bank invests heavily in programs aimed at reducing poverty and inequality. Examples include:
Conditional cash transfers in Latin America.
Rural development projects in South Asia.
Healthcare and vaccination programs in Sub-Saharan Africa.
3. Strengthening Institutions and Governance
Emerging markets often face weak institutional frameworks. The World Bank provides technical assistance to improve governance, transparency, tax collection, and public financial management.
4. Promoting Private Sector Development
Through the IFC, the World Bank fosters private enterprise, small and medium enterprises (SMEs), and access to finance. It mobilizes private investment in sectors such as energy, manufacturing, and digital technology.
5. Crisis Response and Resilience
Emerging markets are vulnerable to financial crises, pandemics, natural disasters, and climate shocks. The World Bank provides rapid financing and policy support in times of crisis. For example:
During COVID-19, the Bank committed billions for vaccines and health system strengthening.
In food crises, it has supported agricultural productivity and emergency aid.
Case Studies of World Bank in Emerging Markets
1. India
The World Bank has invested in education projects like Sarva Shiksha Abhiyan, enhancing literacy and enrollment rates.
It has supported clean energy projects, such as solar parks and wind farms.
World Bank loans have also been directed towards digital governance and financial inclusion (Aadhaar-linked systems).
2. Brazil
The World Bank has funded projects in Amazon rainforest conservation.
It has also supported urban infrastructure in cities like São Paulo and Rio de Janeiro.
Programs addressing inequality and slum rehabilitation have benefited from World Bank assistance.
3. Sub-Saharan Africa
In Kenya, the World Bank financed the Geothermal Energy Expansion project.
In Ethiopia, it has invested in agriculture modernization and irrigation.
Across Africa, the IDA is the largest source of concessional financing, focusing on health, infrastructure, and governance.
4. Vietnam
Transitioned from a centrally planned to a market economy with World Bank guidance.
Major infrastructure projects (roads, ports, and power grids) were co-financed.
Poverty rates fell dramatically from over 70% in the 1980s to under 6% today.
Successes of World Bank in Emerging Markets
Poverty Reduction – Countries like Vietnam, India, and Bangladesh have seen significant poverty reduction with World Bank support.
Infrastructure Development – Roads, ports, and energy systems financed by the Bank have fueled industrialization.
Human Capital – Investments in education and health have improved literacy, reduced infant mortality, and increased life expectancy.
Private Sector Growth – Through the IFC, the Bank has boosted SME development, job creation, and entrepreneurship.
Global Integration – World Bank programs helped countries integrate into global trade and attract FDI.
Emerging Challenges and Future Role
1. Climate Change and Sustainability
Emerging markets are among the most vulnerable to climate shocks. The World Bank is increasingly focusing on green financing, renewable energy, and climate resilience.
2. Digital Transformation
The future of development is digital. The Bank supports digital finance, e-governance, and broadband connectivity to bridge the digital divide.
3. Inequality and Inclusive Growth
Even as GDP grows, inequality remains high in emerging markets. World Bank programs are now emphasizing inclusive growth, targeting women, rural populations, and marginalized groups.
4. Geopolitical Tensions and Multipolarity
As China expands its influence through the Asian Infrastructure Investment Bank (AIIB) and Belt & Road Initiative (BRI), the World Bank faces competition in development finance. Collaborations and new models of financing will define the future.
5. Health and Pandemic Preparedness
The COVID-19 pandemic revealed the fragility of health systems. The Bank is likely to expand investments in universal health coverage, vaccine development, and pandemic resilience.
Conclusion
The relationship between the World Bank and emerging market development is a story of both achievement and controversy. On one hand, the Bank has helped lift millions out of poverty, build transformative infrastructure, and create opportunities for growth and integration into the world economy. On the other, it has been criticized for policies that sometimes exacerbated inequality, debt, or environmental harm.
As the global landscape shifts—with climate change, digital transformation, geopolitical rivalries, and health crises at the forefront—the World Bank’s role in emerging markets will evolve. Its challenge will be to balance financing with sustainability, growth with inclusivity, and global integration with local autonomy.
Ultimately, the World Bank remains a cornerstone of development finance, and for emerging markets, it will continue to be a vital partner in the pursuit of prosperity, stability, and resilience in the 21st century.
History of International Trade & Finance1. Early Civilizations and Barter Trade
1.1 The Origins of Trade
Trade began as simple bartering—exchanging one good for another. Ancient tribes swapped food, tools, and raw materials. Over time, trade networks extended across rivers, deserts, and seas.
Mesopotamia (3500 BCE onwards): Known as the “cradle of civilization,” Mesopotamians traded grain, textiles, and metals. Cuneiform tablets recorded trade contracts.
Indus Valley Civilization (2500 BCE): Had advanced trade with Mesopotamia; seals found in Mesopotamia prove this.
Ancient Egypt: Exchanged gold, papyrus, and grain with neighboring kingdoms.
China: Silk production started around 2700 BCE, later leading to the legendary Silk Road.
1.2 Rise of Currency
Barter had limitations—value mismatch and lack of divisibility. To solve this, money emerged:
Commodity money like salt, shells, and cattle.
Metallic coins (Lydia in 7th century BCE) became a global standard.
Precious metals like gold and silver gained universal acceptance, laying the foundation for finance.
2. Classical Empires and Trade Routes
2.1 The Silk Road
The Silk Road (200 BCE – 1400 CE) was the greatest ancient trade route, linking China, India, Persia, and Rome. It carried silk, spices, glassware, and ideas. More than goods, it spread culture, religion, and technology.
2.2 Roman Trade Networks
Rome imported grain from Egypt, spices from India, and silk from China. Roman finance developed banking houses, credit, and promissory notes. Roman coins (denarii) were used across Europe and Asia.
2.3 Indian Ocean Trade
Arab merchants dominated sea routes. Dhows carried spices, ivory, and textiles. The monsoon winds made seasonal navigation predictable. Indian and Chinese merchants thrived here, creating one of the earliest examples of global maritime trade finance.
3. The Middle Ages and Islamic Finance
3.1 European Trade Revival
After the fall of Rome, Europe faced decline. But by the 11th century, trade revived:
Medieval fairs in France became major trade hubs.
Italian city-states (Venice, Genoa, Florence) dominated Mediterranean trade.
3.2 The Rise of Islamic Finance
Islamic empires (7th – 13th centuries) expanded trade from Spain to India. Key contributions:
Bills of exchange (suftaja) allowed merchants to travel without carrying gold.
Hawala system enabled money transfers through trust networks, avoiding risks of theft.
Introduction of credit instruments helped finance caravans and voyages.
4. The Age of Exploration (15th – 17th Century)
4.1 Maritime Expansion
European powers—Portugal, Spain, later Britain and the Netherlands—launched voyages for spices, silk, and gold.
Vasco da Gama reached India (1498).
Columbus discovered the Americas (1492).
Magellan circumnavigated the globe (1519–22).
4.2 Mercantilism and Colonial Trade
The mercantilist system dominated: nations sought to maximize exports, minimize imports, and accumulate gold. Colonies became suppliers of raw materials and consumers of finished goods.
4.3 Birth of Modern Finance
To finance risky voyages, new institutions emerged:
Joint-stock companies (e.g., Dutch East India Company, British East India Company).
Amsterdam Stock Exchange (1602) – world’s first modern stock market.
Insurance (Lloyd’s of London) protected ships and cargo.
This era established the deep link between trade, finance, and empire-building.
5. The Industrial Revolution (18th – 19th Century)
5.1 Transformation of Trade
The Industrial Revolution (1760–1840) changed everything:
Steam engines, textile machines, and iron production boosted manufacturing.
Mass production required raw materials (cotton, coal, iron ore) and expanded markets.
Global trade networks intensified.
5.2 Finance in the Industrial Age
The gold standard emerged, fixing currencies to gold reserves.
Banks expanded credit to industries.
London became the financial capital of the world.
Railroads and steamships were financed through international capital markets.
5.3 Colonial Exploitation
European empires extracted resources from colonies—India, Africa, Southeast Asia. The colonial economy was designed to feed Europe’s industrial growth, shaping global trade imbalances that persist even today.
6. Early 20th Century: Globalization and Crises
6.1 Pre–World War I Globalization
By 1900, global trade was booming:
Free trade policies spread.
Telegraphs and steamships made commerce faster.
Capital flowed across borders, mainly from Britain and France to colonies.
6.2 The Great Depression (1929–39)
The Wall Street Crash led to worldwide financial collapse:
Global trade shrank by two-thirds.
Countries imposed tariffs (e.g., Smoot-Hawley Act in the U.S.).
Protectionism deepened the crisis.
6.3 World Wars and Finance
Both World Wars disrupted trade but also advanced technology. Finance shifted towards war bonds, government borrowing, and central bank intervention. The U.S. emerged as a financial superpower after WWII.
7. The Bretton Woods System (1944 – 1971)
7.1 Establishing New Institutions
In 1944, world leaders met at Bretton Woods (USA) to design a new economic order. Key outcomes:
Creation of IMF (International Monetary Fund) to stabilize currencies.
Creation of World Bank for reconstruction and development.
U.S. dollar linked to gold ($35 per ounce), other currencies pegged to the dollar.
7.2 Expansion of Global Trade
GATT (General Agreement on Tariffs and Trade, 1947) reduced tariffs.
Europe rebuilt under the Marshall Plan.
Japan and Germany emerged as industrial powers again.
8. Collapse of Bretton Woods & Rise of Global Finance (1971 onwards)
8.1 Nixon Shocks and Floating Exchange Rates
In 1971, U.S. President Richard Nixon ended dollar-gold convertibility. Result:
Shift to floating exchange rates.
Rise of foreign exchange markets (Forex).
8.2 Oil Shocks and Petrodollar System
The 1973 oil crisis reshaped global finance. Oil was priced in dollars, reinforcing U.S. dominance. Oil-rich nations invested surplus revenues into Western banks—known as petrodollar recycling.
8.3 Financial Deregulation (1980s–90s)
Margaret Thatcher and Ronald Reagan promoted free markets.
Liberalization allowed capital to flow freely.
Growth of multinational corporations (MNCs).
Stock markets, derivatives, and hedge funds expanded dramatically.1. Early Civilizations and Barter Trade
1.1 The Origins of Trade
Trade began as simple bartering—exchanging one good for another. Ancient tribes swapped food, tools, and raw materials. Over time, trade networks extended across rivers, deserts, and seas.
Mesopotamia (3500 BCE onwards): Known as the “cradle of civilization,” Mesopotamians traded grain, textiles, and metals. Cuneiform tablets recorded trade contracts.
Indus Valley Civilization (2500 BCE): Had advanced trade with Mesopotamia; seals found in Mesopotamia prove this.
Ancient Egypt: Exchanged gold, papyrus, and grain with neighboring kingdoms.
China: Silk production started around 2700 BCE, later leading to the legendary Silk Road.
1.2 Rise of Currency
Barter had limitations—value mismatch and lack of divisibility. To solve this, money emerged:
Commodity money like salt, shells, and cattle.
Metallic coins (Lydia in 7th century BCE) became a global standard.
Precious metals like gold and silver gained universal acceptance, laying the foundation for finance.
2. Classical Empires and Trade Routes
2.1 The Silk Road
The Silk Road (200 BCE – 1400 CE) was the greatest ancient trade route, linking China, India, Persia, and Rome. It carried silk, spices, glassware, and ideas. More than goods, it spread culture, religion, and technology.
2.2 Roman Trade Networks
Rome imported grain from Egypt, spices from India, and silk from China. Roman finance developed banking houses, credit, and promissory notes. Roman coins (denarii) were used across Europe and Asia.
2.3 Indian Ocean Trade
Arab merchants dominated sea routes. Dhows carried spices, ivory, and textiles. The monsoon winds made seasonal navigation predictable. Indian and Chinese merchants thrived here, creating one of the earliest examples of global maritime trade finance.
3. The Middle Ages and Islamic Finance
3.1 European Trade Revival
After the fall of Rome, Europe faced decline. But by the 11th century, trade revived:
Medieval fairs in France became major trade hubs.
Italian city-states (Venice, Genoa, Florence) dominated Mediterranean trade.
3.2 The Rise of Islamic Finance
Islamic empires (7th – 13th centuries) expanded trade from Spain to India. Key contributions:
Bills of exchange (suftaja) allowed merchants to travel without carrying gold.
Hawala system enabled money transfers through trust networks, avoiding risks of theft.
Introduction of credit instruments helped finance caravans and voyages.
4. The Age of Exploration (15th – 17th Century)
4.1 Maritime Expansion
European powers—Portugal, Spain, later Britain and the Netherlands—launched voyages for spices, silk, and gold.
Vasco da Gama reached India (1498).
Columbus discovered the Americas (1492).
Magellan circumnavigated the globe (1519–22).
4.2 Mercantilism and Colonial Trade
The mercantilist system dominated: nations sought to maximize exports, minimize imports, and accumulate gold. Colonies became suppliers of raw materials and consumers of finished goods.
4.3 Birth of Modern Finance
To finance risky voyages, new institutions emerged:
Joint-stock companies (e.g., Dutch East India Company, British East India Company).
Amsterdam Stock Exchange (1602) – world’s first modern stock market.
Insurance (Lloyd’s of London) protected ships and cargo.
This era established the deep link between trade, finance, and empire-building.
5. The Industrial Revolution (18th – 19th Century)
5.1 Transformation of Trade
The Industrial Revolution (1760–1840) changed everything:
Steam engines, textile machines, and iron production boosted manufacturing.
Mass production required raw materials (cotton, coal, iron ore) and expanded markets.
Global trade networks intensified.
5.2 Finance in the Industrial Age
The gold standard emerged, fixing currencies to gold reserves.
Banks expanded credit to industries.
London became the financial capital of the world.
Railroads and steamships were financed through international capital markets.
5.3 Colonial Exploitation
European empires extracted resources from colonies—India, Africa, Southeast Asia. The colonial economy was designed to feed Europe’s industrial growth, shaping global trade imbalances that persist even today.
6. Early 20th Century: Globalization and Crises
6.1 Pre–World War I Globalization
By 1900, global trade was booming:
Free trade policies spread.
Telegraphs and steamships made commerce faster.
Capital flowed across borders, mainly from Britain and France to colonies.
6.2 The Great Depression (1929–39)
The Wall Street Crash led to worldwide financial collapse:
Global trade shrank by two-thirds.
Countries imposed tariffs (e.g., Smoot-Hawley Act in the U.S.).
Protectionism deepened the crisis.
6.3 World Wars and Finance
Both World Wars disrupted trade but also advanced technology. Finance shifted towards war bonds, government borrowing, and central bank intervention. The U.S. emerged as a financial superpower after WWII.
7. The Bretton Woods System (1944 – 1971)
7.1 Establishing New Institutions
In 1944, world leaders met at Bretton Woods (USA) to design a new economic order. Key outcomes:
Creation of IMF (International Monetary Fund) to stabilize currencies.
Creation of World Bank for reconstruction and development.
U.S. dollar linked to gold ($35 per ounce), other currencies pegged to the dollar.
7.2 Expansion of Global Trade
GATT (General Agreement on Tariffs and Trade, 1947) reduced tariffs.
Europe rebuilt under the Marshall Plan.
Japan and Germany emerged as industrial powers again.
8. Collapse of Bretton Woods & Rise of Global Finance (1971 onwards)
8.1 Nixon Shocks and Floating Exchange Rates
In 1971, U.S. President Richard Nixon ended dollar-gold convertibility. Result:
Shift to floating exchange rates.
Rise of foreign exchange markets (Forex).
8.2 Oil Shocks and Petrodollar System
The 1973 oil crisis reshaped global finance. Oil was priced in dollars, reinforcing U.S. dominance. Oil-rich nations invested surplus revenues into Western banks—known as petrodollar recycling.
8.3 Financial Deregulation (1980s–90s)
Margaret Thatcher and Ronald Reagan promoted free markets.
Liberalization allowed capital to flow freely.
Growth of multinational corporations (MNCs).
Stock markets, derivatives, and hedge funds expanded dramatically.
9. Globalization Era (1990s – 2008)
9.1 WTO and Free Trade
In 1995, the World Trade Organization (WTO) replaced GATT, enforcing trade rules. Globalization accelerated:
Outsourcing and offshoring.
China became “the world’s factory.”
NAFTA and EU expanded regional trade blocs.
9.2 Rise of Emerging Markets
India, Brazil, Russia, and China (BRIC nations) became major players. Foreign direct investment (FDI) surged.
9.3 Asian Financial Crisis (1997–98)
Currency collapses in Thailand, Indonesia, and South Korea exposed risks of free capital flows. IMF bailouts highlighted tensions between sovereignty and global finance.
10. The 2008 Global Financial Crisis
The collapse of Lehman Brothers triggered the worst financial crisis since the Great Depression. Causes:
Excessive lending, subprime mortgages.
Complex derivatives (CDOs, credit default swaps).
Weak regulation.
Impact:
World trade contracted sharply.
Governments rescued banks with bailouts.
Central banks adopted quantitative easing (QE)—printing money to stabilize economies.
11. The 21st Century: Digital Trade and Fintech
11.1 Rise of Digital Economy
E-commerce giants (Amazon, Alibaba) revolutionized trade.
Services trade (IT outsourcing, digital platforms) grew faster than goods trade.
Data became a new form of currency.
11.2 Fintech and Cryptocurrencies
Mobile payments (PayPal, UPI, Alipay) expanded financial inclusion.
Blockchain and Bitcoin challenged traditional banking.
Central banks began exploring CBDCs (Central Bank Digital Currencies).
11.3 China vs. U.S. Rivalry
China’s Belt and Road Initiative (BRI) reshaped global trade finance. The U.S.-China trade war (2018 onwards) revealed deep tensions in globalization.
12. COVID-19 Pandemic and Supply Chain Shocks
The 2020 pandemic disrupted global trade:
Supply chains collapsed.
Oil prices turned negative temporarily.
Governments injected trillions into economies.
Digital trade accelerated massively.
The crisis highlighted the risks of overdependence on global supply chains.
13. Future of International Trade & Finance
13.1 Green Trade and Sustainable Finance
Climate change is shaping global trade policies:
Carbon taxes on imports.
Green finance for renewable projects.
13.2 Multipolar Trade World
India, ASEAN, and Africa rising as key players.
Decline of Western dominance.
13.3 AI, Automation & Decentralized Finance (DeFi)
Artificial intelligence is transforming logistics, stock markets, and risk management. Blockchain-based DeFi could replace traditional banking intermediaries.
Conclusion
The history of international trade and finance is a story of innovation, expansion, crisis, and adaptation. From Mesopotamian barter to today’s AI-driven digital finance, humans have constantly sought ways to connect across borders.
Key lessons:
Trade thrives on trust, finance, and institutions.
Every era of expansion faces crises that reshape the system.
The future will be defined by sustainability, digital innovation, and geopolitical shifts.
In essence, trade and finance are not just economic activities—they are engines of civilization, shaping politics, culture, and human destiny.
The Future of Global Trade in an AI-Driven Economy1. AI as the New Engine of Global Trade
From Industrialization to Intelligence
Past revolutions in trade were triggered by steam engines, electricity, containerization, and the internet. AI represents the next leap—not simply making things faster, but making them smarter. Unlike previous technologies that amplified human effort, AI adds decision-making capability, meaning trade will increasingly rely on machines that can “think,” adapt, and optimize.
Characteristics of AI-Driven Trade
Data-centric: AI thrives on big data. Global trade generates enormous datasets—from shipping manifests to customs filings—which AI can process for insights.
Predictive: AI tools forecast demand and supply shifts with greater accuracy.
Automated: From self-driving ships to smart warehouses, automation will reduce costs and errors.
Global but Localized: AI allows hyper-local personalization even in global networks.
This shift is akin to the way electricity restructured economies. In the AI era, the flow of data will become as critical to trade as the flow of goods.
2. AI and the Transformation of Supply Chains
Global supply chains are complex, involving multiple countries, regulations, and logistical challenges. AI is set to bring visibility, resilience, and efficiency.
a) Smart Logistics and Transportation
Autonomous vehicles and ships will reduce dependence on human operators and cut costs.
AI-driven route optimization will minimize fuel use and delivery times.
Port automation (robotic cranes, automated customs processing) will speed up global trade.
b) Predictive Demand and Inventory Management
AI can anticipate demand shifts (e.g., during pandemics or geopolitical crises) and adjust inventory accordingly. This will reduce both shortages and waste, making supply chains more sustainable.
c) Risk and Disruption Management
AI can monitor global risks—natural disasters, political tensions, cyberattacks—and reroute supply chains dynamically. This is critical in an era of rising uncertainties.
d) Sustainability in Supply Chains
With rising ESG (Environmental, Social, Governance) standards, AI can track carbon footprints across supply chains and help companies meet compliance requirements.
3. AI and Trade Finance
Global trade depends heavily on financial mechanisms like letters of credit, risk assessment, insurance, and cross-border payments. AI will streamline and revolutionize this sector.
a) Fraud Detection and Risk Assessment
AI models can scan thousands of transactions to detect anomalies, reducing fraud in trade finance.
b) Automated Compliance
Regulatory compliance is a major hurdle in global trade. AI systems can ensure all paperwork aligns with customs and international standards.
c) Cross-Border Digital Payments
AI will enhance real-time, low-cost cross-border transactions—especially with blockchain and CBDCs (Central Bank Digital Currencies) integration.
d) Credit and Insurance
AI can assess the creditworthiness of SMEs involved in global trade, giving them access to financing previously unavailable. This democratizes trade participation.
4. Digital Trade and AI-Enabled Services
In the AI-driven economy, trade will no longer be limited to physical goods. Digital trade in AI-driven services, data, and intellectual property will dominate.
a) AI as a Service (AIaaS)
Countries and firms will increasingly export AI models, algorithms, and platforms—much like software today.
b) Data as a Tradable Asset
Data will become the new oil. Nations with strong data ecosystems (like India, China, and the US) will wield enormous trade power.
c) Remote Work and Global Talent Flows
AI will enable remote, cross-border services (legal, medical, design) to flourish. Global freelancing platforms will expand.
d) Intellectual Property (IP) Battles
AI-generated content, patents, and inventions will raise questions: Who owns AI-created IP? This will spark new trade disputes and WTO reforms.
5. The Geopolitics of AI in Trade
AI will create winners and losers in global trade. Just as industrialization once divided the world, AI capabilities will dictate future influence.
a) US-China AI Rivalry
The US dominates AI research and cloud services.
China leverages massive data pools and state-led AI strategy.
This rivalry will shape trade alliances, technology standards, and market access.
b) Developing Economies
Nations in Africa, Latin America, and South Asia risk being left behind without AI infrastructure. However, leapfrogging opportunities exist—especially in fintech, agritech, and logistics.
c) Digital Trade Wars
Just as tariffs sparked old trade wars, data tariffs, AI export bans, and algorithmic regulations may trigger new conflicts.
d) Strategic Resources for AI
AI depends on semiconductors, rare earths, and cloud infrastructure. Control over these will become as critical as oil once was.
6. Labor, Skills, and Workforce in AI-Driven Trade
AI will fundamentally reshape labor markets linked to global trade.
a) Automation of Manual Jobs
Dock workers, truck drivers, warehouse staff—all face automation risks.
b) Rise of Knowledge Work
AI trade requires data scientists, cybersecurity experts, and AI ethicists. Knowledge-based services will replace low-cost labor as the main trade advantage.
c) Upskilling and Reskilling
Countries that invest in digital skills training will integrate better into the AI trade ecosystem.
d) Global Inequality
If not managed, AI trade could widen the gap between AI-rich and AI-poor nations.
Future Scenarios of Global Trade in an AI Economy
Scenario 1: Optimistic Future
AI democratizes trade, empowering SMEs worldwide, cutting costs, and creating sustainable global prosperity.
Scenario 2: Fragmented Future
AI trade splinters into blocs (US-led, China-led, EU-led), creating digital trade wars and limiting global integration.
Scenario 3: Unequal Future
Wealthy nations monopolize AI infrastructure, leaving developing countries dependent and marginalized.
Scenario 4: Balanced Future
Through global cooperation (WTO, UN, G20), AI trade becomes inclusive, secure, and sustainable.
Conclusion
The AI-driven economy will not just modify global trade—it will reinvent it. Borders will matter less for digital services, but more for data regulation. Efficiency will improve, but risks around inequality, ethics, and geopolitics will rise.
Just as steamships once shrank oceans and the internet once shrank distances, AI is shrinking the barriers of complexity. Nations and businesses that harness AI responsibly will lead in the new global trade order. Those that resist adaptation may find themselves sidelined in a world where intelligence—not just labor or resources—drives prosperity.
The future of global trade in an AI-driven economy will ultimately depend on balance: between innovation and ethics, efficiency and sustainability, national interest and global collaboration.

Liquidity Trap or Smart Money Play? SUI Price Poised for Big Liquidity Trap or Smart Money Play? SUI Price Poised for Big Move Ahead”\
👋 Hello Traders & Investors,
Looking at SUI, the price action is showing a very interesting structure between the support zone ($11B – $11.5B) and the resistance zone ($14.5B – $15.5B). We already saw a strong impulse leg earlier, followed by a deep pullback, which created a clear lower high formation. Since then, the market has been rejecting each rally attempt and moving inside a descending structure, proving that sellers are still trying to keep control.
What stands out is the fake break below support — a classic liquidity grab where weak hands were shaken out before price quickly bounced back. Since then, liquidity has been building along the descending line, suggesting that the market is preparing for a possible stronger move.
From my perspective, the support zone is the key. As long as $11B continues to hold, there’s a high probability of seeing a sharp bullish reaction targeting the $14B area and potentially higher if momentum follows through. But if this support breaks convincingly, we may first see a deeper correction before any meaningful reversal begins.
⚡ My Opinion: This setup is worth watching closely. I believe buyers are waiting at the support to trigger a strong move upward, and the next liquidity sweep could fuel the rally. For me, the plan is simple — watch the reaction at $11B and ride the momentum toward the $14B–$15B region if confirmation comes.

GOLD ROUTE MAP UPDATEHey Everyone,
This is the 1H chart route map we tracked this week and it played out beautifully once again.
We got the expected play between 3613 and 3638, followed by a break above 3638 which re-opened the range to the upside. That move gave the strong push up we were looking for, just short of 3658.
Importantly, 3638 flipped into support and continued to provide precision bounces exactly in line with our dip-buying plans. A great finish to the week and a clear demonstration of how our levels consistently deliver structure and tradeable opportunities.
To recap:
3613 → 3638 gave the initial range.
The break and hold above 3638 confirmed upside continuation.
Price pushed toward 3658, with dips to 3638 giving repeated buy opportunities.
We will now come back Sunday with a full multi timeframe analysis to prepare for next week’s setups, including updated views on the higher timeframes, EMA5 alignments, and structure expectations going forward.
Thanks again for all your likes, comments, and follows.
Wishing you all a fantastic weekend!!
Mr Gold
GoldViewFX

Importance of Stable Currencies for World Market Trade1. The Role of Currency in Global Trade
1.1 Currency as a Medium of Exchange
International trade requires a common means of settlement. Because no single world currency exists (although the US dollar often acts as a de facto standard), countries exchange their goods and services using various national currencies. Stability ensures that the relative value of these currencies remains predictable, allowing businesses to price products, negotiate contracts, and settle payments with minimal risk.
1.2 Currency as a Unit of Account
Trade contracts, shipping agreements, and global commodity benchmarks are often denominated in stable currencies. For example, oil is priced globally in US dollars. If the dollar or any widely used trade currency becomes unstable, it complicates accounting, pricing, and long-term planning for businesses worldwide.
1.3 Currency as a Store of Value
Stable currencies retain purchasing power over time, encouraging businesses and investors to hold reserves in them. Importers and exporters often keep part of their profits in reliable currencies like the US dollar, euro, or yen. Instability erodes confidence and pushes businesses toward hedging or shifting reserves into more predictable assets like gold or government bonds.
2. Importance of Currency Stability for Businesses and Trade
2.1 Predictability in Pricing
For exporters and importers, volatile exchange rates can make products suddenly too expensive or too cheap in foreign markets. Stable currencies allow businesses to forecast demand, maintain competitive prices, and reduce the risk of losing markets due to sudden currency swings.
2.2 Encouraging Long-Term Contracts
Trade deals often span months or years, involving large shipments and complex payment structures. Stable currencies give both sides confidence to commit to long-term contracts, knowing the value of money will not drastically change by the time payments are due.
2.3 Reducing Transaction Costs
Instability forces businesses to spend more on financial hedging instruments like forwards, options, and swaps. While hedging reduces risk, it increases costs. Stable currencies eliminate much of this need, allowing businesses to allocate resources toward production and innovation.
2.4 Attracting Investment
Foreign direct investment (FDI) is sensitive to currency stability. A stable monetary environment reassures investors that profits will not be eroded by inflation or sudden devaluations, thereby making a country more attractive as a trading and investment partner.
3. Macroeconomic Benefits of Currency Stability in Global Trade
3.1 Promoting International Confidence
A currency that holds value over time inspires global trust. This trust is critical when that currency is used as a reserve currency, such as the US dollar or euro. When central banks and businesses believe in a currency’s long-term stability, they are more likely to hold reserves in it and settle trade transactions using it.
3.2 Supporting Balance of Payments
Stable currencies help maintain equilibrium in a nation’s balance of payments. Instability often results in trade imbalances, capital flight, and unsustainable debt levels. Predictable exchange rates ensure smoother trade flows and better financial planning.
3.3 Preventing Inflationary Spillovers
Currency instability often leads to inflationary shocks. For instance, if a country’s currency weakens dramatically, import prices rise, causing domestic inflation. Stable currencies reduce such inflationary spillovers, contributing to steady trade conditions.
3.4 Enhancing Monetary Cooperation
International institutions such as the International Monetary Fund (IMF) and World Bank rely on relatively stable currencies to structure loans, debt repayments, and trade financing. When major currencies are stable, global cooperation becomes easier and more effective.
4. Case Studies: Stable vs. Unstable Currencies
4.1 The US Dollar: A Global Benchmark
The US dollar remains the dominant reserve and trade currency due to its stability, deep financial markets, and backing by the world’s largest economy. Its reliability allows commodities like oil, gold, and agricultural goods to be priced in dollars, simplifying global trade.
4.2 The Euro: Regional Stability and Trade Growth
The euro has transformed trade within the European Union by eliminating exchange rate risks among member states. It has also emerged as the second most used global currency, reducing transaction costs and boosting intra-European trade.
4.3 Hyperinflation in Zimbabwe
Zimbabwe’s experience with hyperinflation in the 2000s highlights the destructive effects of unstable currencies. The Zimbabwean dollar lost credibility, trade collapsed, and the country had to adopt foreign currencies like the US dollar and South African rand to restore commerce.
4.4 Argentina’s Currency Volatility
Argentina has long suffered from repeated currency crises, high inflation, and debt defaults. This instability discourages foreign trade partners, reduces FDI, and forces businesses to use the dollar for trade settlements instead of the local peso.
5. Stable Currencies and Commodity Trade
5.1 Oil and Energy
Oil is the most traded commodity in the world, and it is priced almost exclusively in US dollars. This stability allows exporters and importers to hedge risks effectively. If the dollar were unstable, global energy markets would face severe uncertainty.
5.2 Gold and Precious Metals
Gold serves as a hedge against currency instability. Countries with volatile currencies often accumulate gold reserves to protect trade value. However, reliance on gold is less efficient than stable fiat currencies, as it ties up capital and reduces liquidity.
5.3 Agricultural Products
Farmers and traders benefit from stable pricing in global currencies. For example, wheat, soybeans, and coffee are priced in stable currencies, allowing agricultural exporters in developing countries to plan production cycles with greater certainty.
6. Financial Markets and Currency Stability
6.1 Forex Markets
The foreign exchange market thrives on liquidity and confidence. Stable currencies dominate forex trading, with the US dollar, euro, yen, and pound accounting for the majority of transactions. Volatile currencies are marginalized, limiting their global trade role.
6.2 International Debt Markets
Countries borrow internationally in stable currencies to secure favorable interest rates. Unstable currencies lead to higher risk premiums and borrowing costs, reducing a nation’s ability to participate in global trade financing.
6.3 Global Payment Systems
SWIFT and other payment networks prefer settlement in stable currencies, ensuring faster, cheaper, and more reliable cross-border transfers. This reinforces the dominance of currencies like the dollar and euro in world markets.
7. Risks of Currency Instability for Global Trade
7.1 Exchange Rate Volatility
Sharp fluctuations in exchange rates can wipe out profit margins in trade contracts. Exporters may receive less than expected, while importers may pay far more than budgeted.
7.2 Inflation and Purchasing Power Erosion
Unstable currencies often lead to inflation, which reduces real income and discourages consumer demand. Inflationary environments hurt exporters who rely on predictable purchasing power in foreign markets.
7.3 Capital Flight
Investors quickly withdraw funds from countries with unstable currencies, leading to reduced liquidity, higher interest rates, and weaker trade capacity.
7.4 Trade Wars and Protectionism
Currency instability often sparks accusations of “currency manipulation.” Countries may impose tariffs or restrictions to protect themselves, leading to trade wars that disrupt global supply chains.
Conclusion
The importance of stable currencies for world market trade cannot be overstated. Stability underpins trust, reduces risks, lowers transaction costs, and encourages long-term commitments in international commerce. From oil markets priced in dollars to regional trade facilitated by the euro, the benefits of currency stability ripple across the global economy. Conversely, unstable currencies create inflation, capital flight, and reduced trade opportunities, pushing countries into isolation and inefficiency.
In an interconnected world, stable currencies not only serve national interests but also sustain the health of the global trading system. As global finance evolves with digital currencies and multipolar power structures, the demand for currency stability will only intensify. Policymakers, central banks, and international institutions must therefore prioritize stability as a cornerstone of global trade prosperity.

Risk, Psychology & Performance in Global MarketsPart 1: Risk in Global Markets
1.1 Understanding Risk
In financial terms, risk refers to the probability of losing money or failing to achieve expected returns. Global markets face multiple layers of risk, such as:
Market Risk: The risk of losses due to fluctuations in stock prices, interest rates, currencies, or commodities.
Credit Risk: The possibility that a borrower defaults on debt.
Liquidity Risk: Difficulty in buying/selling assets without affecting their price.
Operational Risk: Failures in systems, processes, or human errors.
Geopolitical Risk: Wars, sanctions, trade disputes, or policy changes.
Systemic Risk: Collapse of interconnected institutions, like the 2008 financial crisis.
Each of these risks interacts differently depending on global conditions. For instance, rising U.S. interest rates strengthen the dollar, creating ripple effects in emerging markets, where currencies may depreciate and capital outflows increase.
1.2 Measuring Risk
Several tools and models measure financial risk:
Value at Risk (VaR): Estimates the maximum potential loss over a certain period with a given confidence level.
Beta Coefficient: Measures stock volatility relative to the overall market.
Stress Testing: Simulates extreme scenarios (e.g., oil at $200 or a sudden war).
Risk-Adjusted Metrics: Like the Sharpe ratio (return vs. volatility) and Sortino ratio (downside risk).
But risk is not just statistical; it is perceived differently across regions and cultures. A European fund manager may worry about ECB monetary policy, while an Asian investor may focus on currency volatility.
1.3 Risk Management Strategies
Global investors adopt multiple approaches:
Diversification: Spreading assets across regions, sectors, and instruments.
Hedging: Using derivatives (options, futures, swaps) to limit downside.
Position Sizing: Allocating only a portion of capital per trade to limit losses.
Stop-Loss Orders: Automatic triggers to exit positions when losses exceed a threshold.
Macro Hedging: Large funds may hedge exposure to entire regions or asset classes.
An important truth: risk can be managed, but never eliminated. The 2008 financial crisis, COVID-19 crash, and Russia-Ukraine war prove that unforeseen shocks can disrupt even the most sophisticated models.
Part 2: Psychology in Global Markets
2.1 Human Behavior and Trading
While quantitative models dominate headlines, human psychology drives global markets more than numbers. Investors are emotional beings, influenced by fear, greed, hope, and regret.
This is why markets often deviate from fundamentals. During bubbles (dot-com in 2000, housing in 2008, or cryptocurrencies in 2021), prices rise far above intrinsic value due to herd mentality. Conversely, panic selling during crashes can push prices far below fair value.
2.2 Behavioral Finance Theories
Prospect Theory (Kahneman & Tversky): People fear losses more than they value equivalent gains — a $100 loss feels worse than a $100 gain feels good.
Herd Behavior: Investors follow the crowd, assuming others know better.
Overconfidence Bias: Traders overestimate their skills, leading to excessive risk-taking.
Anchoring: Relying too much on initial information, like a stock’s IPO price.
Confirmation Bias: Seeking information that supports existing beliefs while ignoring contrary evidence.
Global markets are full of such psychological traps. For example, in 2020, when oil prices went negative for the first time, many retail traders underestimated risks and held losing positions, driven by hope of a quick rebound.
2.3 Emotions in Trading
The two strongest emotions in trading are:
Fear: Leads to panic selling, hesitation, and missed opportunities.
Greed: Encourages over-leveraging, chasing trends, and holding on too long.
Successful global traders learn to master these emotions. The key is not eliminating them (which is impossible) but managing and channeling them into rational decision-making.
2.4 Psychological Challenges in Global Markets
Information Overload: With 24/7 global markets, traders face endless news, data, and rumors. Filtering is essential.
Time Zone Stress: Global traders deal with Asian, European, and U.S. sessions, often leading to fatigue.
Cultural Differences: Risk tolerance varies by region; for example, U.S. traders are often more aggressive than Japanese institutional investors.
Uncertainty Fatigue: Continuous shocks (pandemics, wars, elections) can create stress and cloud judgment.
2.5 Building Mental Strength
To succeed in global markets, traders must build psychological resilience:
Discipline: Following a trading plan and avoiding impulsive actions.
Patience: Waiting for high-probability setups instead of chasing every move.
Emotional Regulation: Techniques like meditation, journaling, or structured routines.
Learning from Losses: Viewing mistakes as tuition fees for education.
Part 3: Performance in Global Markets
3.1 Defining Performance
Performance in markets is not just about absolute profits. It involves risk-adjusted returns, consistency, and sustainability.
For example:
A trader who makes 20% with controlled risk is performing better than one who makes 40% but risks everything.
Institutions are judged by their ability to generate alpha (returns above the benchmark).
3.2 Performance Metrics
Global investors use multiple measures:
Sharpe Ratio: Return vs. volatility.
Alpha & Beta: Outperformance relative to the market.
Max Drawdown: Largest peak-to-trough loss.
Win Rate vs. Risk-Reward Ratio: High win rates are useless if losses exceed gains.
Annualized Returns: Long-term performance consistency.
3.3 Performance Drivers
Performance in global markets depends on:
Knowledge: Understanding global economics, geopolitics, and industry cycles.
Execution: Timing trades and managing entries/exits.
Technology: Use of AI, algorithms, and big data for competitive edge.
Psychological Stability: Avoiding impulsive mistakes.
Risk Management: Limiting losses to survive long enough to benefit from winners.
3.4 Institutional vs. Retail Performance
Institutional Investors: Hedge funds, sovereign wealth funds, and pension funds have resources, research, and advanced tools, but are constrained by size and regulations.
Retail Traders: More flexible and agile, but prone to overtrading and psychological traps.
Both must balance risk, psychology, and performance — though in different ways.
Conclusion
Risk, psychology, and performance are the three pillars of global market participation.
Risk reminds us that uncertainty is inevitable and must be managed wisely.
Psychology teaches us that emotions shape markets more than numbers.
Performance highlights that success lies not in short-term gains but in consistent, risk-adjusted returns.
The integration of these factors is what separates amateurs from professionals, and short-term winners from long-term survivors.
As global markets evolve with technology, geopolitics, and changing investor behavior, mastering these three elements will remain the ultimate edge for traders and investors worldwide.

Regional & Country-Specific Global Markets1. North America
United States
The U.S. is the world’s largest economy and the beating heart of global finance. It hosts the New York Stock Exchange (NYSE) and NASDAQ, two of the biggest stock exchanges globally. The U.S. dollar serves as the world’s reserve currency, making American financial markets a benchmark for global trade and investment.
Strengths:
Deep and liquid capital markets
Technological innovation hubs (Silicon Valley, Boston, Seattle)
Strong consumer demand and advanced services sector
Risks:
High national debt levels
Political polarization affecting policy stability
Trade tensions with China and other countries
Key industries include technology, healthcare, energy, defense, and finance. U.S. policies on interest rates (through the Federal Reserve) ripple across every global market.
Canada
Canada’s economy is resource-heavy, with strengths in energy (oil sands, natural gas), mining (nickel, copper, uranium), and forestry. Toronto hosts a vibrant financial sector, and Canada’s stable political environment attracts global investors.
Strengths: Natural resources, stable banking sector
Challenges: Heavy reliance on U.S. trade, vulnerability to oil price swings
Mexico
As a bridge between North and Latin America, Mexico has growing manufacturing and automotive industries, heavily integrated with U.S. supply chains (especially under USMCA trade agreement). However, crime, corruption, and political risks remain concerns.
2. Europe
Europe is home to some of the world’s oldest markets and remains a global hub for trade, technology, and finance.
European Union (EU)
The EU is the world’s largest single market, with free movement of goods, people, and capital across 27 member states. The euro is the second-most traded currency globally.
Strengths: High levels of economic integration, advanced infrastructure, strong institutions
Weaknesses: Aging population, energy dependency (especially after the Russia-Ukraine war)
Germany
Germany is the powerhouse of Europe, leading in automobiles, engineering, chemicals, and renewable energy. Frankfurt is a major financial hub.
Opportunities: Transition to green energy, high-tech industries
Risks: Export dependency, demographic challenges
France
France blends industrial strength with luxury, fashion, and tourism industries. Paris is also a growing fintech hub.
United Kingdom
Post-Brexit, the UK operates independently of the EU, but London remains a global financial center. Britain leads in finance, pharmaceuticals, and services.
Eastern Europe
Countries like Poland, Hungary, and Romania are emerging as manufacturing hubs due to lower labor costs, attracting supply chain relocations from Western Europe.
3. Asia-Pacific
Asia-Pacific is the fastest-growing region, driven by China, India, and Southeast Asia.
China
China is the world’s second-largest economy and a manufacturing superpower. It dominates global supply chains in electronics, textiles, and increasingly, electric vehicles and renewable energy.
Strengths: Huge domestic market, government-led industrial policy, global export strength
Challenges: Debt, slowing growth, geopolitical tensions with the U.S.
Markets: Shanghai Stock Exchange, Shenzhen Stock Exchange, and Hong Kong as a global financial hub
India
India is one of the fastest-growing major economies, with strong potential in IT services, pharmaceuticals, digital payments, manufacturing, and renewable energy.
Strengths: Young population, digital transformation, strong services sector
Challenges: Infrastructure gaps, unemployment, bureaucratic hurdles
Markets: NSE and BSE, with rising global investor participation
Japan
Japan has a mature economy with global leadership in automobiles, electronics, and robotics. The Tokyo Stock Exchange is one of the largest in the world.
Strengths: Advanced technology, innovation, strong corporate governance
Challenges: Aging population, deflationary pressures
South Korea
South Korea is a global leader in semiconductors (Samsung, SK Hynix), automobiles (Hyundai, Kia), and consumer electronics. The KOSPI index reflects its market vibrancy.
Southeast Asia
Countries like Vietnam, Thailand, Indonesia, and Malaysia are emerging as new growth centers, benefiting from supply chain shifts away from China.
Vietnam: Manufacturing hub for electronics and textiles
Indonesia: Rich in resources like nickel (critical for EV batteries)
Singapore: Leading global financial and logistics hub
4. Latin America
Latin America’s markets are resource-driven but often volatile due to political instability and inflation.
Brazil
The largest economy in Latin America, Brazil is a major exporter of soybeans, coffee, iron ore, and oil. It also has a growing fintech and digital economy sector.
Argentina
Argentina struggles with recurring debt crises and inflation, but it has strong potential in lithium reserves, agriculture, and energy.
Chile & Peru
Both are resource-rich, particularly in copper and lithium, making them crucial for the global clean energy transition.
Mexico
(Already covered under North America, but plays a dual role in Latin America too.)
5. Middle East
The Middle East’s economies are largely oil-driven, but diversification is underway.
Saudi Arabia
Through Vision 2030, Saudi Arabia is reducing reliance on oil by investing in tourism, renewable energy, and technology. The Tadawul exchange is gaining global importance.
United Arab Emirates (UAE)
Dubai and Abu Dhabi are major global hubs for trade, logistics, and finance. Dubai International Financial Centre (DIFC) attracts global capital.
Qatar & Kuwait
Strong in natural gas exports and sovereign wealth investments.
Israel
Israel is a “startup nation,” leading in cybersecurity, AI, fintech, and biotech. Tel Aviv has a vibrant capital market.
6. Africa
Africa is rich in natural resources but has underdeveloped capital markets. Still, its youthful population and growing middle class present opportunities.
South Africa
The most advanced African economy with a diversified market in mining, finance, and retail. The Johannesburg Stock Exchange (JSE) is the continent’s largest.
Nigeria
Africa’s largest economy, dependent on oil exports, but also growing in fintech (mobile payments, digital banking).
Kenya
A leader in mobile money innovation (M-Pesa) and a gateway to East Africa.
Egypt
Strategically located, with a mix of energy, tourism, and agriculture. Cairo plays an important role in the region’s finance.
Opportunities & Risks Across Regions
Opportunities
Emerging markets (India, Vietnam, Nigeria) offer high growth potential.
Green energy and digital transformation create cross-border investment avenues.
Regional trade blocs (EU, ASEAN, USMCA, AfCFTA) enhance integration.
Risks
Geopolitical conflicts (Russia-Ukraine, U.S.-China tensions)
Currency fluctuations and debt crises in emerging markets
Climate change disrupting agriculture and infrastructure
Inflation and interest rate volatility
Conclusion
Regional and country-specific global markets together form the backbone of the international economic system. While North America and Europe remain financial powerhouses, Asia-Pacific is the fastest-growing engine, the Middle East is transforming from oil dependency to diversification, Latin America is leveraging its resources, and Africa stands as the future growth frontier.
For investors and businesses, the key lies in understanding the unique strengths, weaknesses, and risks of each market while recognizing their global interconnectedness. The future will likely see more multipolarity—where not just the U.S. and Europe, but also China, India, and regional blocs shape the course of the global economy.

Market Analysis & Risk GloballyPart 1: Foundations of Global Market Analysis
1.1 What is Market Analysis?
Market analysis is the process of studying market conditions to understand demand, supply, pricing, growth potential, and risk. Globally, it covers:
Macroeconomic indicators (GDP growth, inflation, interest rates, unemployment).
Sectoral performance (energy, technology, finance, manufacturing, etc.).
Trade flows (imports, exports, balance of payments).
Capital flows (FDI, portfolio investment, cross-border lending).
Policy frameworks (monetary and fiscal policies, trade agreements, taxation).
Sentiment indicators (consumer confidence, investor sentiment, market volatility).
Global market analysis differs from domestic market study because it requires factoring in cross-border interactions and systemic risks.
1.2 Levels of Global Market Analysis
Macro-Level (Country/Region Analysis)
GDP growth trends.
Sovereign credit ratings.
Fiscal and monetary stability.
Political stability.
Meso-Level (Industry/Sector Analysis)
Technology adoption.
Energy transitions.
Healthcare innovation.
Financial market growth.
Micro-Level (Company/Asset Analysis)
Firm profitability.
Market share.
ESG compliance.
Global supply chain dependencies.
1.3 Drivers of Global Markets
Globalization & Trade Agreements – WTO, regional FTAs, BRICS cooperation.
Monetary Policy Coordination – Fed, ECB, BoJ, PBoC influence liquidity.
Technology & Innovation – AI, blockchain, automation.
Energy Transition – Shift from fossil fuels to renewables.
Demographics – Aging populations in developed nations, young workforce in emerging markets.
Geopolitics – Conflicts, sanctions, alliances, and trade wars.
Part 2: Types of Global Market Risks
2.1 Financial Risks
Currency Risk – Fluctuations in exchange rates. Example: USD strength impacts emerging markets’ debt repayment.
Interest Rate Risk – Rising global rates increase borrowing costs.
Credit Risk – Default risk for sovereign and corporate bonds.
Liquidity Risk – Difficulty in converting assets to cash during crises.
2.2 Economic Risks
Recession Risk – Global slowdowns like the 2008 crisis or 2020 pandemic.
Inflation Risk – High inflation erodes consumer purchasing power.
Commodity Risk – Oil, gold, or food price volatility.
Trade Risk – Tariffs, supply chain disruptions, protectionism.
2.3 Political & Geopolitical Risks
Wars & Conflicts – Russia-Ukraine, Middle East tensions.
Sanctions – U.S. vs China or Iran sanctions impacting trade.
Regulatory Risks – Antitrust rules, tech regulations, ESG norms.
Nationalism & Populism – Rising protectionist policies.
2.4 Environmental & Climate Risks
Climate Change – Extreme weather, rising sea levels.
Energy Transition – Stranded fossil fuel assets.
Carbon Taxes & ESG Pressures – Costs for polluting industries.
2.5 Technological Risks
Cybersecurity Threats – Attacks on financial systems.
Disruption by AI & Automation – Job losses, structural unemployment.
Digital Currency Risks – Volatility of cryptocurrencies and CBDC adoption challenges.
2.6 Systemic Risks
Global Financial Contagion – Domino effects of crises.
Banking Failures – 2008 Lehman Brothers scenario.
Shadow Banking & Derivatives – Hidden risks in opaque markets.
Part 3: Tools & Frameworks for Global Market Analysis
3.1 Fundamental Analysis
GDP, CPI, PMI, balance of trade.
Sovereign bond yields.
Corporate earnings across regions.
3.2 Technical Analysis (Global Indices & Commodities)
Nifty, Dow Jones, FTSE, Nikkei, Shanghai Composite.
Oil, gold, copper, wheat charts.
Volume profile and volatility indexes (VIX).
3.3 Sentiment & Behavioral Analysis
Fear & Greed Index.
Global consumer sentiment surveys.
Hedge fund positioning reports.
3.4 Risk Management Tools
Hedging Instruments: Futures, options, swaps.
Diversification: Across geographies and asset classes.
Value-at-Risk (VaR): Measuring downside risk.
Stress Testing: Scenario analysis of global shocks.
Part 4: Regional Perspectives in Market Risk
4.1 United States
Largest economy, reserve currency issuer.
Risks: Fed tightening, tech regulation, political polarization.
4.2 Europe
Eurozone debt crisis memories.
Brexit aftershocks.
Energy dependency on imports.
4.3 Asia
China: Property crisis, tech crackdown, geopolitical tensions.
India: High growth but vulnerable to oil shocks.
Japan: Aging population, yen volatility.
4.4 Emerging Markets
High growth, high volatility.
Dollar debt risk.
Vulnerability to capital flight.
4.5 Middle East & Africa
Oil dependency.
Political instability.
Transition to non-oil economies.
Part 5: Case Studies of Global Market Risks
5.1 2008 Global Financial Crisis
Trigger: U.S. housing bubble, Lehman Brothers collapse.
Risk lesson: Leverage + complex derivatives = systemic collapse.
5.2 COVID-19 Pandemic (2020)
Trigger: Health crisis turned economic crisis.
Risk lesson: Black swan events can halt global trade overnight.
5.3 Russia-Ukraine War (2022 onwards)
Trigger: Geopolitical conflict.
Risk lesson: Commodity shocks + sanctions reshape supply chains.
5.4 China Property Crisis (Evergrande)
Trigger: Overleveraged real estate.
Risk lesson: Emerging market debt crises have global spillovers.
Part 6: Mitigating Global Market Risks
6.1 For Investors
Diversification across regions.
Use of derivatives for hedging.
Regular portfolio rebalancing.
ESG-aligned investing for long-term resilience.
6.2 For Corporations
Hedging currency & commodity exposure.
Building resilient supply chains.
Geographic diversification of operations.
Cybersecurity investments.
6.3 For Policymakers
Coordinated monetary & fiscal responses.
Transparent regulations.
Climate-resilient policies.
Stronger global institutions (IMF, WTO, G20).
Part 7: Future of Global Market Risks
De-globalization vs. Re-globalization – Supply chains may shorten, but digital globalization accelerates.
Climate Emergency – Strongest long-term risk to global markets.
Rise of Multipolar World – U.S., China, India, and EU competing for dominance.
Digital Finance Expansion – AI, blockchain, CBDCs reshaping finance.
Black Swan Events – Pandemics, cyberwars, or systemic collapses cannot be ruled out.
Conclusion
Global market analysis and risk management are intertwined disciplines. The world economy is no longer a sum of separate markets but a single interconnected system. A shock in one corner—whether it be a pandemic, war, financial collapse, or natural disaster—spreads rapidly across others.
To thrive in such an environment, investors, companies, and governments must adopt dynamic risk management strategies, embrace diversification, and remain vigilant about macro and micro-level changes.
Ultimately, global market analysis is not about predicting the future with certainty but about building resilience against uncertainty.
$HPE with a bullish outlook following its earnings #StocksThe PEAD projected a bullish outlook for NYSE:HPE after a positive over reaction following its earnings release, with an expected accuracy of 57.14%.