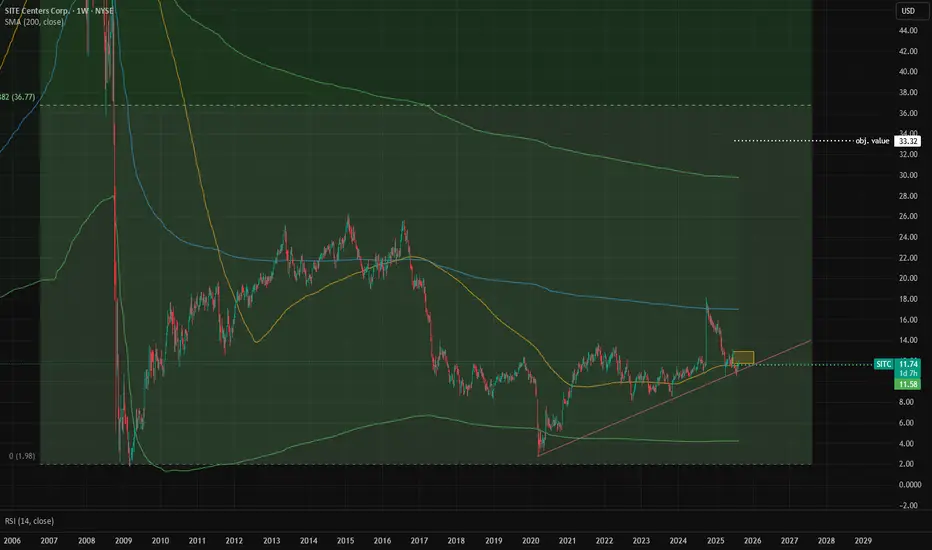
SITC: Fundamental Analysis +182%With 2024 revenue of $ 277 millions, Site Centers is an american owner and manager of open-air shopping centers. EverStock identifies a fundamental revaluation potential of +182 %.
Valuation at 1.2 x net earnings :
Currently valued at $ 622 millions in market capitalization, Site Centers posted a profit of $ 532 millions in its latest fiscal year (2024).
Balance sheet and debt :
In the company annual report, tangible net asset value stood at $ 505 millions, giving a market capitalization / tangible net asset value ratio of 1.23.
The gearing ratio is good, at 0.60. (Total financial debt / net tangible assets valuation).
Current share price : 11.83 $
Target price : 33.32 $
Upside potential : +182 % (including dividende income)
Dividend : Next dividende (special) 3.25 $ paid on 29 august
Yield : 27.47 % (special dividend)
Tradingideas
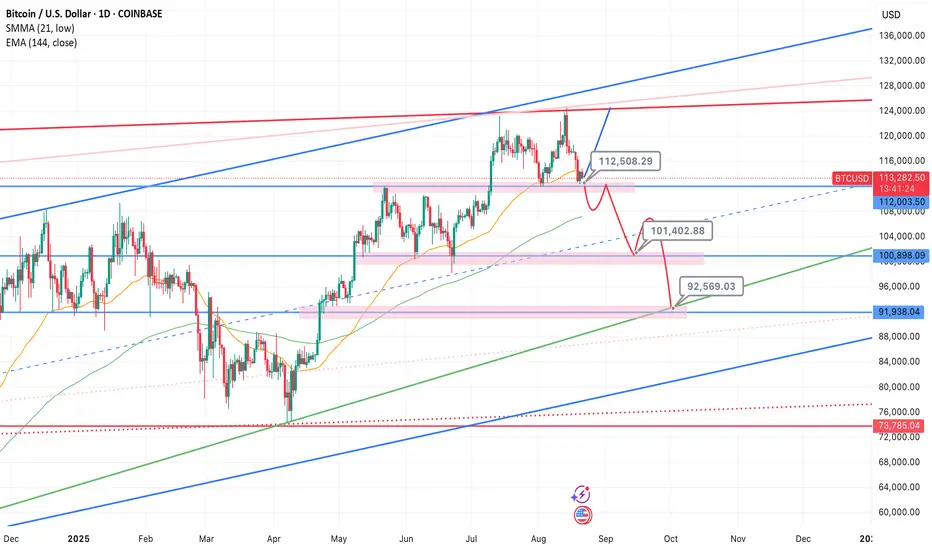
Bitcoin Holds the Line – $112.2K Is Key SupportAccording to on-chain data, BTC’s move to $125K was driven by short liquidations, not new capital inflow, therefore a rejection of highs into further consolidation was expected, after confirming by technical analysis reversal pattern. When rallies aren’t backed by real inflows, the downside tends to be ruthless. After rally printed a new all-time high, then tactical traders triggered a chain of long liquidations.
So the question now is—was this just a flush before a fresh leg up? Or is this market still unwinding?
I remain bullish from current levels. The recent drop looks more like a healthy correction than a trend reversal.
Key Risk:
The bullish scenario breaks if $112,200 support fails and we see a confirmed reversal structure (not just one wick/ short-term candle, but several days of follow-through).
Support Levels to Watch (Buy-the-Dip Zones):
$112,500
$101,400
$92,600
Macro View:
Liquidity signals continue to improve, profit-taking is largely complete, and we don’t see a cycle top yet. Long-term structure remains bullish, and this pullback should be seen as an accumulation opportunity.
Disclaimer:
Markets are subject to unpredictable events and the randomness of markets, please use appropriate risk management. DYOR
GOLD ROUTE MAP UPDATEHey Everyone,
Quick follow up update on our 1H chart idea:
After completing both our Bullish target at 3352 and Bearish target at 3327, we now have a lock below 3327 which opened the swing range down towards 3304. We did get the drop, but not the full test of 3304 before price turned back up.
Right now, we are seeing a break back above 3327 and heading towards a retest of 3352 once again. This is in line with our ongoing plan to buy dips, but we must also keep in mind that the swing range remains open. This means any swings can still clear the gap left in that 3304 region before moving higher.
So, while we continue to buy dips, we need to be mindful that open swing ranges can extend moves in either direction.
We will keep the above in mind when taking buys from dips. Our updated levels and weighted levels will allow us to track the movement down and then catch bounces up.
We will continue to buy dips using our support levels taking 20 to 40 pips. As stated before each of our level structures give 20 to 40 pip bounces, which is enough for a nice entry and exit. If you back test the levels we shared every week for the past 24 months, you can see how effectively they were used to trade with or against short/mid term swings and trends.
The swing range give bigger bounces then our weighted levels that's the difference between weighted levels and swing ranges.
BULLISH TARGET
3352 - DONE
EMA5 CROSS AND LOCK ABOVE 3352 WILL OPEN THE FOLLOWING BULLISH TARGETS
3374
EMA5 CROSS AND LOCK ABOVE 3374 WILL OPEN THE FOLLOWING BULLISH TARGET
3398
EMA5 CROSS AND LOCK ABOVE 3398 WILL OPEN THE FOLLOWING BULLISH TARGET
3422
BEARISH TARGETS
3327 - DONE
EMA5 CROSS AND LOCK BELOW 3327 WILL OPEN THE SWING RANGE
3304
3281
As always, we will keep you all updated with regular updates throughout the week and how we manage the active ideas and setups. Thank you all for your likes, comments and follows, we really appreciate it!
Mr Gold
GoldViewFX

GOLD ROUTE MAP UPDATEHey Everyone,
Another great day on the charts with our chart idea playing out like we analysed.
After hitting our Bullish target at 3352 yesterday we stated that we had no ema5 cross and lock confirming the rejection and that we are now seeing price head towards the bearish target at 3327.
Bearish target has now copmpleted at 3327 just like we said. We will now look for ema5 lock below to open the swing range or failure to lock will see price test the upper Goldturns again.
We will see levels tested side by side until one of the weighted levels break and lock to confirm direction for the next range.
We will keep the above in mind when taking buys from dips. Our updated levels and weighted levels will allow us to track the movement down and then catch bounces up.
We will continue to buy dips using our support levels taking 20 to 40 pips. As stated before each of our level structures give 20 to 40 pip bounces, which is enough for a nice entry and exit. If you back test the levels we shared every week for the past 24 months, you can see how effectively they were used to trade with or against short/mid term swings and trends.
The swing range give bigger bounces then our weighted levels that's the difference between weighted levels and swing ranges.
BULLISH TARGET
3352 - DONE
EMA5 CROSS AND LOCK ABOVE 3352 WILL OPEN THE FOLLOWING BULLISH TARGETS
3374
EMA5 CROSS AND LOCK ABOVE 3374 WILL OPEN THE FOLLOWING BULLISH TARGET
3398
EMA5 CROSS AND LOCK ABOVE 3398 WILL OPEN THE FOLLOWING BULLISH TARGET
3422
BEARISH TARGETS
3327 - DONE
EMA5 CROSS AND LOCK BELOW 3327 WILL OPEN THE SWING RANGE
3304
3281
As always, we will keep you all updated with regular updates throughout the week and how we manage the active ideas and setups. Thank you all for your likes, comments and follows, we really appreciate it!
Mr Gold
GoldViewFX

BTCUSDT SHORT SETUPBitcoin H4 TF Trade Mapping Update
Selling Now On Fair Value Gap Price 115.400
Next Zone Selling CISD PRICE 117.00
Next Selling BTC Zone Order Block 118.00 / 119,300
Manage Trades Properly And Follow For More Charts And Trades

Dogecoin Correction Going According to Plan🐶 CRYPTO:DOGEUSD is unfolding a 3-wave pullback, with the equal legs zone at $0.204–$0.195 acting as the next key support.
📈 A bullish reaction is expected from this area as the structure completes.
Will Dogecoin Hold the August Low at $0.18?
Are you ready to load your bags when it matters most?
🎯 Smart money waits for structure.

GOLD ROUTE MAP UPDATEHey Everyone,
Great start to the week with our chart idea playing out as analysed.
We got our Bullish target hit at 3352 followed with no ema5 cross an d lock confirming the rejection. We are now seeing price head towards the bearish target.
We will see levels tested side by side until one of the weighted levels break and lock to confirm direction for the next range.
We will keep the above in mind when taking buys from dips. Our updated levels and weighted levels will allow us to track the movement down and then catch bounces up.
We will continue to buy dips using our support levels taking 20 to 40 pips. As stated before each of our level structures give 20 to 40 pip bounces, which is enough for a nice entry and exit. If you back test the levels we shared every week for the past 24 months, you can see how effectively they were used to trade with or against short/mid term swings and trends.
The swing range give bigger bounces then our weighted levels that's the difference between weighted levels and swing ranges.
BULLISH TARGET
3352 - DONE
EMA5 CROSS AND LOCK ABOVE 3352 WILL OPEN THE FOLLOWING BULLISH TARGETS
3374
EMA5 CROSS AND LOCK ABOVE 3374 WILL OPEN THE FOLLOWING BULLISH TARGET
3398
EMA5 CROSS AND LOCK ABOVE 3398 WILL OPEN THE FOLLOWING BULLISH TARGET
3422
BEARISH TARGETS
3327
EMA5 CROSS AND LOCK BELOW 3327 WILL OPEN THE SWING RANGE
3304
3281
As always, we will keep you all updated with regular updates throughout the week and how we manage the active ideas and setups. Thank you all for your likes, comments and follows, we really appreciate it!
Mr Gold
GoldViewFX

GOLD 4H CHART ROUTE MAP UPDATE & TRADING PLAN FOR THE WEEKHey Everyone,
Please see our updated 4h chart levels and targets for the coming week.
We are seeing price play between two weighted levels with a gap above at 3361 and a gap below at 3293. We will need to see ema5 cross and lock on either weighted level to determine the next range.
We will see levels tested side by side until one of the weighted levels break and lock to confirm direction for the next range.
We will keep the above in mind when taking buys from dips. Our updated levels and weighted levels will allow us to track the movement down and then catch bounces up.
We will continue to buy dips using our support levels taking 20 to 40 pips. As stated before each of our level structures give 20 to 40 pip bounces, which is enough for a nice entry and exit. If you back test the levels we shared every week for the past 24 months, you can see how effectively they were used to trade with or against short/mid term swings and trends.
The swing range give bigger bounces then our weighted levels that's the difference between weighted levels and swing ranges.
BULLISH TARGET
3361
EMA5 CROSS AND LOCK ABOVE 3361 WILL OPEN THE FOLLOWING BULLISH TARGETS
3424
EMA5 CROSS AND LOCK ABOVE 3424 WILL OPEN THE FOLLOWING BULLISH TARGET
3499
BEARISH TARGETS
3293
EMA5 CROSS AND LOCK BELOW 3293 WILL OPEN THE SWING RANGE
3236
3171
EMA5 CROSS AND LOCK BELOW 3171 WILL OPEN THE SECONDARY SWING RANGE
3089
2996
As always, we will keep you all updated with regular updates throughout the week and how we manage the active ideas and setups. Thank you all for your likes, comments and follows, we really appreciate it!
Mr Gold
GoldViewFX
GOLD DAILY CHART ROUTE MAPDaily Chart Update
Range Still in Control: Same Boundaries, Same Play
Not much has changed since last week. Price continues to rotate within the 3272–3433 range, respecting the structure with precision. The week’s action stayed contained inside this 170+ pip zone, reinforcing the dominance of the range.
As we head into the new week, the outlook remains the same: watching 3433 as upside resistance, while 3272 continues to anchor support. Until one side breaks and holds, range trading strategies remain the focus.
Current Outlook
🔹 Range Still Active
Price is firmly contained between 3272 and 3433. A decisive break outside this box is still required for a trend shift.
🔹 Same Rejections
The market has yet to sustain above 3433. Resistance stands firm.
🔹 Support Holding
As long as 3272 holds, bias stays neutral-to-bullish within the range, with eyes on another potential 3433 retest.
Updated Key Levels
📉 Support – 3272
Still the key pivot and buy zone unless a confirmed breakdown occurs.
📈 Resistance – 3433
Unchanged as the main ceiling. A break and hold above would shift dynamics, but until then, sellers remain in control at this level.
Thanks as always for your support,
Mr Gold
GoldViewFX

GOLD WEEKLY CHART MID/LONG TERM ROUTE MAPHey Everyone,
Please see our weekly chart update.
3387 Rejected, 3482 Gap Still Open
Following up on last week’s close above 3387, price has since shown rejection at that same level, leaving the 3482 gap still unfilled from the previous candle body. This pullback now highlights the 3281 gap below as support, keeping the broader structure intact but tempering the immediate upside momentum.
We’re watching for a potential re-challenge of 3387 before the path toward 3482 can resume. Until then, the market remains range-bound within these structural pivots.
Current Outlook
🔹 3387 Rejection
Despite previous week’s close above, price could not sustain higher, confirming 3387 as a tough barrier in the short term.
🔹 3281 as Key Support
The gap below sits at 3281, which remains the anchor pivot. As long as it holds, buyers have the chance to reload.
🔹 3482 Still Open
The unfilled gap to 3482 remains the long-term upside target. A re-test and hold above 3387 is needed before momentum can extend toward that objective.
Updated Levels to Watch
📉 Support – 3281
Critical base. A breakdown here would shift structure bearish.
📈 Resistance – 3387
Now the immediate barrier. Expect this to be re-challenged before further upside can develop.
📈 Upside Gap Target – 3482
Still open from previous structure. Comes into play only if 3387 can be cleared decisively.
Plan:
Price is consolidating between 3281 and 3387, with 3482 waiting above. Until 3387 is reclaimed on a closing basis, range trading remains the play. A clean break above flips bias bullish toward 3482, while failure at 3281 risks a deeper rotation.
Thanks as always for your support,
Mr Gold
GoldViewFX

Stock Options Buying Strategy Post-Expiry Stock Selection Strategy:
1. Source: NSE Derivatives
• Navigate to: NSE → Derivatives → Most Active Securities
• Download the Excel file listing active securities.
2. Filtering Criteria:
• Only consider Stock Futures (exclude indices and options).
• Sort by % Change (Descending) to catch the biggest movers.
• Focus on stocks with >1% change in futures — indicating fresh institutional interest.
• Execute this 2 days after F&O expiry for cleaner post-rollover trends.
3. Technical Filters for Longs (Options Buying Focus):
• Monthly RSI > 60 – confirms long-term bullish momentum.
• Daily RSI crossing 60 – entry trigger.
• Price above 9 EMA and 200 SMA – trend confirmation.
• Price above POC and VAH (from Volume Profile on daily chart between last swing low → high) – shows strength above value.
________________________________________
📊 Volume Profile Insight:
• POC (Point of Control): Highest volume area → fair value.
• VAH (Value Area High): Upper limit of 70% volume zone.
• Price above both suggests price acceptance at higher levels, potentially indicating institutional accumulation.
________________________________________
🔍 Watchlist from NSE Derivatives (Example Set):
Stock Remarks
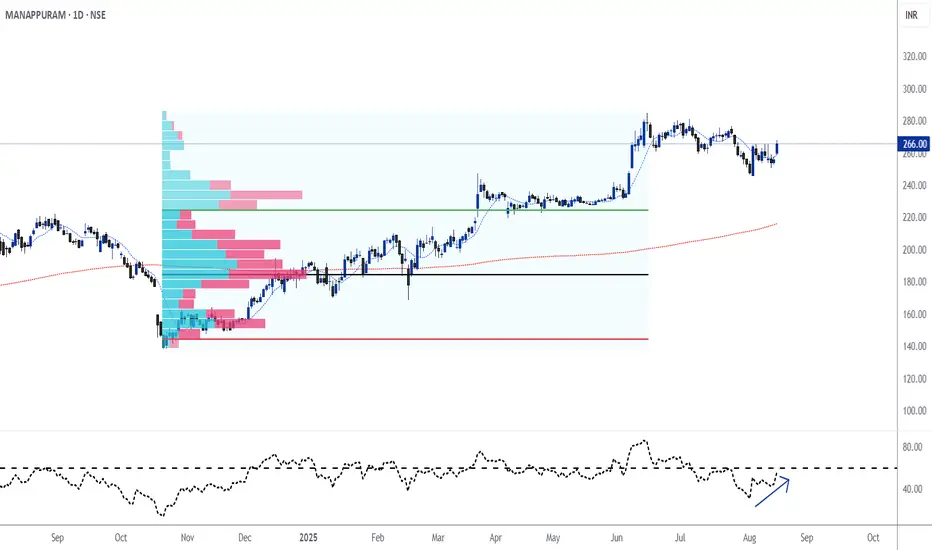
MUTHOOTFIN NBFC theme, rising futures activity
MANAPPURAM Similar to above, often follows Muthoot
KALYANKJIL Jewellery sector, festive momentum?
ETERNAL Lesser known, check chart and liquidity
INFY Surprising entry, despite weak sectoral sentiment
________________________________________
🧠 Noteworthy Insight: INFY
• if Infosys (INFY) is showing up in the high futures activity list despite weak IT sector performance, it could indicate:
o Contrarian institutional positioning
o Pre-emptive long build-up ahead of some event
o Or possibly short covering (check OI change with price)
GOLD ROUTE MAP UPDATEHey Everyone,
Great finish to the week with our chart idea playing out as analyzed. In yesterday’s update, we stated that the 3329 full gap remained open and that we had another cross-and-lock confirming this.
That gap has now been completed perfectly and also gave the reaction and bounce in line with our plan to buy dips. As long as this level holds, we should continue to see bounces. A cross-and-lock below this level, however, will open up the swing range.
We will keep the above in mind when taking buys from dips. Our updated levels and weighted levels will allow us to track the movement down and then catch bounces up.
We will continue to buy dips using our support levels taking 20 to 40 pips. As stated before each of our level structures give 20 to 40 pip bounces, which is enough for a nice entry and exit. If you back test the levels we shared every week for the past 24 months, you can see how effectively they were used to trade with or against short/mid term swings and trends.
The swing range give bigger bounces then our weighted levels that's the difference between weighted levels and swing ranges.
BULLISH TARGET
3403
EMA5 CROSS AND LOCK ABOVE 3403 WILL OPEN THE FOLLOWING BULLISH TARGETS
3422
EMA5 CROSS AND LOCK ABOVE 3422 WILL OPEN THE FOLLOWING BULLISH TARGET
3439
BEARISH TARGETS
3377 - DONE
EMA5 CROSS AND LOCK BELOW 3377 WILL OPEN THE FOLLOWING BEARISH TARGET
3354 - DONE
EMA5 CROSS AND LOCK BELOW 3354 WILL OPEN THE FOLLOWING BEARISH TARGET
3329 - DONE
EMA5 CROSS AND LOCK BELOW 3329 WILL OPEN THE SWING RANGE
3304
3281
We will now come back Sunday with a full multi timeframe analysis to prepare for next week’s setups, including updated views on the higher timeframes, EMA alignments, and structure expectations going forward.
Thanks again for all your likes, comments, and follows.
Wishing you all a fantastic weekend!!
Mr Gold
GoldViewFX

GOLD IFVG SHORT SETUP TRADE DETAIL :
IFVG ?
Inverse Fair Value Gap 💡
Thats We Are Selling Gold At 3350 / 3354
Stoploss 3360
Take Profit Levels : 3345, 3340, 3335, 3330
Manage Your Trade Properly Follow Us For More Trades

GOLD ROUTE MAP UPDATEHey Everyone,
We are still seeing price action within the retracement range. The full gap below at 3329 remains open from the previous cross-and-lock, and we now have another cross-and-lock confirming this.
We expect a bounce at this level unless we see a further cross-and-lock below 3329, which would open the swing range. Until then, we also expect this level to provide a reaction.
We will keep the above in mind when taking buys from dips. Our updated levels and weighted levels will allow us to track the movement down and then catch bounces up.
We will continue to buy dips using our support levels taking 20 to 40 pips. As stated before each of our level structures give 20 to 40 pip bounces, which is enough for a nice entry and exit. If you back test the levels we shared every week for the past 24 months, you can see how effectively they were used to trade with or against short/mid term swings and trends.
The swing range give bigger bounces then our weighted levels that's the difference between weighted levels and swing ranges.
BULLISH TARGET
3403
EMA5 CROSS AND LOCK ABOVE 3403 WILL OPEN THE FOLLOWING BULLISH TARGETS
3422
EMA5 CROSS AND LOCK ABOVE 3422 WILL OPEN THE FOLLOWING BULLISH TARGET
3439
BEARISH TARGETS
3377 - DONE
EMA5 CROSS AND LOCK BELOW 3377 WILL OPEN THE FOLLOWING BEARISH TARGET
3354 - DONE
EMA5 CROSS AND LOCK BELOW 3354 WILL OPEN THE FOLLOWING BEARISH TARGET
3329
EMA5 CROSS AND LOCK BELOW 3329 WILL OPEN THE SWING RANGE
3304
3281
As always, we will keep you all updated with regular updates throughout the week and how we manage the active ideas and setups. Thank you all for your likes, comments and follows, we really appreciate it!
Mr Gold
GoldViewFX

OP - Chance for +70%After weekly close we can see the volume coming in. On the chart we have resistance which if we break through then we can expect price 1.4 which is +70% from now.
If I have some advice for leverage trading I think its better to wait for daily close and then hunt retest if happens.
Rotations of money started already and I don't think is it a case for long run. We need to act, take profit and watch something else.
Like if you like analysis and idea.
Ivan

GOLD ROUTE MAP UPDATEHey everyone,
Following up on yesterday’s update for our 1H chart route map:
The key retracement range continued to provide support, and we saw the reactionary bounce we expected.
Right now, we’re range-bound between 3329 and 3354.
As long as 3329 holds, we can expect continued bounces, tracking the movement upward.
We will keep the above in mind when taking buys from dips. Our updated levels and weighted levels will allow us to track the movement down and then catch bounces up.
We will continue to buy dips using our support levels taking 20 to 40 pips. As stated before each of our level structures give 20 to 40 pip bounces, which is enough for a nice entry and exit. If you back test the levels we shared every week for the past 24 months, you can see how effectively they were used to trade with or against short/mid term swings and trends.
The swing range give bigger bounces then our weighted levels that's the difference between weighted levels and swing ranges.
BULLISH TARGET
3403
EMA5 CROSS AND LOCK ABOVE 3403 WILL OPEN THE FOLLOWING BULLISH TARGETS
3422
EMA5 CROSS AND LOCK ABOVE 3422 WILL OPEN THE FOLLOWING BULLISH TARGET
3439
BEARISH TARGETS
3377 - DONE
EMA5 CROSS AND LOCK BELOW 3377 WILL OPEN THE FOLLOWING BEARISH TARGET
3354 - DONE
EMA5 CROSS AND LOCK BELOW 3354 WILL OPEN THE FOLLOWING BEARISH TARGET
3329
EMA5 CROSS AND LOCK BELOW 3329 WILL OPEN THE SWING RANGE
3304
3281
As always, we will keep you all updated with regular updates throughout the week and how we manage the active ideas and setups. Thank you all for your likes, comments and follows, we really appreciate it!
Mr Gold
GoldViewFX

Gold prices have been hit hardGold prices have been hit hard, following a sharp rally over the weekend as traders await further clarity from the Trump administration on its gold import tax policy.
The commodity had been exempted from the tax since April, but investors are still waiting for clearer signals on its long-term direction.
Joseph Cavatoni, senior market specialist for North America at the World Gold Council, said that different segments of the gold market are operating stably while waiting for further information.
According to Jim Wyckoff, senior analyst at Kitco Metals, the market rallied last week on the uncertainty surrounding tariffs, but is now seeing a sell-off as investors await more clarity from the White House.
On the economic data front, the US will release the consumer price index (CPI) on Tuesday and the producer price index (PPI) on Thursday. Wyckoff said that inflation data this week is particularly important after the weak jobs report. If the numbers come in higher than expected, the US Federal Reserve (Fed) could pause its interest rate cut plan in September, which would put downward pressure on gold prices.
GOLD ROUTE MAP UPDATEHey Everyone,
Once again our chart idea is playing out in true level to level fashion.
We started with our bearish gap hit at 3377, followed with ema5 cross and lock opening 3354, which was also hit perfectly.
We are now seeing price play in the retracement range with 3329 also open for test. We expect reaction on this retracement zone, also keeping in mind the Bullish gap above, inline with our plans to buy dips.
We will keep the above in mind when taking buys from dips. Our updated levels and weighted levels will allow us to track the movement down and then catch bounces up.
We will continue to buy dips using our support levels taking 20 to 40 pips. As stated before each of our level structures give 20 to 40 pip bounces, which is enough for a nice entry and exit. If you back test the levels we shared every week for the past 24 months, you can see how effectively they were used to trade with or against short/mid term swings and trends.
The swing range give bigger bounces then our weighted levels that's the difference between weighted levels and swing ranges.
BULLISH TARGET
3403
EMA5 CROSS AND LOCK ABOVE 3403 WILL OPEN THE FOLLOWING BULLISH TARGETS
3422
EMA5 CROSS AND LOCK ABOVE 3422 WILL OPEN THE FOLLOWING BULLISH TARGET
3439
BEARISH TARGETS
3377 - DONE
EMA5 CROSS AND LOCK BELOW 3377 WILL OPEN THE FOLLOWING BEARISH TARGET
3354 - DONE
EMA5 CROSS AND LOCK BELOW 3354 WILL OPEN THE FOLLOWING BEARISH TARGET
3329
EMA5 CROSS AND LOCK BELOW 3329 WILL OPEN THE SWING RANGE
3304
3281
As always, we will keep you all updated with regular updates throughout the week and how we manage the active ideas and setups. Thank you all for your likes, comments and follows, we really appreciate it!
Mr Gold
GoldViewFX

Dow Jones 15m Chart Analysis Current Position – Price is consolidating in the 44,242–44,283 demand zone after a bullish push, showing buyers defending support.
Upside Levels – Break and close above 44,394 can trigger momentum toward 44,515 (major liquidity zone).
Downside Risk – Failure to hold 44,242 likely sends price to 44,026 first, then 43,826 (previous swing low demand).
Market Structure – Short-term bullish above 44,242; turns bearish below it. Volume breakout confirmation is key for conviction.
Trading Approach – Range trade between 44,242–44,394 until a confirmed breakout; trade with tight stops to avoid whipsaws
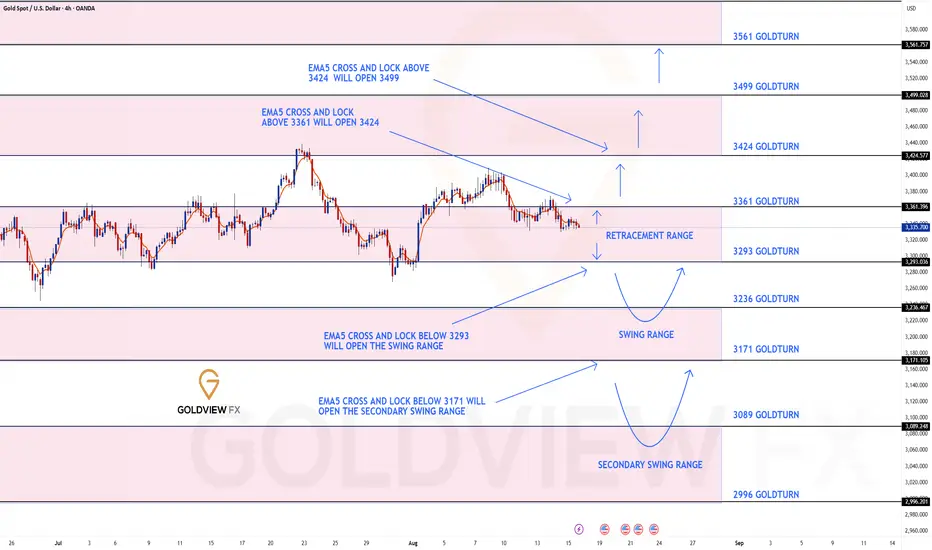
GOLD 4H CHART ROUTE MAP UPDATE & TRADING PLAN FOR THE WEEKHey Everyone,
Please see our updated 4h chart levels and targets for the coming week.
We are seeing price play between two weighted levels with a gap above at 3424 and a gap below at 3371. We will need to see ema5 cross and lock on either weighted level to determine the next range.
We will see levels tested side by side until one of the weighted levels break and lock to confirm direction for the next range.
We will keep the above in mind when taking buys from dips. Our updated levels and weighted levels will allow us to track the movement down and then catch bounces up.
We will continue to buy dips using our support levels taking 20 to 40 pips. As stated before each of our level structures give 20 to 40 pip bounces, which is enough for a nice entry and exit. If you back test the levels we shared every week for the past 24 months, you can see how effectively they were used to trade with or against short/mid term swings and trends.
The swing range give bigger bounces then our weighted levels that's the difference between weighted levels and swing ranges.
BULLISH TARGET
3424
EMA5 CROSS AND LOCK ABOVE 3424 WILL OPEN THE FOLLOWING BULLISH TARGETS
3499
EMA5 CROSS AND LOCK ABOVE 3499 WILL OPEN THE FOLLOWING BULLISH TARGET
3561
BEARISH TARGETS
3371
EMA5 CROSS AND LOCK BELOW 3371 WILL OPEN THE FOLLOWING BEARISH TARGET
3293
EMA5 CROSS AND LOCK BELOW 3293 WILL OPEN THE SWING RANGE
3236
3171
EMA5 CROSS AND LOCK BELOW 3171 WILL OPEN THE SECONDARY SWING RANGE
3089
3001
As always, we will keep you all updated with regular updates throughout the week and how we manage the active ideas and setups. Thank you all for your likes, comments and follows, we really appreciate it!
Mr Gold
GoldViewFX

GOLD DAILY CHART ROUTE MAPHey Everyone,
Daily Chart Update
Another Clean Rejection: Structure Still Dominates
Following up on the recent price action last week, the 3372 support level continued to provide support aligned perfectly with the channel half-line, giving us the bounce that continued all the way up to 3409, just short of the 3433 resistance, which once again remains open for a potential test.
We remain in the same structured range, with price still rotating between 3272 and 3433, a 170+ pip zone that continues to deliver high-probability trade setups.
Here’s where we are now:
🔹 Range Still Active
Price is respecting the 3272–3433 boundaries with precision. Until we get a decisive break and hold outside this range, range bound strategies remain in play.
🔹 No Breakout = Clean Rejection
The failure to sustain above 3433 confirms resistance is still valid. We're watching EMA5 for potential breakout confirmation, until then, the bias stays neutral within the range.
🔹 Channel Half-line Bounce
That rejection into 3272 also matched the channel half line, and the bounce there further cements this area as critical support. The latest rally to 3397 reinforces the strength of this pivot.
Updated Key Levels
📉 Support – 3272
Still the major pivot. Buy zones remain valid here unless we see a confirmed breakdown.
📈 Resistance – 3433
Now clearly tested and rejected more than once. Any clean break and hold above could change the dynamic, but until then, it’s solid resistance with 3397 as support.
Thanks as always for your support.
Mr Gold
GoldViewFX

GOLD WEEKLY CHART MID/LONG TERM ROUTE MAPHey Everyone,
Weekly Chart Update = Gap Completed, Levels Playing Out Perfectly
Just a quick follow up on the ongoing weekly structure, the precision in level respect continues to be impressive, with price action unfolding exactly as we’ve been mapping.
After the previous bounce from 3281, price moved cleanly back up and completed the gap at 3387 last week, exactly as projected in last weeks post. This time, we now have a candle body close above 3387, which changes the dynamic and leaves 3482 open as a long term upside target. An EMA5 lock from here would further confirm the breakout potential.
Updated Structural Notes:
🔹 3281 Support Holds Again
Textbook reaction. Once again, 3281 provided the perfect launch point, reinforcing its strength as a key weekly pivot.
🔹 Gap at 3387 Completed
Price didn’t just revisit 3387, it closed above it on the weekly candle body. This shifts the bias toward potential breakout continuation rather than another immediate rejection.
🔹 3482 Now on the Radar
With 3387 cleared on a closing basis, the next major upside objective becomes 3482, aligning with the broader channel structure and unfilled weekly target. EMA5 confirmation on the long side could accelerate this move.
Updated Levels to Watch:
📉 Support – 3281
Key long-term pivot and buy zone. As long as this holds, dips remain constructive.
📈 Resistance Turned Support – 3387
Now potentially acting as a base. Watching retests here for hold confirmation.
📈 Upside Target – 3482
Primary long-term resistance now in focus if 3387 support holds and momentum sustains.
Plan:
The breakout above 3387 opens a new chapter for this range. We now watch for confirmation that 3387 has flipped to support. Holding here keeps 3482 firmly in play, while any decisive break back below could send us rotating toward 3281 again. Structure still leads, but bias shifts bullish with this weekly close.
Thanks as always for your continued support.
Mr Gold
GoldViewFX

GOLD ROUTE MAP UPDATEHey Everyone,
Great finish to the week with our chart idea playing out as analysed.
We complete dour Bullish target 3370 followed with cross and lock confirmation opening 3392 also completed this week. We now also have a cross and lock above 3392 opening 3416.
We will keep the above in mind when taking buys from dips. Our updated levels and weighted levels will allow us to track the movement down and then catch bounces up.
BULLISH TARGET
3370 - DONE
EMA5 CROSS AND LOCK ABOVE 3370 WILL OPEN THE FOLLOWING BULLISH TARGETS
3392 - DONE
EMA5 CROSS AND LOCK ABOVE 3392 WILL OPEN THE FOLLOWING BULLISH TARGET
3416
We will now come back Sunday with a full multi timeframe analysis to prepare for next week’s setups, including updated views on the higher timeframes, EMA alignments, and structure expectations going forward.
Thanks again for all your likes, comments, and follows.
Wishing you all a fantastic weekend!!
Mr Gold
GoldViewFX
