GOLD ROUTE MAP UPDATEHey Everyone,
Great finish after completing each of our targets throughout the week with ema5 lock confirmations on our proprietary Goldturn levels. Yesterday we finished off with 3388 and stated we would look for ema5 cross and lock above 3388 to open 3428 and failure to lock will follow with a rejection.
- This played out perfectly with the cross and lock confirmation and then the target hit at 3428 completing the range.
BULLISH TARGET
3318 - DONE
EMA5 CROSS AND LOCK ABOVE 3318 WILL OPEN THE FOLLOWING BULLISH TARGETS
3352 - DONE
EMA5 CROSS AND LOCK ABOVE 3352 WILL OPEN THE FOLLOWING BULLISH TARGET
3388 - DONE
EMA5 CROSS AND LOCK ABOVE 3388 WILL OPEN THE FOLLOWING BULLISH TARGET
3428 - DONE
We’ll be back now on Sunday with our multi-timeframe analysis and trading plans for the week ahead. Thanks again for all your likes, comments, and follows.
Wishing you all a fantastic weekend!!
Mr Gold
GoldViewFX
Tradingideas

GOLD ROUTE MAP UPDATEHey Everyone,
Another PITASTIC day on the charts, with our analysis playing out perfectly.
Yesterday after completing the target at 3352, we stated that we’ll be watching for a confirmed cross and lock above 3352 for a continuation. We got the cross and lock above 3352 opening 3388.
- 3388 was hit perfectly today completing this target. We will now look for a ema5 cross and lock above 3388 for a continuation. If price fails to lock above, we could see rejections leading back into the lower Goldturns, where we’ll look for support and bounce.
We will keep the above in mind when taking buys from dips. Our updated levels and weighted levels will allow us to track the movement down and then catch bounces up.
We will continue to buy dips using our support levels taking 20 to 40 pips. As stated before each of our level structures give 20 to 40 pip bounces, which is enough for a nice entry and exit. If you back test the levels we shared every week for the past 24 months, you can see how effectively they were used to trade with or against short/mid term swings and trends.
The swing range give bigger bounces then our weighted levels that's the difference between weighted levels and swing ranges.
BULLISH TARGET
3318 - DONE
EMA5 CROSS AND LOCK ABOVE 3318 WILL OPEN THE FOLLOWING BULLISH TARGETS
3352 - DONE
EMA5 CROSS AND LOCK ABOVE 3352 WILL OPEN THE FOLLOWING BULLISH TARGET
3388 - DONE
EMA5 CROSS AND LOCK ABOVE 3388 WILL OPEN THE FOLLOWING BULLISH TARGET
3428
EMA5 CROSS AND LOCK ABOVE 3428 WILL OPEN THE FOLLOWING BULLISH TARGET
3478
BEARISH TARGETS
3281
EMA5 CROSS AND LOCK BELOW 3281 WILL OPEN THE FOLLOWING BEARISH TARGET
3254
EMA5 CROSS AND LOCK BELOW 3254 WILL OPEN THE FOLLOWING BEARISH TARGET
3210
EMA5 CROSS AND LOCK BELOW 3210 WILL OPEN THE SWING RANGE
3179
3146
As always, we will keep you all updated with regular updates throughout the week and how we manage the active ideas and setups. Thank you all for your likes, comments and follows, we really appreciate it!
Mr Gold
GoldViewFX

GOLD ROUTE MAP UPDATEHey Everyone,
Another solid day on the charts, with our analysis unfolding exactly as anticipated.
As mentioned yesterday, after the cross and lock above 3318, we identified a gap at 3352 that remained unfilled, acting as a magnet for price action. Since then, price has been consolidating in a tight range between 3318 and 3352.
Today, we saw a perfect move up, completing the target at 3352. From here, we’ll be watching for a confirmed cross and lock above 3352 for a continuation. If price fails to lock above, we could see rejections leading back into the lower Goldturns, where we’ll look for support and bounce.
We will keep the above in mind when taking buys from dips. Our updated levels and weighted levels will allow us to track the movement down and then catch bounces up.
We will continue to buy dips using our support levels taking 20 to 40 pips. As stated before each of our level structures give 20 to 40 pip bounces, which is enough for a nice entry and exit. If you back test the levels we shared every week for the past 24 months, you can see how effectively they were used to trade with or against short/mid term swings and trends.
The swing range give bigger bounces then our weighted levels that's the difference between weighted levels and swing ranges.
BULLISH TARGET
3318 - DONE
EMA5 CROSS AND LOCK ABOVE 3318 WILL OPEN THE FOLLOWING BULLISH TARGETS
3352 - DONE
EMA5 CROSS AND LOCK ABOVE 3352 WILL OPEN THE FOLLOWING BULLISH TARGET
3388
EMA5 CROSS AND LOCK ABOVE 3388 WILL OPEN THE FOLLOWING BULLISH TARGET
3428
EMA5 CROSS AND LOCK ABOVE 3428 WILL OPEN THE FOLLOWING BULLISH TARGET
3478
BEARISH TARGETS
3281
EMA5 CROSS AND LOCK BELOW 3281 WILL OPEN THE FOLLOWING BEARISH TARGET
3254
EMA5 CROSS AND LOCK BELOW 3254 WILL OPEN THE FOLLOWING BEARISH TARGET
3210
EMA5 CROSS AND LOCK BELOW 3210 WILL OPEN THE SWING RANGE
3179
3146
As always, we will keep you all updated with regular updates throughout the week and how we manage the active ideas and setups. Thank you all for your likes, comments and follows, we really appreciate it!
Mr Gold
GoldViewFX

XAUUSD - Risk Management - How much % do you risk daily?⭐It’s not about how much you know. It’s about how much you risk.⭐
The lesson you only learn after blowing up your account.
You’ve read hundreds of articles, watched countless hours of YouTube.
Joined 5 groups.Subscribed to 10 channels.
Maybe you even tried a prop firm challenge and failed it in two days.
Paid for mentorship.
Kinda know structure. See price action.
And yet… your account still shrinks faster than your patience.
Because at the end of the day:
It’s not about what you know. It’s about how much you risk.
⚠️ The trade was right. Your lot size wasn’t.
You had a good setup.
Price reached your zone. There was confluence.
Everything looked clean — until your lot size showed up to ruin everything.
Example: You entered with 0.50 lots on a $200 account, using a 40-pip stop loss.
Let’s break it down:
• $0.50 per pip × 40 pips = $200 loss
• You lost 100% of your account on a single trade
The strategy didn’t fail.
The size did.
💡 Why “risking 1%” works on paper — but not on XAUUSD
Every trading book, coach, and Twitter guru screams:
“Just risk 1-3% per trade.”
Cool. Sounds disciplined.
But in Gold, most traders use tight stop losses — 20, 30, maybe 50 pips.
To stay within 1% risk with such a small SL, your lot has to be bigger.
And that’s where accounts explode.
Gold doesn’t move like EURUSD.
It spikes, wicks, manipulates, and throws fakeouts for fun.
Experienced traders know that sometimes a 150–180 pip SL isn’t weak — it’s smart.
It’s not about “being wrong.” It’s about giving the setup room to breathe.
📌 What actually works
Instead of risking 1-3%, many experienced traders manage risk more conservatively:
• 0.25%–0.35% per trade is more sustainable
• 0.50% is rarely reserved for highly valid, high-confluence setups only
This allows for:
• More breathing room
• Emotional control
• Less panic during drawdown
• And more trades that survive manipulation
🧠 Your position size is your psychology, exposed.
Most traders don’t lose because they picked the wrong zone.
They lose because they sized their trade like they were trying to get rich overnight.
You want to measure discipline?
Forget strategy.
Look at how much someone risks per trade.
A 0.10 lot on a $500 account means control.
A 1.00 lot on the same account means desperation or showoff.
🧮 A quick example to make it real
You have a $1,000 account.
You risk 0.20% — that’s $2/pip.
Your stop loss is 50 pips.
That means you can trade 0.10 lot safely.
Now you’re giving the trade room to work — and if it fails, you’re still in the game.
That’s the difference between blowing up and showing up.
📉 Bonus risk reminder: Daily exposure ≠ per-trade risk
If you’re taking 2–3 trades per day, don’t risk 0.30% on each one. That’s not low risk — that’s stacking exposure. ✅ What you should do: Decide your daily risk limit (let’s say 0.30%), then split it across your planned entries. 2 trades? → 0.15% each 3 trades? → 0.10% each
🎯 Final thoughts
Your setup doesn’t need to be perfect.
You do.
→ Risk according to volatility, not emotion
→ Respect your stop loss, and scale your lot size to match
→ Don’t try to force profits out of every candle
The best traders aren’t always right —
they just size smart enough to be wrong and still come back.
If this lesson helped you today and brought you more clarity:
Drop a 🚀 and follow us✅ for more published ideas.

MPHASIS at Key Zone !!This is Daily chart of MPHASIS.
MPHASIS having a good law of polarity at 2700-2720 range.
If MPHASIS gives a breakout, the potential upside targets are 2,840 and 3,000 levels.
If L.O.P is sustain then , we may see lower prices in MPHASIS.
Thank You !!

Latest Published Ideas by UsersThis is not a trading idea, but some form of representing my desire, about to see again on TradingView, the great function that can help and improve the vision and knowledge about the current situation on the market, so effectively.
If you an individual user, member, and friend of TradingView, like this idea,
Click Boost Symbol!
Thank you! Have a great day.

GOLD ROUTE MAP UPDATEHey Everyone,
Quick update following on from yesterday’s post.
As expected, we got the push up after the EMA5 cross and lock above 3318, but price just fell short of our bullish target at 3352, leaving it open. This level now acts as a magnet, with price currently playing between 3318 and 3352, creating a tight range.
We're watching closely for tests on both 3318 and 3352, with direction confirmed only by EMA5 cross and lock. The gap to 3352 still remains, so any bullish momentum should aim to fill this cleanly.
Until one of these levels breaks with confirmation, we’ll likely continue seeing choppy movement in this range. We’ll keep using dips into support for intraday buys, targeting our usual 20–40 pip bounce trades as structure allows.
Once again, thank you all for your ongoing support and engagement, we’ll continue to keep you updated throughout the week, as price unfolds and setups confirm.
Mr Gold
GoldViewFX

Gold Trading Strategy June 10Gold price in D1 frame reacted at EMA and Trend zone yesterday and bounced back but at the end of the day still closed below the 3335 breakout zone. The downtrend can still continue as long as 3335 remains stable today.
Looking at H1, it is still in a fairly clear downtrend. 3327 is the area that is currently in dispute. 3310 is the resistance zone that Gold broke through in the Asian session. To BUY this area, you must wait for price reaction and confirmation from the candle. Breaking 3309, Gold will head towards today's important support 3295. This is a good zone for BUY signal. The daily support zone around 3275 will prevent any excessive price slide of Gold.
On the other hand, when the buyers push the price strongly through 3327, you must wait for the US session resistance around 3338 yesterday for a SELL signal. (H1 does not break through 3328, we can set up SELL with the confirmation of selling force) Breaking 3338, the bearish structure will no longer exist, the market will switch to a short-term uptrend towards 3364.
Resistance 3337-3364-3374
Support 3310-3295-3275
Wish you successful trading. If you do not understand the strategy clearly, you can contact me for support.

RAIN INDUSTRIES at Good Support.This is 4 hour chart of RAIN INDUSTRIES.
Stock is forming a Symmetrical Triangle Pattern.pattern lower boundary expected to act as a strong support level 142-145.
IF this level is sustain , then we may see higher prices in Rain industries.
Thank You !!

GOLD ROUTE MAP UPDATEHey Everyone,
Great start tot he week with our chart idea playing out, as analysed.
We started today with our bullish target at 3318 hit, followed with ema5 cross and lock opening 3352. Rejection here will see lower open Goldturns tested for support and bounce and further cross and locks will confirm a continuation.
We will see levels tested side by side until one of the weighted levels break and lock to confirm direction for the next range.
We will keep the above in mind when taking buys from dips. Our updated levels and weighted levels will allow us to track the movement down and then catch bounces up.
We will continue to buy dips using our support levels taking 20 to 40 pips. As stated before each of our level structures give 20 to 40 pip bounces, which is enough for a nice entry and exit. If you back test the levels we shared every week for the past 24 months, you can see how effectively they were used to trade with or against short/mid term swings and trends.
The swing range give bigger bounces then our weighted levels that's the difference between weighted levels and swing ranges.
BULLISH TARGET
3318 - DONE
EMA5 CROSS AND LOCK ABOVE 3318 WILL OPEN THE FOLLOWING BULLISH TARGETS
3352
EMA5 CROSS AND LOCK ABOVE 3352 WILL OPEN THE FOLLOWING BULLISH TARGET
3388
EMA5 CROSS AND LOCK ABOVE 3388 WILL OPEN THE FOLLOWING BULLISH TARGET
3428
EMA5 CROSS AND LOCK ABOVE 3428 WILL OPEN THE FOLLOWING BULLISH TARGET
3478
BEARISH TARGETS
3281
EMA5 CROSS AND LOCK BELOW 3281 WILL OPEN THE FOLLOWING BEARISH TARGET
3254
EMA5 CROSS AND LOCK BELOW 3254 WILL OPEN THE FOLLOWING BEARISH TARGET
3210
EMA5 CROSS AND LOCK BELOW 3210 WILL OPEN THE SWING RANGE
3179
3146
As always, we will keep you all updated with regular updates throughout the week and how we manage the active ideas and setups. Thank you all for your likes, comments and follows, we really appreciate it!
Mr Gold
GoldViewFX

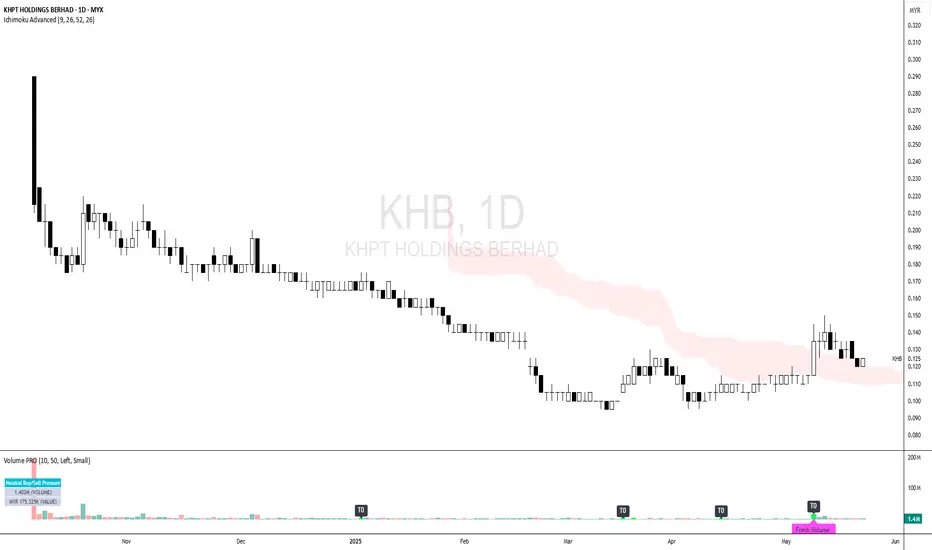
KHB - Downtrend Phase is FINISHED ?KHB - CURRENT PRICE : RM0.125
KHB was in downtrend since its listing day on 08 OCTOBER 2024. Recently the stock price rise with a bullish candlestick on 09 MEI 2025. The stock is making higher high and higher low. This indicates that the downtrend may end. At current price, it gives an attractive RISK REWARD RATIO.
ENTRY PRICE : RM0.125
TARGET PRICE : RM0.140 (+12%) and RM0.150 (+20)
SUPPORT : RM0.115 (-8%) --- The low of long white candle
GOLD 1H CHART ROUTE MAP UPDATE & TRADING PLAN FOR THE WEEKHey Everyone,
Please see our updated 1h chart levels and targets for the coming week.
We are seeing price play between two weighted levels with a gap above at 3318 and a gap below at 3281. We will need to see ema5 cross and lock on either weighted level to determine the next range.
We will see levels tested side by side until one of the weighted levels break and lock to confirm direction for the next range.
We will keep the above in mind when taking buys from dips. Our updated levels and weighted levels will allow us to track the movement down and then catch bounces up.
We will continue to buy dips using our support levels taking 20 to 40 pips. As stated before each of our level structures give 20 to 40 pip bounces, which is enough for a nice entry and exit. If you back test the levels we shared every week for the past 24 months, you can see how effectively they were used to trade with or against short/mid term swings and trends.
The swing range give bigger bounces then our weighted levels that's the difference between weighted levels and swing ranges.
BULLISH TARGET
3318
EMA5 CROSS AND LOCK ABOVE 3318 WILL OPEN THE FOLLOWING BULLISH TARGETS
3352
EMA5 CROSS AND LOCK ABOVE 3352 WILL OPEN THE FOLLOWING BULLISH TARGET
3388
EMA5 CROSS AND LOCK ABOVE 3388 WILL OPEN THE FOLLOWING BULLISH TARGET
3428
EMA5 CROSS AND LOCK ABOVE 3428 WILL OPEN THE FOLLOWING BULLISH TARGET
3478
BEARISH TARGETS
3281
EMA5 CROSS AND LOCK BELOW 3281 WILL OPEN THE FOLLOWING BEARISH TARGET
3254
EMA5 CROSS AND LOCK BELOW 3254 WILL OPEN THE FOLLOWING BEARISH TARGET
3210
EMA5 CROSS AND LOCK BELOW 3210 WILL OPEN THE SWING RANGE
3179
3146
As always, we will keep you all updated with regular updates throughout the week and how we manage the active ideas and setups. Thank you all for your likes, comments and follows, we really appreciate it!
Mr Gold
GoldViewFX

GOLD 4H CHART ROUTE MAP UPDATE & TRADING PLAN FOR THE WEEKHey Everyone,
Please see our updated 4h chart levels and targets for the coming week.
We are seeing price play between two weighted levels with a gap above at 3376 and a gap below at 3302. We will need to see ema5 cross and lock on either weighted level to determine the next range.
We will see levels tested side by side until one of the weighted levels break and lock to confirm direction for the next range.
We will keep the above in mind when taking buys from dips. Our updated levels and weighted levels will allow us to track the movement down and then catch bounces up.
We will continue to buy dips using our support levels taking 20 to 40 pips. As stated before each of our level structures give 20 to 40 pip bounces, which is enough for a nice entry and exit. If you back test the levels we shared every week for the past 24 months, you can see how effectively they were used to trade with or against short/mid term swings and trends.
The swing range give bigger bounces then our weighted levels that's the difference between weighted levels and swing ranges.
BULLISH TARGET
3376
EMA5 CROSS AND LOCK ABOVE 3376 WILL OPEN THE FOLLOWING BULLISH TARGETS
3438
EMA5 CROSS AND LOCK ABOVE 3438 WILL OPEN THE FOLLOWING BULLISH TARGET
3498
EMA5 CROSS AND LOCK ABOVE 3498 WILL OPEN THE FOLLOWING BULLISH TARGET
3551
BEARISH TARGETS
3302
EMA5 CROSS AND LOCK BELOW 3302 WILL OPEN THE FOLLOWING BEARISH TARGET
3235
EMA5 CROSS AND LOCK BELOW 3235 WILL OPEN THE SWING RANGE
3171
3113
EMA5 CROSS AND LOCK BELOW 3113 WILL OPEN THE SECONDARY SWING RANGE
3045
2987
As always, we will keep you all updated with regular updates throughout the week and how we manage the active ideas and setups. Thank you all for your likes, comments and follows, we really appreciate it!
Mr Gold
GoldViewFX

GOLD DAILY CHART ROUTE MAPHey Everyone,
Following up on our previous analysis, price action has continued to respect our Goldturn channel beautifully. After the strong move to 3272, we saw another push toward the channel top near 3433. However, just before completing the move, price was met with another sharp rejection, highlighting the strength of the range and the precision of our channel levels.
The key takeaway here is that 3272 is still providing solid support, and the price remains well contained within our defined range between 3272 and 3433. This reaffirms our strategy of buying dips near the lower end of the range rather than chasing strength near the top.
We remain focused on trading within this range, using our weighted Goldturns to guide entries on the lower timeframes (1H and 4H). As long as the structure holds, we’ll continue to target quick 30–40 pip intraday moves while positioning ourselves for a potential breakout scenario when the time is right.
This is the beauty of our Goldturn channels, drawn using weighted averages instead of pure price action. This unique approach helps us clearly identify fake outs and real breakouts, cutting out much of the noise that usually confuses traders.
Keep an eye on how price behaves around 3272 and 3433. A clean break and close above the channel top would be significant but until then, range play remains our primary game plan.
Let’s stay patient and disciplined.
Mr Gold
GoldViewFX

GOLD WEEKLY CHART MID/LONG TERM ROUTE MAPHey Everyone,
Following up on last week’s chart update, we saw another perfect test of the channel top, right in line with our Goldturn Channel expectations. The new weekly candle completed the channel top challenge with precision, once again confirming the strength of our resistance levels.
As anticipated, the rejection came in cleanly, followed by a correction into EMA5 detachment, which halted just short of the 3281 level, a crucial axis we've been tracking for multiple weeks. This level continues to act as firm support, holding price within an evolving range.
We’re now seeing price action contained between 3281 and 3387, with potential for expansion higher as the ascending channel continues to rise. This expanding structure offers more room for strategic positioning, especially as price coils tighter within the upper band.
The 3387 gap remains active and is an obvious magnet if momentum builds. As long as we stay above the half line and especially above 3281, we remain in buy the dip mode, favouring long setups off our intraday Goldturns for quick 20 40 pip scalps or swing entries when conditions align.
Should we see a deeper pullback or close below 3281, we’ll reassess potential movement toward the lower channel boundary. Until then, the structure remains bullish within the channel.
The Goldturn methodology continues to prove its worth, cutting through noise and keeping us aligned with the real structure of the market.
Stay sharp, stay patient.
MR GOLD
GOLDVIEWFX

GOLD ROUTE MAP UPDATEHey Everyone,
A great finish to the week with our 1H chart idea finishing off with the rejection from 3389 with no further cross and lock above that level confirming the rejection. We continued to see a drop into the lower Goldturns with each level giving 20 to 40 pip bounces.,
We are now seeing 3334 Goldturn being tested. Lets see if we get the 20 to 40 pip reactional bounce before close of play.
We’ll be back now on Sunday with our multi-timeframe analysis and trading plans for the week ahead. Thanks again for all your likes, comments, and follows.
Wishing you all a fantastic weekend!!
MR GOLD

GOLD 1H CHART ROUTE MAP UPDATEHey Everyone,
As anticipated, the market structure continues to respect our key levels and EMA5 dynamics to the letter.
After the clean bounce from 3334 into 3359, price did indeed push back toward 3389 for the retest, just as outlined. Once again ema5 failed to cross and lock above 3389, confirming rejection again. It’s important to highlight that price did retest 3389 exactly as projected, completing the range once again.
Crucially, no further EMA5 cross and lock above 3389 was seen, reconfirming the rejection and driving price back into the lower Goldturns, which we will now look for support and bounce off these levels.
The structure continues to unfold with precision, showing once again how effective our level based framework is when paired with EMA5 confirmations. This setup keeps us well aligned with market momentum.
As always, we remain focused and continue to buy dips using our support levels, capturing those 20 to 40 pip opportunities. As we’ve proven time and again, each level gives enough of a bounce for a quality entry and exit.
We encourage everyone to backtest our levels, we’ve shared them weekly for the past 3 years , and the data speaks for itself. These levels continue to work brilliantly with both short/mid term trends and countertrends.
BULLISH TARGET 3305 – ✅ DONE
EMA5 CROSS AND LOCK ABOVE 3305 WILL OPEN THE FOLLOWING BULLISH TARGETS
3334 – ✅ DONE
3359 – ✅ DONE
3389 – ✅ DONE (retested as forecasted)
EMA5 CROSS AND LOCK ABOVE 3389 WILL OPEN THE FOLLOWING BULLISH TARGET
3428
EMA5 CROSS AND LOCK ABOVE 3428 WILL OPEN THE FOLLOWING BULLISH TARGET
3478
BEARISH TARGETS 3271
EMA5 CROSS AND LOCK BELOW 3271 WILL OPEN THE FOLLOWING BEARISH TARGET
3227
EMA5 CROSS AND LOCK BELOW 3227 WILL OPEN THE SWING RANGE
3185
3146
Stay sharp, manage risk, and trust the levels. We’ll continue providing updates as the structure develops further.
Thank you again for all your likes, comments, and continued support.
Mr Gold
GoldViewFX

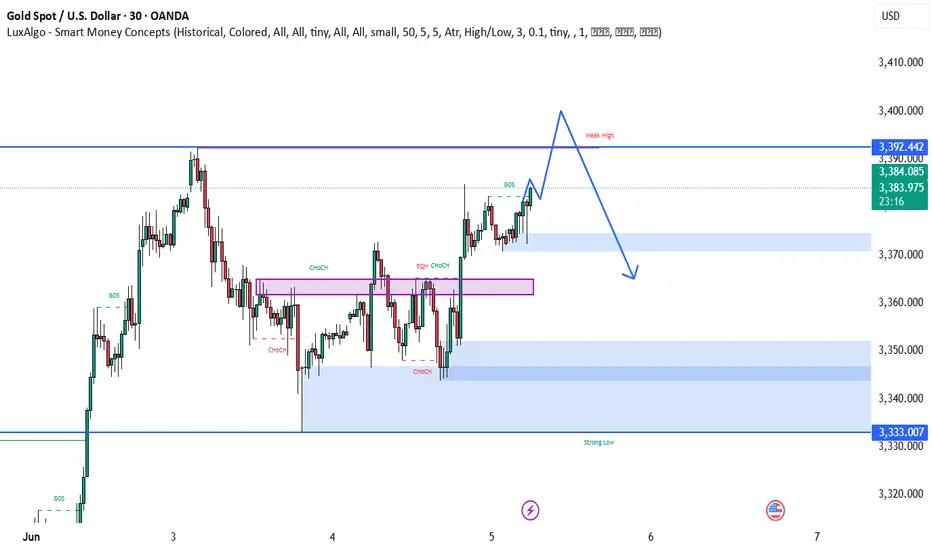
BEST XAUUSD M30 BUY AND SELL SUTUP FOR TODAY📊 Gold is currently showing bullish strength with a break above key structure levels and multiple CHoCH confirmations. Price is approaching a weak high near 3,392, which may act as a liquidity target before potential reversal. 🔄 After sweeping this high, a bearish move could unfold, aiming for the demand zones between 3,350–3,333 where buyers may step back in. 🧠 Traders should prepare for a liquidity grab scenario, with bullish continuation likely invalidated if price closes below the strong demand. ⚠️ Watch price action closely near the weak high and key imbalance zones. 🚀🔁📉
GOLD ROUTE MAP UPDATEHey Everyone,
Another powerful day in the markets with our chart idea unfolding exactly as anticipated.
In yesterday’s update, we highlighted that all our targets 3305, 3334, and 3359 were hit following the EMA5 cross and lock confirmation. We also pointed out the EMA5 lock above 3359, opening a clear gap to 3389, which was also hit perfectly. The absence of a further EMA5 lock above confirmed a precise rejection, sending price back down into the lower Goldturns for support, just as projected. We then had the bounce off the 3334 level, another clean reaction, just like we stated.
Now today, after testing and bouncing from 3334 into 3359, price is now charging back toward 3389 for a potential retest, as that level remains open once again.
The structure is playing out beautifully, we will stick to the plan, and manage risk wisely.
We will continue to buy dips using our support levels taking 20 to 40 pips and track the movement with ema5 lock or rejection. As stated before each of our level structures give 20 to 40 pip bounces, which is enough for a nice entry and exit. If you back test the levels we shared every week for the past 24 months, you can see how effectively they were used to trade with or against short/mid term swings and trends.
The swing range give bigger bounces then our weighted levels that's the difference between weighted levels and swing ranges.
BULLISH TARGET
3305 - DONE
EMA5 CROSS AND LOCK ABOVE 3305 WILL OPEN THE FOLLOWING BULLISH TARGETS
3334 - DONE
EMA5 CROSS AND LOCK ABOVE 3334 WILL OPEN THE FOLLOWING BULLISH TARGET
3359 - DONE
EMA5 CROSS AND LOCK ABOVE 3359 WILL OPEN THE FOLLOWING BULLISH TARGET
3389 - DONE
EMA5 CROSS AND LOCK ABOVE 3389 WILL OPEN THE FOLLOWING BULLISH TARGET
3428
EMA5 CROSS AND LOCK ABOVE 3428 WILL OPEN THE FOLLOWING BULLISH TARGET
3478
BEARISH TARGETS
3271
EMA5 CROSS AND LOCK BELOW 3271 WILL OPEN THE FOLLOWING BEARISH TARGET
3227
EMA5 CROSS AND LOCK BELOW 3227 WILL OPEN THE SWING RANGE
3185
3146
As always, we will keep you all updated with regular updates throughout the week and how we manage the active ideas and setups. Thank you all for your likes, comments and follows, we really appreciate it!
Mr Gold
GoldViewFX

PIRAMAL ENTERPRISES LTDThis is the Weekly Chart of PEL !!
PEl is moving in an Ascending Channel pattern on the weekly chart.
PEL is following a HH–HL structure in the channel in Daily chart support at 1040-1050 range, confirming a bullish trend continuation.
Based on historical price behavior, the stock has
previously delivered a 74% return from its swing low, reaching the 1500–1520 range.
Thank You!!

GOLD ROUTE MAP UPDATEHey Everyone,
Another powerful day in the markets with our chart idea unfolding exactly as anticipated.
In yesterday’s update, we highlighted that all our targets, 3305, 3334, and 3359 were hit following the EMA5 cross and lock confirmation. We also pointed out the EMA5 lock above 3359, now left 3389 open.
✅ Today, that 3389 level was hit to perfection.
The absence of a further EMA5 lock above confirmed a precise rejection, sending price back down into the lower Goldturns for support and bounce inline with our plans to buy dips.
We will continue to buy dips using our support levels taking 20 to 40 pips and track the movement with ema5 lock or rejection. As stated before each of our level structures give 20 to 40 pip bounces, which is enough for a nice entry and exit. If you back test the levels we shared every week for the past 24 months, you can see how effectively they were used to trade with or against short/mid term swings and trends.
The swing range give bigger bounces then our weighted levels that's the difference between weighted levels and swing ranges.
BULLISH TARGET
3305 - DONE
EMA5 CROSS AND LOCK ABOVE 3305 WILL OPEN THE FOLLOWING BULLISH TARGETS
3334 - DONE
EMA5 CROSS AND LOCK ABOVE 3334 WILL OPEN THE FOLLOWING BULLISH TARGET
3359 - DONE
EMA5 CROSS AND LOCK ABOVE 3359 WILL OPEN THE FOLLOWING BULLISH TARGET
3389 - DONE
EMA5 CROSS AND LOCK ABOVE 3389 WILL OPEN THE FOLLOWING BULLISH TARGET
3428
EMA5 CROSS AND LOCK ABOVE 3428 WILL OPEN THE FOLLOWING BULLISH TARGET
3478
BEARISH TARGETS
3271
EMA5 CROSS AND LOCK BELOW 3271 WILL OPEN THE FOLLOWING BEARISH TARGET
3227
EMA5 CROSS AND LOCK BELOW 3227 WILL OPEN THE SWING RANGE
3185
3146
As always, we will keep you all updated with regular updates throughout the week and how we manage the active ideas and setups. Thank you all for your likes, comments and follows, we really appreciate it!
Mr Gold
GoldViewFX

GOLD ROUTE MAP UPDATEHey Everyone,
Great start to the week with our chart idea playing out as analysed.
We started the day with our Bullish target hit at 3305 followed with ema5 cross and lock confirmation for 3334, which was hit perfectly with a further lock opening 3359 also completed.
We now have a cross and lock above 3359 opening 3389. We will continue to track the movement using cross and lock and any rejections on the levels will see price test the lower Goldturns for support and bounce.
We will keep the above in mind when taking buys from dips. Our updated levels and weighted levels will allow us to track the movement down and then catch bounces up.
We will continue to buy dips using our support levels taking 20 to 40 pips. As stated before each of our level structures give 20 to 40 pip bounces, which is enough for a nice entry and exit. If you back test the levels we shared every week for the past 24 months, you can see how effectively they were used to trade with or against short/mid term swings and trends.
The swing range give bigger bounces then our weighted levels that's the difference between weighted levels and swing ranges.
BULLISH TARGET
3305 - DONE
EMA5 CROSS AND LOCK ABOVE 3305 WILL OPEN THE FOLLOWING BULLISH TARGETS
3334 - DONE
EMA5 CROSS AND LOCK ABOVE 3334 WILL OPEN THE FOLLOWING BULLISH TARGET
3359 - DONE
EMA5 CROSS AND LOCK ABOVE 3359 WILL OPEN THE FOLLOWING BULLISH TARGET
3389
EMA5 CROSS AND LOCK ABOVE 3389 WILL OPEN THE FOLLOWING BULLISH TARGET
3428
EMA5 CROSS AND LOCK ABOVE 3428 WILL OPEN THE FOLLOWING BULLISH TARGET
3478
BEARISH TARGETS
3271
EMA5 CROSS AND LOCK BELOW 3271 WILL OPEN THE FOLLOWING BEARISH TARGET
3227
EMA5 CROSS AND LOCK BELOW 3227 WILL OPEN THE SWING RANGE
3185
3146
As always, we will keep you all updated with regular updates throughout the week and how we manage the active ideas and setups. Thank you all for your likes, comments and follows, we really appreciate it!
Mr Gold
GoldViewFX

BEST XAUUSD M30 BUY SETUP FOR TODAY 📈 Gold (XAU/USD) is showing bullish momentum on the 30-min chart, trading within a rising parallel channel. Price has recently bounced from lower support and is aiming for the resistance zone near $3,331. 🔼 A breakout above this level could signal further upside, continuing the bullish wave structure. Traders should watch for pullbacks to the lower trendline as potential buying opportunities. 🧠💡 As long as price stays above the $3,251 support, the bullish bias remains intact. 📊✨
