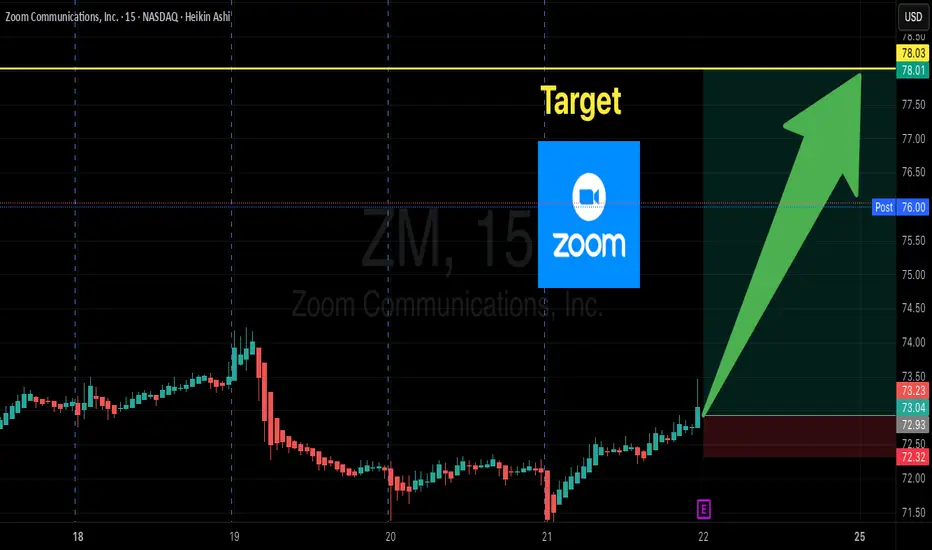
Zoom $78 Calls: Huge Earnings Upside Potential!
## 🚀 Zoom Earnings Play: Cheap Calls Before the Bell (Aug 21, 2025) 🚀
### 🏦 Earnings Outlook
* 📊 **Revenue Growth:** +2.9% TTM – stagnant post-COVID growth
* ⚖️ **Margins:** Gross 75.9%, Profit 22.3% → Strong efficiency
* 📈 **Historical Beat Rate:** 100% over last 8 quarters
* 🖥️ **Sector:** Tech / SaaS – AI and cloud trends impact growth sentiment
* 🧭 **Analyst Consensus:** Buy, with upside potential
---
### 🔎 Options Flow Insight
* 📉 **Put Activity:** OTM puts (\$66-\$67) highlight cautious institutional sentiment
* ⚖️ **Put/Call Skew:** Slightly bearish, hedging activity present
* 💡 **Opportunity:** Take advantage of earnings momentum with \$78 calls
---
### 📉 Technical Setup
* 📊 **Current Price:** \$72.16 → below 50D (\$75.09) & 200D (\$78.61) MA
* 🔑 **Support:** \$71.00
* 🔑 **Resistance:** \$75–\$78
* 💥 Volume: Slightly below average, indicates muted momentum
---
### 🎯 Trade Setup (Earnings Play)
* 🟢 **Direction:** CALL (Bullish Bias)
* 🎯 **Strike:** \$78.00
* 💵 **Entry Price:** \$0.98
* 📅 **Expiry:** Aug 22, 2025
* 📊 **Size:** 1 contract
* 🕒 **Entry Timing:** Pre-earnings close
📌 **Profit Target:** \$2.94 (200% 🚀)
📌 **Stop Loss:** \$0.49 (50% of premium)
📌 **Exit Rule:** Within 2 hours post-earnings to avoid theta decay
---
🔥 Hashtags for Reach 🔥
\#ZoomEarnings #ZMOptions #EarningsPlay #TechStocks #OptionsTrading #TradingSetup #DayTrading #SwingTrading #WallStreet
Tradingsetup
VEEV Call Play: Riding the Smart Money Flow
## 🚀 VEEV Weekly Options Setup (Aug 20, 2025) 🚀
📊 **Market Outlook:**
* ✅ Options Flow: **61 Calls vs 4 Puts → C/P Ratio = 15.25** 💥
* 📉 RSI: **Daily = 49.5 (rising)** | **Weekly = 61.0 (falling)** → mixed 📊
* 📊 Volume: **0.9x last week** → weaker conviction
* 🏦 Overall Sentiment: **Moderately Bullish** 🌟
---
💡 **TRADE IDEA:**
* 🎯 **Instrument:** VEEV
* 🟢 **Direction:** CALL (LONG)
* 🎯 **Strike:** \$290.00
* 💵 **Entry Price:** \$9.90
* 📅 **Expiry:** 2025-09-19
* 🛑 **Stop Loss:** \$5.35 (−50%)
* 🎯 **Profit Target:** \$14.03 → \$21.40 (+30% to +100%)
* ⏰ **Entry Timing:** Market Open
* 💪 **Confidence:** 65%
---
⚠️ **Risks to Watch:**
* ⚡ Weak volume = less upside fuel
* 🌍 Macro news impact
* 📉 **Close < \$273 = cut trade fast**
---
🔥 **Hashtags for Reach** 🔥
\#VEEV #OptionsFlow #TradingSetup #StockMarket #SwingTrade #OptionsTrading #TradingView #BullishMomentum #SmartMoneyFlow #CallOptions

XAU/USD Intraday Plan | Support & Resistance to WatchPrice failed to break the $3,344 resistance yesterday, followed by a sharp move lower. It is currently trending just below the $3,324 resistance. Price remains capped under both moving averages, and the structure stays bearish.
The first resistance is at $3,324. A sustained move above $3,344 is needed to shift momentum, opening the path toward $3,364 and $3,386. If buyers fail to reclaim this level, the downside bias remains intact, with risk of a test into the Secondary Support Zone ($3,304–$3,281). A clean break below that would expose the HTF Support Zone ($3,254–$3,229).
📌Key Levels to Watch
Resistance:
‣ $3,324
‣ $3,344
‣ $3,364
‣ $3,386
‣ $3,406
Support:
‣ $3,304
‣ $3,281
‣ $3,254
‣ $3,229
🔎 Fundamental Focus:
The main event today is the FOMC Meeting Minutes , which could provide clearer signals on the Fed’s rate path and drive sharp moves in gold.
⚠️ Risk/Volatility Warning:
High-impact news flow begins today with the Fed minutes and continues into Thursday’s data and Friday’s Jackson Hole Symposium. Expect increased volatility and fakeouts – manage risk carefully and wait for confirmation before entering trades.

Gold Plan M15 – Captain VincentContext:
The M15 chart shows price currently sitting right at the Premium Supply zone — a level that has repeatedly held and triggered bullish reactions in the past. However, with the short-term trend leaning bearish, this zone may no longer serve as a strong “shield.”
Today’s focus:
Sell in line with the main downtrend at the nearest resistance zone.
Buy from deeper levels if price breaks support and forms an FVG gap below.
1. Sell Zone – Premium Defense 🛡️
Entry: 3345 – 3347
SL: 3351
TP: 3343 → 3340 → 3337 → 3333 → 33xx
Meaning: A short-term resistance area, ideal for selling in line with the bearish momentum.
2. Buy Setup – Hidden FVG ⚓
Entry: Will wait at the lower FVG zone (to be updated once price approaches).
Meaning: If price breaks through the current Supply zone, shift bias to Buy at the lower FVG, taking advantage of a technical rebound.
Scenarios for today:
If price retests 3345 – 3347 → Sell with the trend.
If price breaks the Premium Supply zone → Watch for rebound strength and prepare to Buy at the lower FVG.
If neither zone is reached → Stay out, wait for a clear signal.
Captain’s Note:
“Lower timeframes like M15 are often stormy seas 🌊. Keep discipline: Sell only at the right zones, Buy only at the right levels, and never FOMO in the middle of the ocean. 🏴☠️”

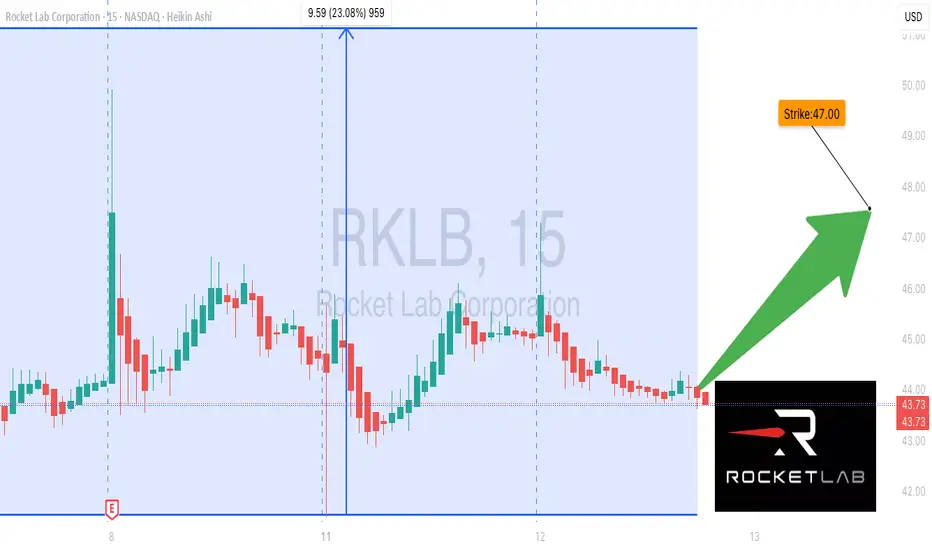
RKLB wait for break Out Fibo Level🚀 RKLB Weekly Options Alert (Aug 12, 2025)**
**Bias:** 🔥 **BULLISH** — Institutional money flowing in, low VIX, RSI rising!
📊 **Quick Stats:**
* **Daily RSI:** 53.9 ↗ (building momentum)
* **Weekly RSI:** 73.7 ✅ strong uptrend
* **Volume:** 1.4× avg — institutional accumulation confirmed
* **Options Flow:** Call/Put = **1.80** 📈
* **VIX:** 15.89 — great for longs
💡 **Consensus Play:**
* **Type:** Naked CALL
* **Strike:** \$47.00
* **Expiry:** Aug 15, 2025
* **Entry:** \$0.93
* **PT:** \$1.67 (+80%)
* **SL:** \$0.40
* **Confidence:** 75%
* **Exit Timing:** Before Friday to dodge gamma crush
⚠ **Risks:**
* Daily RSI still under 55 — could see intraday chop
* Only 3 DTE — time decay will bite if slow move
---
**📈 TL;DR:**
Volume + RSI + options flow = 🚀 Setup. Tight risk. Fast exit.
\#RKLB #OptionsTrading #SwingTrade #WeeklyOptions #FlowTrading #UnusualOptions #OptionsFlow #StockMarket #TradingSetup #BullishBreakout #TechnicalAnalysis #CallOptions #OptionsAlert
Excellent selling trades Delivered [550 pips]As I mentioned throughout Today's commentary session:
My strategy is sell from 3402-3405
Very happy with the profits so far multiple attempts after Back to back Tps HIT.
TODAY'S PROFITABLE TRADES 💰🙌
GOLD SELL 3400 60 PIPS BE
GOLD SELL 3402 200 PIPS TP
GOLD SELL 3401 130 PIPS TP
GOLD SELL 3400 190 PIPS TP
•4 consecutive WIN
•1 SETUP
Always follow your Setup & your path with Paitence and Discipline
My medium-term targets remain sucessfully delivered which is achieved alhumdullilah.
All I say thanks to those who followed us and made profits.

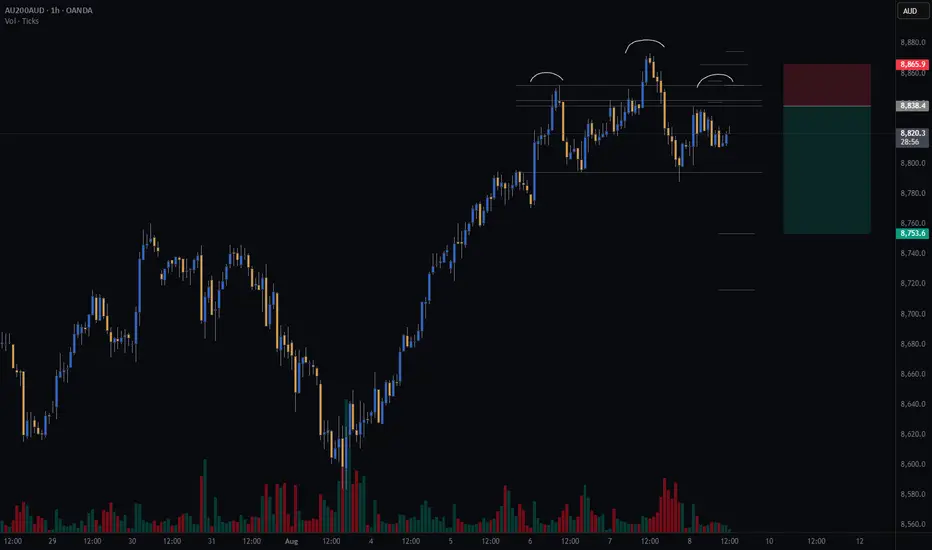
Watching for a Head & Shoulders on AUS200Watching AUS200 for a potential short setup — possible head and shoulders on the hourly chart. Left shoulder and head complete; waiting to see if right shoulder forms to confirm.
All my setup variables are met so far.
#GTradingMethod calculates take profits using the distance between the head’s peak and neckline, projected downwards.
Risk/Reward: 3.4
Entry: 8838.3
Stop Loss: 8865.8
TP1 (50%): 8753
TP2 (50%): 8716
Join the journey, what are your guys and girls thoughts on how to trade a head and shoulders, and does anyone track the AUS200?
Disclaimer: Please note, this is not financial advice. This content is intended to track my trading journey and for educational purposes only
Is oil price heading back up? Watching a potential inverse head and shoulders forming on the 30-minute chart for Oil.
🔹 Risk/Reward: 2.7
🔹 Entry: 63.290
🔹 Stop Loss: 63.043
🔹 Take Profit 1 (50%): 63.93
🔹 Take Profit 2 (50%): 64.21
A couple of key factors still need to align before I pull the trigger:
• One will confirm around 14:45 SAST (GMT+2)
• Looking for lower volume on the right shoulder compared to the left
What do you think? Is oil ready to push higher?
Drop your thoughts or how you trade inverse head and shoulders below! 👇

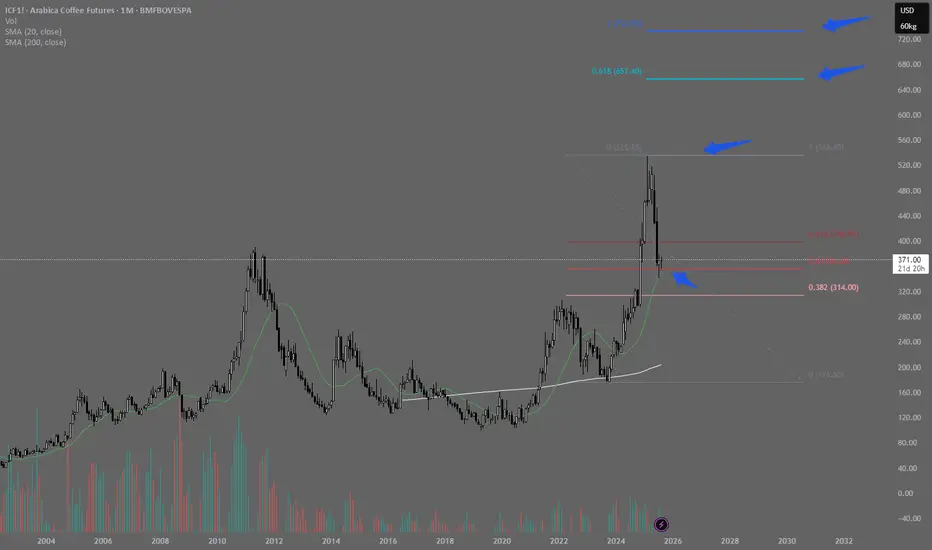
Correction Over? Coffee May Be Ready for Another Rally!After a strong rally and moving far from its moving averages, coffee futures have started a healthy and expected pullback.
As we can see, the 20-period moving average (green) stands out as a strong support level and a potential target for those who sold near the top — whether for a partial profit-taking (expecting a deeper correction) or a full exit.
The candle formed right on the 20MA clearly reflects this dynamic: positions being closed by some traders and opened by others.
This price zone offers a good buying opportunity, with a tight stop and a long target in favor of the prevailing uptrend.
The trade symmetry is favorable, further reinforcing interest in this region.
Initial targets would be the previous high, and if that level is broken, the Fibonacci projections for more ambitious upside moves.
GBPUSD Technical Breakdown – High-Probability Rejection Play📉 GBPUSD Technical Breakdown – High-Probability Rejection Play
🔥 Clean Structure | Strong Confluences | Smart Money Insight
This GBPUSD setup is a textbook example of price action meeting institutional behavior.
🧠 Key Observations:
• Break of Structure (BOS) identified multiple times confirming clear trend shifts.
• Price tapped into a well-defined resistance zone and showed an aggressive rejection, validating seller presence.
• Liquidity grab from the highs led to an immediate drop, marking the start of bearish momentum.
🎯 Target Zones:
• First TP: 1.33009
• Second TP: 1.32375
• Final Target: 1.31443 (aligned with major support zone and BOS retest)
🛡 Why This Setup Matters:
• Strong rejection from premium zone
• BOS confirms direction
• Volume and structure align for high RR potential
• Clean imbalance fill expectations
✅ Plan:
Sell from rejection zone with SL above the wick high. Trail stops as price approaches each target.

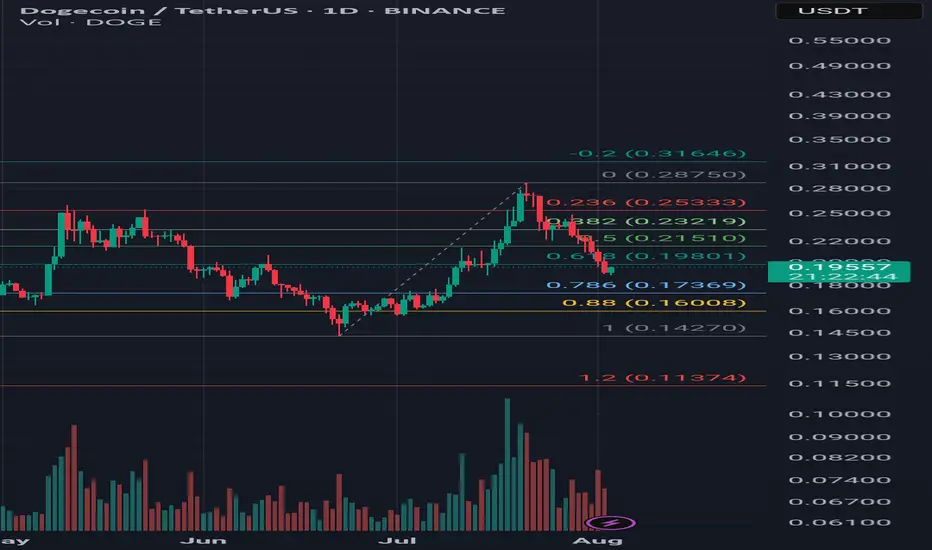
DOGE/USDT Trade Idea – Potential Cup & Handle Pattern Timeframe: Technical Analysis:
Price rallied from 0.142 to 0.287 and is currently forming the handle of a potential cup & handle pattern.
Price is sitting at the key 0.618 Fibonacci retracement level (0.198 USDT).
If this support holds and price breaks above resistance levels with strong volume, the cup & handle pattern may activate.
---
🎯 Targets:
1. First resistance: 0.215 USDT (50% Fib)
2. Second resistance: 0.232 USDT (38% Fib)
3. Key breakout level: 0.287 USDT
4. Classic pattern target: 0.432 USDT
---
🛡 Stop Loss:
Below 0.170 USDT (slightly under the 0.786 Fib & handle bottom)
---
✅ Entry Confirmation Criteria:
1. Hold above 0.198 support
2. Break and close above 0.215
3. Breakout above 0.287 with strong volume
---
💡 This analysis is for educational purposes only and is not financial advice. Always use proper risk management.
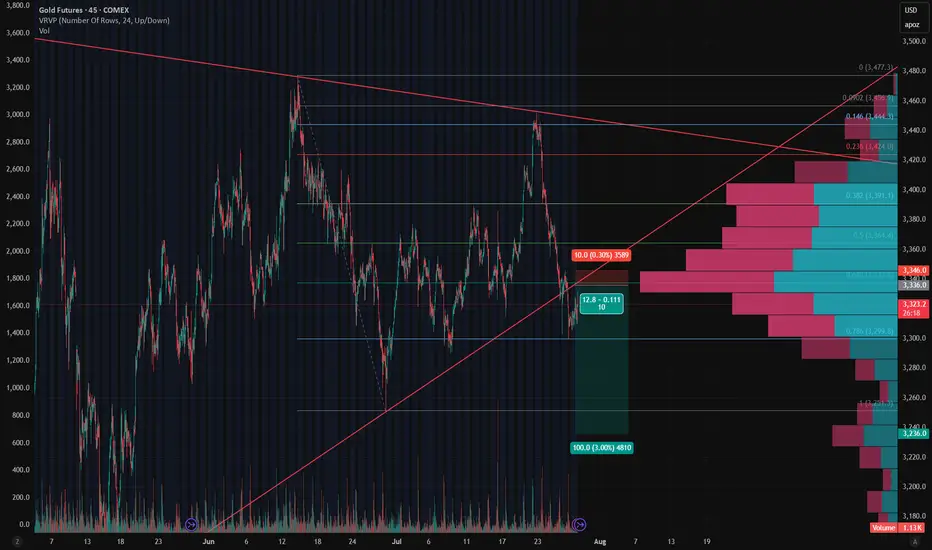
Gold - Short Setup Off Major Trendline Rejection📉 Gold - Short Setup Off Major Trendline Rejection
Gold has broken down through the rising trendline and is now retesting it — the moment of truth! 🧐
🔻 Short Entry: 3,336
🎯 Target: 3,236 (Fib 1.0 + HVN gap fill)
🛑 Stop: 3,346 (Above trendline retest)
⚖️ Risk/Reward: ~1:10
📊 Bonus: High volume node above adds resistance. Bearish volume profile structure confirms the breakdown bias.
Watching for volume to pick up on the move down. Let's see if GC bleeds into August. 🩸📆
MARA: shoulders done, now walk toward the targetOn the daily chart, MARA completed a textbook inverse Head & Shoulders reversal with a clear breakout above the descending trendline. A corrective pullback followed, and the price is now heading into the key buy zone at 15.21–15.77 - aligning with the 0.72 and 0.79 Fibonacci retracements, and the upper boundary of the broken channel. This is the area to watch for a potential continuation of the bullish impulse.
Volume on the breakout was above average, confirming strong buyer interest. The EMAs are trending below the price, supporting the upward structure. The first target is located at 21.57 (previous resistance), with a potential extension to 28.77 (Fibonacci 1.618).
Fundamentally, MARA remains highly correlated with BTC and crypto sentiment. As interest returns to crypto-related assets due to ETF flows and possible Fed easing, mining stocks like MARA gain attention. Recent reports also show improved production efficiency and lowered costs - a tailwind for bulls.
Tactically, the best setup would be a confirmed reaction from the buy zone — whether a strong candlestick formation, volume surge, or reclaim of a key level. If that happens, aiming for 21.57 and 28.77 becomes a solid plan.
The pattern played out - now it's time for the market to walk the talk.

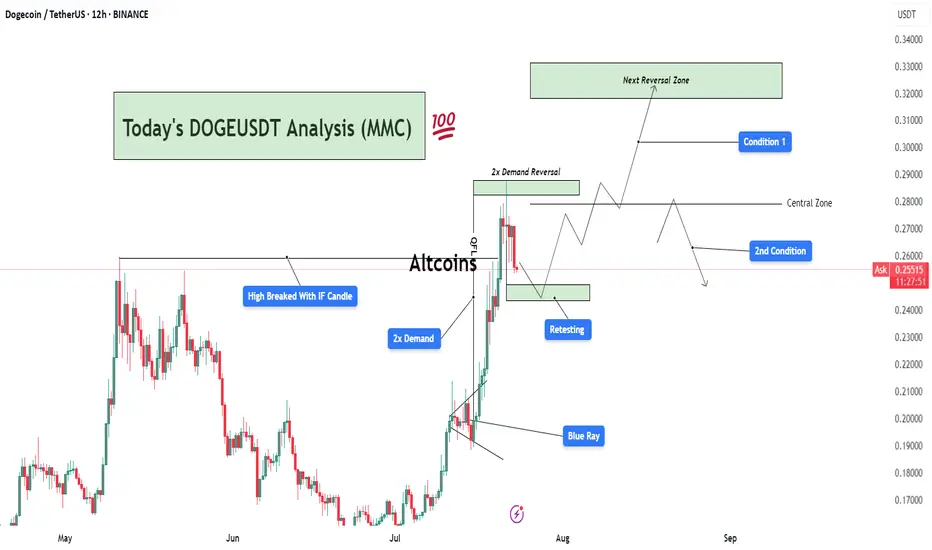
DOGEUSDT Analysis : Demand Zone Retest Before New Highs Target📊 Overview:
Today's DOGEUSDT analysis (12H chart) under the Mirror Market Concept (MMC) framework reveals a potential bullish continuation or corrective phase based on two major conditions. The market structure is transitioning after a strong impulsive move, triggered by a 2x Demand Zone breakout, and is now in the retesting phase.
🔍 Key Technical Breakdown:
High Broken with IF Candle:
A significant previous swing high was broken decisively by an Initiation Flow (IF) candle, indicating institutional activity or aggressive buying pressure.
This confirms a shift in market structure toward a bullish trend.
2x Demand Zone:
This zone has served as a strong base for price accumulation and an impulsive breakout.
The market responded well with a sharp rally post this demand, validating it as a critical support.
Blue Ray Zone (Support Zone):
The bullish breakout was partially driven by this inner trendline zone (referred to as Blue Ray), where price respected the rising support channel before breakout.
This shows smart money liquidity engineering prior to the breakout.
Retesting Zone:
Currently, the price is retracing toward a previously broken demand zone.
If this zone holds, it could provide an optimal entry for continuation.
📈 Two Scenarios (Conditions):
✅ Condition 1: Bullish Breakout to Next Reversal Zone
If the retest holds and price prints bullish confirmation (e.g., engulfing or pin bar), we can expect price to move up toward the next key reversal zone between $0.3100–$0.3300.
This zone is marked as a potential supply/reversal zone, where large sell-offs may occur.
This path follows the continuation structure under MMC, aligning with trend-following buyers.
⚠️ Condition 2: Failure to Hold Demand → Deeper Pullback
If the current demand zone fails to hold and price re-enters below the central zone (~$0.2700), we could expect a deeper correction.
Price may then revisit lower demand regions, potentially toward $0.2200 or lower, depending on rejection strength.
📌 Important Notes:
The central zone acts as a pivot level, defining whether bulls or bears gain short-term control.
Monitor the reaction from retesting area closely — candle confirmation is key before any trade execution.
This chart follows Mirror Market Concepts (MMC), combining smart money behavior, demand/supply reversal logic, and psychological market zones.
💬 Final Thoughts:
DOGEUSDT is currently in a critical phase. The market has shown strength, but now it's about confirmation. Patience is key — wait for a clean break or rejection around the retesting zone to determine the next direction. The analysis favors bullish continuation, but being flexible with both scenarios gives traders an edge.
ARKK: when a breakout isn’t just a breakout-it’s a runway to $91On the weekly chart, ARKK has broken out of a long-standing ascending channel, ending a year-long consolidation phase. The breakout above $71.40, with a confident close and rising volume, signals a transition from accumulation to expansion. The move came right after a golden cross (MA50 crossing MA200), further confirming institutional interest. Price has already cleared the 0.5 and 0.618 Fibonacci retracements — and the 1.618 extension points to $91.40 as the next technical target.
Momentum indicators like MACD and stochastic remain bullish with room to run. Volume profile shows low supply above $75, which could fuel an acceleration toward the target zone.
Fundamentally, ARKK remains a high-beta, high-risk vehicle — but one with focus. The ETF is positioned around next-gen tech: AI, robotics, biotech, and automation. Assets under management now exceed $9.3B with +$1.1B net inflow in 2025. YTD return stands at 37%, and its top holdings (TSLA, NVDA, COIN) are back in favor. This isn’t just a bet on innovation — it’s diversified exposure to a full-blown tech rally.
Tactical setup:
— Entry: market $69.50 or on retest
— Target: $80.21 (1.272), $91.40 (1.618 Fibo)
Sometimes a breakout is just technical. But when there’s volume, a golden cross, and billions backing it — it’s a signal to buckle up.

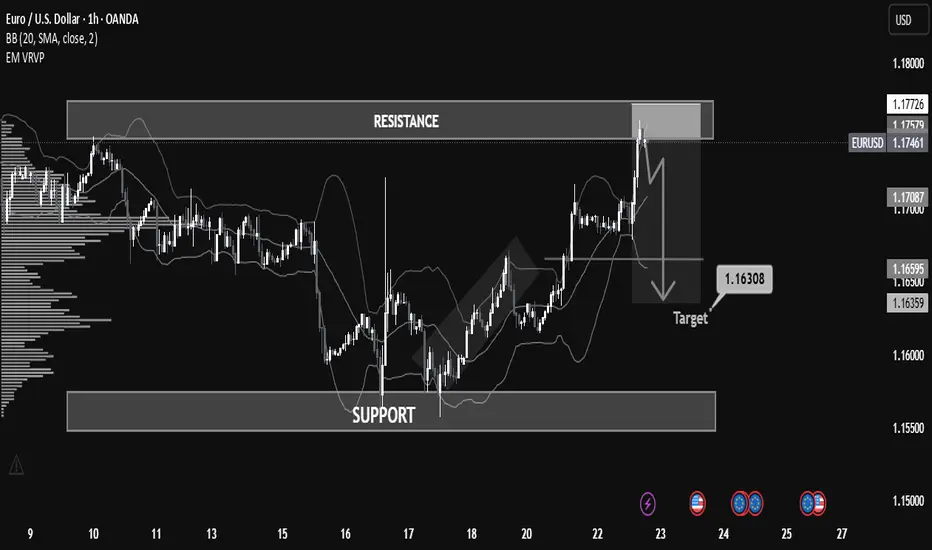
Why EUR/USD Dropped: A Step-by-Step Breakdown for Learners📉 Overview:
The EUR/USD has recently approached a key resistance zone near 1.17726, showing signs of a potential rejection after a bullish rally. The price is currently hovering around 1.17468, forming a short-term bearish setup that could lead to a retracement or reversal.
⸻
⚙ Key Technical Zones:
• 🔼 Resistance: 1.17500 – 1.17726
Price was strongly rejected after testing this area. This level has historically acted as a supply zone.
• 🔽 Support: 1.15500 – 1.16000
This is a historically significant demand zone, where price previously consolidated and reversed.
• 🎯 Target Zone: 1.16308
Marked as a potential take-profit level based on prior price structure and volume profile imbalance.
⸻
🧠 Indicators & Tools:
• Bollinger Bands: Price touched the upper band in overbought conditions, suggesting a possible mean reversion.
• Volume Profile (VRVP): Indicates declining volume near resistance, pointing to weak buyer momentum.
• Price Action: Bearish engulfing candle and strong rejection wick at resistance, confirming selling pressure.
⸻
🧭 Market Bias:
📌 Short-Term Bearish
A short opportunity is forming based on the rejection from resistance and overextension of price.
⸻
🧩 Possible Scenario:
1. Breakdown below 1.17061 (mid-level support) could trigger acceleration to the downside.
2. 1.16500 and 1.16308 are ideal short targets before reevaluation for continuation or bounce.
⸻
🛑 Risk Management Tips:
• Consider SL above 1.17800 (previous high).
• Monitor for confirmation before entry (e.g., bearish candle close below 1.17000).
• Adjust size and risk-reward ratio appropriately.
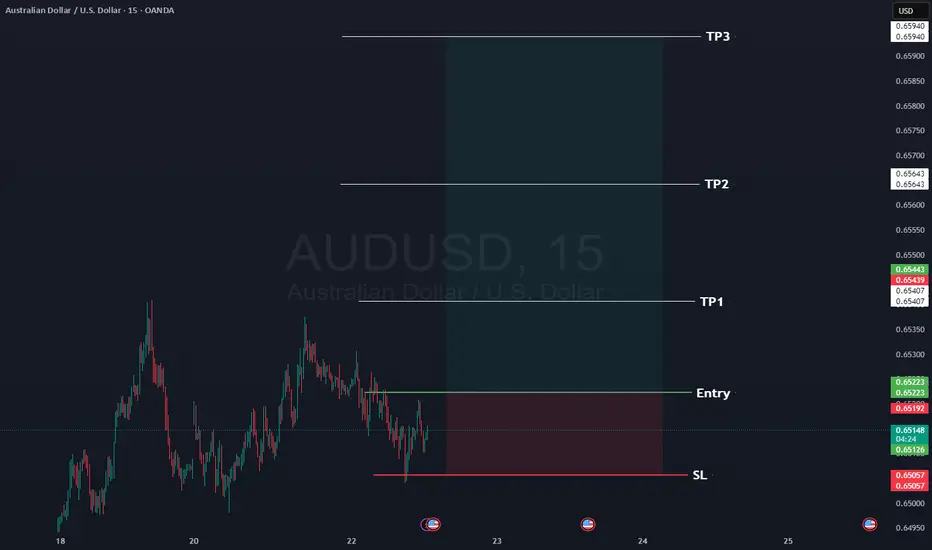
AUDUSD Here is our signal for AUDUSD
Occasionally we give a free signal, so here's AUDUSD long.
Rules:
1- Wait for the 15 minute to close with momentum above the entry, ideally we want a re-test of the entry.
2- at TP1 move your SL to entry.
3- If you want to close at TP2 then do so.
📊Entry: 0.65223
⚠️SL: 0.65057
✔️TP1: 0.65407
✔️TP2: 0.65643
✔️TP3: 0.65940
Happy Trading,
Sarah
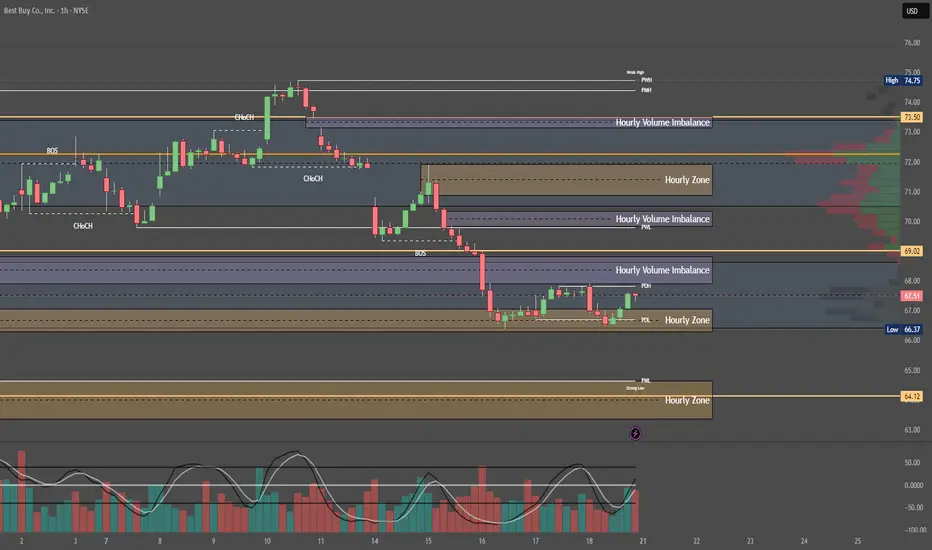
Quantum's BBY Outlook 7/20/25🚀 G.O.D. Flow (Gamma, Orderflow, Dealer Positioning)
1. 🧩 Summary Overview
Ticker: BBY
Current Price: $67.50
Flow Setup Date: Current Session
Trade Type: Intraday / 0–2 Day Swing
2. 🔬 Flow Breakdown
🔵 GEX (Gamma Exposure):
Highest -GEX at 70 → potential volatility pocket and resistance zone.
Despite matching +GEX at 70, net gamma is negative — bearish skew.
Additional +GEX at 72 & 73, but overwhelmed by -GEX at 68 and 67.
🔺 Overall gamma environment favors chop and downside unless 70 is reclaimed.
🟡 DEX (Delta Exposure):
Mirrors GEX layout.
Dealer short delta bias = likely selling into strength.
Reclaim of 70+ may signal a squeeze, but not favored without sweep confirmation.
🟣 Vanna:
Strong -Vanna clusters from 70 to 77: if IV rises, dealers sell into strength.
⚠️ This limits bullish continuation unless IV drops drastically.
Minor +Vanna at 60 = support base on deep dip (liquidity pocket if flushed hard).
🔴 Charm:
Extreme -Charm peak at 70 = time decay creates headwind at this level.
Additional -Charm pressure at 72, 73, and 77.
Minor +Charm at 60 suggests dealer support only comes much lower.
⚪ Volatility:
Neutral past week.
If vol spikes, expect dealer selling pressure to intensify under this skew.
🟢 Open Interest:
Heavy put OI at 70 = possible support IF price breaks hard.
Calls OI lighter at 72 and 73, meaning less resistance absorption if price does push up.
3. 📊 Chart Structure Setup
Price: $67.50, sitting below key gamma and charm cluster at 70.
Chart bias: Bearish unless strong reclaim of 70.
Key flush zones: 68 → 67 → 65
Confirmed supply above 70 due to clustered charm/vanna.
4. 🎯 Trade Plan
🟥 Bias: Bearish unless 70 is reclaimed and held with size.
🛠 Entry Triggers:
Rejection of 69.50–70 zone → PUT
Break and retest of 67 → PUT
📦 Contract Picks (0–5 DTE):
67p, 65p, 60p
🛑 Risk Stop:
Breakout and hold above 70.50 with size = exit or flip long bias intraday
🎯 Targets:
Target 1: 66.00 (Gamma flush)
Target 2: 63.00 (next +Charm liquidity zone)
Gold Just Flipped Is the Drop Coming?🚨 Gold Market Update – Are You Ready? 🚨
Yesterday, the gold market swept the liquidity from the previous days taking out stop orders and clearing out weak positions. After the sweep, price closed lower, showing clear signs of weakness. 📉
But that’s not all...
In the process, it also broke through a key bullish Fair Value Gap (FVG) an area where buyers had previously shown strength. That FVG is now inverted, meaning it could act as a strong resistance level going forward.
With this shift in structure, there's a real possibility that gold could drop further, potentially hunting the liquidity resting near previous lows. The market might be gearing up for a deeper move.
🔥 So the question is:
Are YOU ready for the next leg down?
📌 As always Do Your Own Research (DYOR)
This is not financial advice just reading the tape.

Gold Market Analysis (XAU/USD) – MMC Analysis + Liquidity Target🧠 Market Context Overview:
Gold recently experienced a highly impulsive move from a major demand zone, suggesting strong smart money activity. The market is currently in the redistribution phase of the MMC (Market Maker Cycle), transitioning between a reversal impulse and a liquidity targeting move.
Let’s dissect the key zones, structure, and confluences that support the ongoing market narrative.
📍 1. Strong Demand Reaction (3X Demand Spike):
We start with a triple-tap demand rejection, where the price sharply reversed to the upside. This kind of movement typically represents:
Institutional Entry Points
Stop-Hunt Below Previous Lows
Liquidity Grab Before Expansion
This strong bullish engulfing candle signifies position building by smart money, often the beginning of a significant leg up.
🧱 2. Reversal Zone & Liquidity Imbalance:
The highlighted green zone between $3,370–$3,375 is crucial. Why?
It’s an inefficiency zone where price moved too fast with low resistance.
This created a liquidity void that typically needs to be revisited (also known as FVG – Fair Value Gap).
The area also coincides with structural resistance, making it a high-probability target for price to revisit and reject again or break through with intent.
📌 Smart money always returns to areas of unfilled liquidity to close their positions or trap late retail entries.
🔺 3. Volume Contraction (Wedge Pattern Formation):
After the explosive push upward, the market started compressing, forming a descending wedge — a classical volume contraction pattern.
What does this mean?
Volatility is decreasing
Liquidity is building up
Big breakout is expected
It’s like pulling a slingshot — the more it contracts, the stronger the release will be. The direction will depend on which side breaks first.
🔁 4. Previous Structure Flipped (Support turned Resistance):
You’ll notice a key level around $3,353–$3,355 acting as a flipped structure.
This was previously a support zone that got broken.
Now it’s acting as resistance — a classic example of support/resistance flip.
This adds confluence to the idea of a possible rejection or reaction in this area.
🧠 Structure flipping is a smart money trick — break structure, retrace to trap liquidity, and then run the opposite direction.
📊 5. MMC Logic – Market Maker Cycle in Play:
Here’s how the MMC is flowing:
Accumulation (bottom consolidation)
Manipulation (liquidity sweep below demand)
Expansion (aggressive upward move)
Contraction (volume dies, price slows down)
Now we’re waiting for the next manipulation or expansion phase.
The current wedge is the pause before the next move, which could fill liquidity in the reversal zone or go lower to sweep resting sell-side liquidity.
🎯 Trading Scenarios:
✅ Bullish Bias (if breakout happens):
Break and close above the wedge
Retest previous flipped structure successfully
Target: Liquidity zone at $3,370–$3,375
🎯 This move would fill the imbalance and potentially tag sell-side liquidity sitting at the top.
❌ Bearish Bias (if rejection holds):
Failure to break above flipped structure
Breakdown from the wedge
Target: Demand origin around $3,325–$3,315
🧲 A move lower would make sense if liquidity remains uncollected beneath the range.
🧵 Final Thoughts:
Gold is currently in a high-probability setup zone. We have:
✅ Clear demand reaction
✅ Imbalance above
✅ Volume contraction
✅ Flipped structure
✅ Strong MMC confluence
Now it's a waiting game. Let the market show its hand — either a clean breakout with volume or a fakeout/rejection and reversal.
📌 "Trade what you see, not what you think. Let the levels and liquidity guide your decision."

EURUSD 4H Structure Analysis | MMC Strategy + Channel + CurveIn this EURUSD 4-hour chart analysis using MMC (Market Mind Concept), we are observing a textbook rising channel structure accompanied by a black mind curve (evidence of psychological support behavior). Let's break it down:
📊 Structure Overview:
Straight Ascending Channel:
Price has been respecting a clean, straight rising channel, forming higher highs and higher lows over the past several weeks. This structure provides a controlled bullish bias, but we are approaching an inflection point.
Black Mind Curve Support (Evidence 2):
A curved trendline (Mind Curve) is providing dynamic support. This curve intersects with the lower boundary of the rising channel—creating a confluence zone, which is likely to act as strong short-term support or the base of a reversal.
Major BOS (Break of Structure):
A significant bullish BOS occurred earlier, confirming momentum strength. This previous break is acting as a reference point for bullish continuation scenarios.
📉 Bearish Scenario:
If the price breaks below the channel and mind curve support, this would invalidate the current bullish channel structure.
A clean breakout + retest below the support zone may invite strong selling pressure, targeting previous support zones around 1.1500 – 1.1350.
📈 Bullish Scenario:
If the price holds above the mind curve and continues upward, we may see a breakout above the top of the channel.
A confirmed breakout could send price toward the 1.1900 – 1.2000 resistance zone.
Patience is key—wait for a confirmed breakout from the channel (either side) before engaging.
⏳ Strategy Outlook:
✅ Wait for channel breakout confirmation (up or down)
⚠️ Watch for fakeouts or liquidity grabs near channel boundaries
🔁 Mind Curve Support adds another layer of decision-making structure
🧠 Trade with the trend, but remain adaptable to shift if channel breaks
🔍 Summary:
The EURUSD pair is in a decision-making zone—either we get a bullish continuation breakout, or the structure fails and we flip into a bearish correction. The confluence of the straight channel and mind curve makes this setup high-quality for both trend traders and breakout traders.

XAU/USD Potential Head & Shoulders Pattern FormingXAU/USD - Potential Head & Shoulders Pattern Forming 🔍
A possible Head and Shoulders pattern is taking shape on the 2H chart. With the right shoulder now forming and price nearing resistance, this setup could indicate a short opportunity.
🎯 Short Target: 3,304
🛑 Stop Out: 3,370
This setup offers a clean risk-to-reward ratio. Let’s see how price reacts in the coming hours!
💬 Drop your thoughts in the comments – do you agree with this setup? Let's support each other with ideas!
👍 Don’t forget to like and share if you find this helpful – your support means a lot!

Ethereum - This structure decides everything!Ethereum - CRYPTO:ETHUSD - trades at a key structure:
(click chart above to see the in depth analysis👆🏻)
After Ethereum retested the previous all time high in the end of 2024, we saw quite a harsh move lower. This move was followed by an expected recovery, however Ethereum is still trading below a key structure. Either move is still possible and will shape the future of Ethereum.
Levels to watch: $2.500, $4.000
Keep your long term vision!
Philip (BasicTrading)
