10Y Treasury Bond Is Looking For A Bigger RecoveryTreasury bond - 10Y US Notes came down a lot in the last two years but this cycle can now come to an end as we can see five waves down into 2023 lows ona weekly time frame. In fact, we also see five subwaves completed within wave (5) on a daily chart after prices recovered and break above the trendline resistance. The move is strong, thus we think that more upside can be coming within a three-wave (A)-(B)-(C) rally, where first leg (A) can be still in progress or maybe already completed as an impulse. Support on subwave 4 or wave (B) dips are at 110-111.
Treasuries

1-Treasury bills give the same returns as S&P 500 with less riskWall Street Investment banks are predicting various prices for the S&P 500 close at the end of 2024. But if the current 1-year Treasury Bill Yield is the same as the estimates then why bother buying the S&P 500? It would be safer buying bills and you may get an equal return.
This piece of analysis will look at:
Historical accuracy of Wall Street Banks S&P 500 estimates for the year ending
Current predictions for S&P 500 estimates for year-end 2024
The current yield on 1-year Treasury Bills
Comparison between the estimates for the S&P 500 vs. 1-year Treasury bills.
Historical analysis
According to research done by Bespoke Investment Group and by CNBC.
Excluding 2008, the analyst overshoot of the S&P 500 actual performance over the past 15 years goes down from being over 9% off to a miss of 3.4%. And the fact that analysts overshot the actual market performance 12 out of 15 times, means they did undershoot it three times. When looking at their S&P 500 price target prediction, analysts undershot the actual performance in seven of the past 20 years.1
Historically, these forecasts have often underestimated the actual market performance, especially during the bullish period since 2009, when they were off target seven out of nine times. The average annual projection tends to be around 9.3%, aligned with the S&P's historical average gain. 2
So, overall, excluding the outlier of 2008, analysts tended to overshoot their predictions of the S&P 500 performance by a decreasing margin over the past 15 years, moving from an initial overestimation of over 9% to a more moderate miss of 3.4%. Their track record shows a pattern of overshooting the market's actual performance in 12 out of 15 instances, with just three instances of undershooting.
Current predictions
BMO Capital Markets: $5,100
Deutsche Bank: $5,100
RBC Capital Markets: $5,000
UBS: $4,700
Goldman Sachs: $5,000
Bank of America: $5,000
Barclays: $4,800
Wells Fargo: $4,600
Morgan Stanley: $4,500
J.P. Morgan: $4,200
Average = $4,800
Median = $4,900
Mode = $5,000
1-Year Treasury Bill
The current yield on the 1-Year Treasury Bill is 5.061%. The reasons for the yield being somewhat high are:
Strong Economic Data: The resilience of the U.S. economy, especially the robustness of the jobs market, has surprised many experts. Despite expectations for a slowdown, the economy continues to perform well, leading to higher yields. The Federal Reserve's cautious approach to cutting interest rates too quickly is another reflection of this strong economic backdrop.
Fed's Cautionary Stance: The Federal Reserve is wary of cutting rates swiftly due to concerns about inflation and the tightness of the labour market. They aim to maintain a balanced approach, keeping rates at a level that won't spur excessive inflation but also won't hinder economic growth.
The shift in Fed Messaging: Recent messaging from the Fed indicated less aggressive rate cuts in the future than previously expected. This change in outlook, particularly with the Dot Plot showing fewer rate cuts in 2024, has influenced bond market sentiment.
Increased Treasury Issuance: The U.S. Treasury's substantial pace of issuing new debt has disrupted the supply-demand equilibrium in the bond market. The unexpected announcement of raising a significant amount of money through bond sales has added pressure to yields as more bonds flood the market.
Yield Curve Dynamics: The yield curve, which had previously inverted (short-term yields higher than long-term yields), is now experiencing a lessening of this inversion. Typically, this occurs as short-term rates fall while long-term rates rise. However, the current situation is unique as the long-term yields are increasing while short-term rates remain relatively stable.
The surge in Treasury yields reflects a confluence of factors: a resilient U.S. economy outperforming expectations, the Federal Reserve's cautious approach to rate cuts amid concerns about inflation and a tight labour market, a shift in Fed messaging signalling fewer future rate reductions, increased government borrowing, and the unique dynamics of the yield curve. This unexpected rise in yields diverges from earlier predictions of a decline, shaping the current landscape of the bond market and influencing borrowing rates for consumers and businesses alike.
One's prediction of the future yield in a year may be higher or lower. But regardless, when you buy a bond it is stuck at that yield since it represents the interest earned.
S&P 500 vs Treasury bills
Yesterday's close of the S&P 500 was $4,567.18. If we assume the S&P 500 will reach the average and median estimates that represents a 5.10% and 7.13% return on investment respectively.
However, as we have established above looking at the historical analysis of Wall Street estimates they tend to overestimate. Most of the time the S&P 500 closed below their estimate. Wall Street estimates between 2000 and 2018 have an average overshoot of 4.40% from the table above. So there is reason to assume they will do the same this year.
If we assume the estate's average and median return of 5.10% and 7.13% respectively are overshooting. That means we might as well invest in 1-year Treasury Bills. Why? Because Treasury bills are safer, and guaranteed return and if they are giving similar returns to the more risker S&P 500 over the next year then why bother with the risker alternative? It makes more sense to just buy 1-year Treasury Bills.
Conclusion
In the landscape of investment choices for the year ahead, the comparison between the S&P 500 and 1-year Treasury Bills offers compelling insights. The historical analysis of Wall Street's predictions demonstrates a consistent pattern of overestimation, signalling a potential trend that might repeat itself in the current estimates for the S&P 500 for year-end 2024.
With the current projections showcasing potential returns for the S&P 500, it's crucial to consider the safety and reliability offered by 1-year Treasury Bills, especially given their current yield, standing at 5.061%. The compelling argument arises when assessing the historical trend of overestimation by financial analysts in forecasting S&P 500 performance.
If these estimations continue to overshoot, as historical data suggests, the seemingly safer investment in 1-year Treasury Bills could provide comparable returns with considerably lower risk. The prudent approach might lean toward the Bills, given their guaranteed return and stability, particularly if they yield similar or better returns than the potentially riskier S&P 500.
The choice between the S&P 500 and Treasury Bills becomes a contemplation of risk versus stability. While the S&P 500 might offer potential gains, the historical trend and current projections invite consideration of the Bills as a safer and possibly equally rewarding investment option for the upcoming year. Ultimately, it might be prudent for investors to weigh these factors carefully before making their investment decisions for the year ahead.
1
www.cnbc.com
2
seekingalpha.com

AUD/USD extends gains, RBA minutes next
The Australian dollar is in positive territory on Monday. In the European session, AUD/USD is trading at 0.6553, up 0.59%. The Aussie is flexing its muscles, gaining some 3% in the past week.
The Reserve Bank of Australia releases the minutes of the meeting earlier this month on Tuesday. There wasn't much of a surprise as the RBA raised rates by a quarter-point to 4.35%, but the Australian dollar dropped sharply in the aftermath, which is an unusual move after a rate hike. Investors jumped all over the language of the rate statement, which suggested that the bar had risen for an additional rate hike. Interestingly, the statement also warned that inflation was "too high" and the "risk of inflation remaining higher has increased", but investors ignored this hawkish assessment.
The RBA minutes may provide more clarity on whether rates have peaked. The markets are betting that the tightening cycle is over, but if the minutes signal that rates could go up, the Australian dollar could get a boost. As for 2024, the markets are expecting a rate cut, but the RBA is still trying to convince the markets that rate hikes are on the table and it isn't discussing trimming rates.
Just a month ago, 10-year US Treasuries were trading at 4.98%, but have fallen to 4.44% at present. The lower yields have made US Treasuries less attractive and the US dollar has fallen against the majors recently, including the Australian dollar.
The FOMC minutes will be released on Wednesday and the markets will be combing through, looking for hints about upcoming rate decisions. Despite the Fed insisting that rate hikes remain on the table, the markets are confident that Fed policy will be less restrictive in the first half of 2024. According to the CME's FedWatch tool, there is a 100% likelihood of a pause in December, with a 30% chance of a rate cut in March 2024, followed by a 64% chance in May.
There is resistance at 0.6587 and at 0.6600
0.6470 and 0.6397 are providing support

Bonds are compelling as collateralEver since 2008, the world shifted more to the world of collateral and distrust, after the world of unsecured collapsed.
Treasuries are dollars are in the future. As long as uncertainty remains high (or increases) there will be a place for government loans. Treasuries yielding near 5% on most maturities is "good enough" when compared to the historical 7% ish from equities.
Technically speaking, treasuries may be forming a short term bottom.
Tactically speaking, the gap between treasuries and stocks is very wide.
Fundamentally speaking, there may not be enough reward to justify most large cap equities current yield when compared to the healthy yield in treasuries.
Risk speaking, the biggest risk in holding treasuries is the loss in opportunity and the risk of more dollar devaluation/consumer inflation loss of purchasing power.
In summary, Treasuries are worth a shot and they are likely de-risked at current levels.
I will be considering bullish option spreads.

GBP/USD flat as retail sales eyedThe British pound is drifting on Thursday. In the North American session, GBP/USD is trading at 1.2142, almost unchanged.
The UK inflation report on Wednesday was a stark reminder that inflation remains stubborn and sticky. The Bank of England has raised the benchmark rate to 5.25%, but headline inflation was steady at 6.7% y/y and the core rate ticked lower to 6.1%, down from 6.2%. Both readings were higher than expected disappointed investors sent the British pound lower on Wednesday.
A key driver of headline inflation was rising motor fuel prices. The Israel-Hamas war has raised tensions throughout the Middle East and if there are disruptions in crude oil, inflation would likely rise due to higher motor fuel costs.
The UK wraps up the week with retail sales on Friday. The markets are braced for a weak September with a market estimate of -0.2%, following a 0.4% gain in August. On an annualized basis, retail sales declined by 1.4% in August, but are expected to improve to -0.1% in September.
In the US, unemployment claims for the week of October 14th sizzled at 198,000. This was lower than the previous week's release of 211,000 (revised) and lower than the consensus estimate of 212,000. The US labour market has been showing signs of softening as the Federal Reserve's rate hikes continue to filter through the economy and dampen economic growth.
The markets are always interested in what Fed members have to say, hoping for some insights into Fed rate policy. A host of FOMC members will deliver remarks today, highlighted by a speech from Fed Chair Powell at an event in New York City.
Today's lineup has added significance as the Fed will enter a blackout period ahead of the meeting on November 1st. The sharp rise in US Treasuries has led to some Fed members saying that inflation could fall without further hikes, and investors will be watching to see if that dovish message is repeated today by Powell and his colleagues.
There is resistance at 1.2163 and 1.2202
1.2066 and 1.1987 and providing support

GBP/USD drifting ahead of UK GDPThe British pound is calm on Wednesday. In the European session, GBP/USD is trading at 1.2297, up 0.10%.
The UK economy has been struggling and GDP declined by 0.5% m/m in July. The markets are expecting a rebound on Wednesday, with GDP projected to rise by 0.2% m/m in August. For the three months to August, GDP is expected to increase by 0.3%, up from 0.2% in the previous release.
The IMF report on Tuesday didn't bring much cheer, with the report stating that the Bank of England would need to maintain elevated interest rates into 2024 due to weak growth and sticky inflation. The same day, the BoE's Financial Policy Committee also said that rates would have to "stay high for a long time", warning that would put pressure on households.
The Federal Reserve has kept to a hawkish script, trying to convince the markets that the tightening cycle may not be over. That message has changed in recent days, as the Fed has become more dovish. The reason? US Treasury yields have been rising sharply, with 10-year yields hitting a 16-year high on Tuesday. The spike in yields has made borrowing costs more expensive and could act as a brake on the economy and push inflation lower without Fed intervention.
Atlanta Fed President Raphael Bostic said on Tuesday that the Fed didn't need to raise rates anymore in order to push inflation back to the Fed's 2% target. Bostic is considered a dove, but he has support for this position. Dallas Fed President Lorie Logan and San Francisco Fed President Mary Daly both stated that the increase in Treasury yields could mean less need for the Fed to raise rates in the current tightening cycle.
1.2179 and 1.2097 are providing support
1.2321 is a weak resistance line. Above, there is resistance at 1.2403

Pound moves higher, BoE points to pressure on consumersThe British pound is higher on Tuesday. In the North American session, GBP/USD is trading at 1.2273, up 0.29%.
The Bank of England's financial policy committee (FPC) voiced concern about consumer borrowing. The FPC noted that consumers were taking longer mortgages and increasing spending on credit cards in response to being squeezed by higher interest rates and the cost-of-living crisis. These practices have raised concerns about consumer debt levels. The FPC found that the UK banking system was "relatively stable".
The UK economy has been sputtering, and the IMF raised its 2023 growth forecast for the UK to 0.5%, up from 0.5% in the previous forecast. However, the IMF cut the 2024 growth forecast to 0.6%, down from 1.0% previously. The IMF noted that the BoE would need to maintain elevated interest rates into 2024 due to weak growth and sticky inflation.
US yields have been rising, and that could affect Fed rate policy. On Monday, Fed members Jefferson and Logan said the spike in long-term bond rates could mean less of a need for the Fed to raise rates. The reason is that borrowing had become more expensive and inflation could ease without the Fed needing to raise rates.
US 10-year yield rates rose as high as 4.8% last week, a 16-year high, compared to 4.0% in July. Higher yields on Treasuries have led to an increase in other borrowing costs, including mortgages and consumer loans. This could put the Fed's hopes for a soft landing in jeopardy and are providing support for the Fed to hold rates until next year. The odds of a rate hike before the end of 2023 have dropped to 24%, compared to 39% just one week ago, according to the CME FedWatch Tool.
1.2179 and 1.2097 are providing support
There is resistance at 1.2321 and 1.2403

USD/CAD - Canadian dollar stops nasty slideThe Canadian dollar has steadied on Thursday. In the North American session, USD/CAD is trading at 1.3728, down 0.12%.
The Canadian currency has stabilized after a nasty four-day slide, in which it declined 1.9%. The US dollar continues to look strong against the majors, as "US exceptionalism" continues to make the greenback attractive to investors.
The Canadian dollar is also getting squeezed by falling oil prices, as oil is a major export for Canada. Crude oil prices slid around $5 on Wednesday, its biggest daily drop in over a year, and fell further on Thursday before recovering. The rise in bond yields, which have raised fears of a global economic slowdown are weighing on investor sentiment towards oil.
On the economic calendar, the Canada Ivey PMI eased slightly in September to 53.1, down from 53.5 in August, but easily beat the market consensus of 50.8. The PMI has indicated expansion in economic activity in eight out of the past nine readings. As well, the job creation component rose from 58.5 to 54.8 in August, marking a six-month high.
These are encouraging figures for the Canadian economy, which has run into some headwinds, such as a flatlined GDP in August. Canada's economy contracted in the second quarter, and a repeat in Q3 would indicate a technical recession.
The Canadian dollar could show some volatility on Friday, with the US and Canada both releasing employment reports for September. Canada is expected to have added 20,000 jobs in September, which would be half of the gain in August of 39,900. The Bank of Canada will be keeping a close eye on wage growth, which is projected to rise to 5.5% y/y, compared to 5.2% in August.
All eyes will be on the US nonfarm payrolls, which is showing signs of cracks, with three straight releases below the 200,000 mark. The August release came in at 187,000 and the consensus estimate for September stands at 170,000. Wage growth is expected to tick up to 0.3%, compared to 0.2% in August. An unexpected reading in the NFP or wage growth reports could have a significant effect on the US dollar on Friday.
USD/CAD faces resistance at 1.3806 and 1.3864
1.3695 and 1.3638 are the next support lines

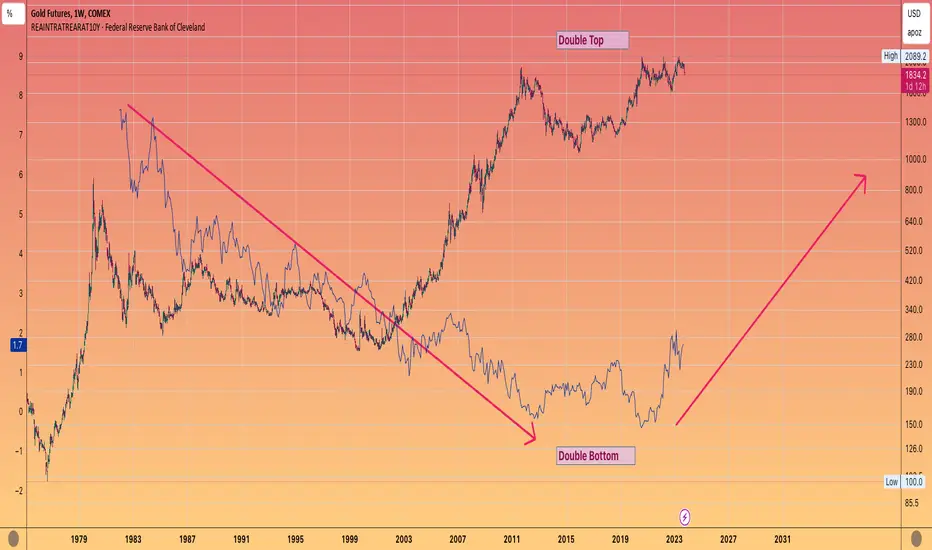
GOLD - Positive real rates is negative for GoldThe attractiveness of Gold is tarnished
When cash instruments yield a positive rate of return
More and more people are getting on board of higher interest rates
(Dimon, Santelli)
But u can see the Gold price has been inversely correlating with the rate of return for decades.
It's bull run in the 2000's along with the commodity bull , coincided with real rates trending to less than zero. Gold Topped a few months prior to that negative reading in 2012!
The current triple top that has been in place for he past 3 years , seems to be in danger of breaking down if rates continue up the next few years.
The key level to watch is last year's lows in October around $1611
Which I believe is a distinct reality if rates head up to 7%
S&P500 Vulnerabilities: from Money Supply to Sectoral ImbalancesAs much as we try not to repeat ideas here, occasionally, an opportunity emerges to harp on the same point.
As we have previously laid out the bear case for the S&P 500 from a historical volatility behavior perspective, this week we will zoom in on other metrics showing why we think the S&P may struggle from here.
The first and most interesting measure, in our opinion, is the S&P 500 when adjusted by the money supply. Once again it appears to have peaked and is on the path of reversal now. The S&P500 / Money Supply has reached these levels not once, not twice but thrice, stopping at the same level before reversing. More importantly, overall, we see the S&P 500 clearly climbing up in line with the level of money supply.
Money supply has been on a decreasing trend since the start of the Federal Reserve hikes. While the downtrend has been paused momentarily with money supply slightly increasing in early 2023 it now seems to have resumed the downward path. This could spell bad news for equities given that the S&P has broadly followed money supply and the clear resistance observed on the S&P 500 / Money Supply chart.
As yields creep higher, investors will eventually second guess whether it still makes sense to put more into the equities when cash now yields more. The 6-month treasury yield is now higher than the S&P 500 earnings yield, a phenomenon not experienced since the turn of the millennium. A federal reserve resolute in keeping rates higher for longer might just be the kicker for investors to turn to these shorter dated treasuries while waiting out equity volatility.
With a series of better-than-expected economic data, the Federal Reserve once again gains greater headroom to maintain its higher for longer stance, which is causing discomfort in the equities market. All eyes will be on the Non-Farm Payrolls numbers coming out tomorrow for further confirmation if the US economy can indeed take this regime of higher rates.
Within the S&P 500, the Technology sector remains the significant outperformer compared to other sectors like Financial, Consumer Staples and Energy. With the Technology Sector / Financial Sector ratio extending far beyond the trend from 2017.
The combination of money supply metrics, yield comparisons, and sectoral imbalances, among other factors, makes a compelling case for a bearish outlook on the S&P 500. For investors seeking targeted strategies, CME E-MINI Select Sector Futures offers a refined approach, allowing for an overall bearish view on the S&P 500 while building positions in certain sectors through a relative value strategy. To express the bearish view on the technology sector relative to the financial sector, we can take a short position on the E-MINI Technology Select Sector Futures and a long position on the E-MINI Financial Select Sector Futures. Given the contract size differences, to roughly match the notional, we will need 3 E-MINI Financial Select Sector Futures at the current level of 405 to match 2 E-MINI Technology Select Sector Futures.
3 x E-MINI Financial Select Sector Futures Notional = 3 * 405 * 250 USD = $303,750
2 x E-MINI Technology Select Sector Futures Notional = 2 * 1678 * 100 USD = $335,600
Each 0.1 index point move in the E-MINI Technology Select Sector Futures is $10, while each 0.05 index point move in the E-MINI Financial Select Sector Futures is $12.5.
The charts above were generated using CME’s Real-Time data available on TradingView. Inspirante Trading Solutions is subscribed to both TradingView Premium and CME Real-time Market Data which allows us to identify trading set-ups in real-time and express our market opinions. If you have futures in your trading portfolio, you can check out on CME Group data plans available that suit your trading needs www.tradingview.com
Disclaimer:
The contents in this Idea are intended for information purpose only and do not constitute investment recommendation or advice. Nor are they used to promote any specific products or services. They serve as an integral part of a case study to demonstrate fundamental concepts in risk management under given market scenarios. A full version of the disclaimer is available in our profile description.
Reference:
www.cmegroup.com
www.cmegroup.com

TLT ~ Weekly Swing Chart (Oct 2023)NASDAQ:TLT chart mapping/analysis for med-long term swing trade strategies.

Will $TNX catch up to shorter term yields?G-Morning!
Shorter term yields haven't moved much as of late.
Demand has slowed down & this coincides with the expectation that the #fed will be cutting rates soon.
The 2Yr #yield recently caught up with the strength of the shorter term #InterestRates & looks to be settling in the area just like the others.
On the other end the 10 Yr #yield has been pumping.
HAs been strong & hasn't been this overbought since Sept 22.
Many compare #InterestRates to GFC (Great Financial Crisis) but they were on their way DOWN vs now, they are on the way up!
Back then this was not much of an issue because #debt was SIGNIFICANTLY lower. Compared to Trillions now.
TVC:TNX

Bitcoin Has Absorbed $26,500 but What's This?Traders,
In my last post I stated that BTC must absorb the price of 26,500 for the bulls to come back out and play again. It did. Now, we are running into the 50 day moving avg. which is acting as resistance and should give those of us seeking re-entry into longs a bit of time to make those entry decisions.
However, I spotted something sus on the U.S. treasuries chart and it seems that nobody is really talking about this. Both the 10yr and the 2yr experienced a massive spike! What caused this? TBH, it is causing me some hesitation. Could this be pre-indicative of a credit event of some sort? Thoughts, links, data are appreciated in the comments below.
Stew

$TX 10Yr has done well while short term yields stagnant, oh ohIt's important to keep and eye on the 10 & 2Yr yields.
The inverted #yield curve has huge prediction probability.
BUT
The strongest aspect of this is when it normalizes.
We're not far from that as the10yr has been pumping and the shorter time frames have been pretty stagnant. Now, there's 2 ways this happens.
Soft landing, economy slowly recovers
OR
Lower rates, usually = consequences
Guess which is the historical?
TVC:TNX

$TNX, 2Yr Yield, $DXY, $VIX analysisThe 10Yr - TVC:TNX and the 2Yr #yield have held pretty steady the last few days.
Won't be shocked if it doesn't do much until the DJ:DJI & TVC:NDQ , "coincidentally", break out of the patterns we've spoken about.
TVC:DXY losing a lil bit of steam. Is it topping again?
The only odd man out is the $VIX.
It's closer to the lower end of range. IMO this is just something to look at and not of much use until it is.
September will go out with a BANG!!!
One way or another!

3x Inverse TLT ETF: Breaking Out of Descending Broadening WedgeThe Inverse ETF for the 20-Year US Government Bond is currently breaking out of a Descending Broadening Wedge and is looking to go much higher perhaps between the 61.8% and 78.6% retraces which would be about a 500-1,400% percentage gain which also means that longer end bond yields are going much higher.
I previously said I would repost this chart after the split so that the numbers would be accurate, and now that split has happened. I have my eyes on the $36 to hold and am currently looking to get some calls for that strike price expiring next year.
It's worth noting the Partial-Decline we got before breaking out of the Broadening wedge, which makes it more likely to play out.

TBT- a bearish treasury ETF LONGTBT on the 30 minute time frame shows a trend up in an ascending parallel
channel now at the bottom of the channel where it could go up or breakdown
and go under the channel. The ZL MACD suggests some bullish divergence while
the dual TF RS indicator and the ADX oscillator are non-commital.
The immediate recent short term volume profile with a POC line above price
suggests a lot of trading above price and likely short sellers. A longer time
interval volume profile shows the POC line more than $1.00 below current price.
Price could easily gravitate in the direction of that price magnet.
Overall, I see a bias for a bearish move and will watch this to confirm. i will play
this with put options to leverge the amplitude of the move albeit at higher
risk.

US 10 Year Treasury vs USD/JPYTLDR:
The US 10-Year Treasury Yield and the closely correlated USD/JPY pair can be determinants or signals of market risk. With both breaking their three decade long trends, you have to wonder is a major secular shift upon us.
The USD/JPY currency pair has traditionally had a close correlation with U.S. Treasuries.
The pair shows how many yen are required to buy one U.S. dollar
The pair's exchange rate is one of the most liquid, not to mention one of the most traded, pairs in the world. That's because the yen, just like the U.S. dollar, is used as a reserve currency.
When yields on Treasury bonds, notes, and bills rise, the Yen tends to weaken relative to the dollar. When interest rates head higher, Treasury bond prices go down, which lifts the U.S. dollar, strengthening USD/JPY prices
The US 10-Year Treasury Yield and the closely correlated USD/JPY pair can be a determinants or signals of market risk. With both breaking their three decade long trends, you have to wonder is a major secular shift upon us.

$TNX has been pumping while short term yields fizzleGoing to bring this up AGAIN.
Short term #yields have been stagnant for some time now. Most are trading within a VERY TIGHT RANGE.
3Month - 1Year yield has been relatively flat.
The 2Yr had nice bump but is struggling to go over 5%.
HOWEVER, we pointed this out some time ago, the 10YR has BEEN PUMPING! TVC:TNX

As Deflation Hits the Economy The Price of TIPs Should FallEarlier in 2022 I got some Bullish Exposure to Deflation by positioning Bearishly against TIPs (Treasury Inflation-Protected Securities) as can be seen here:
Fast-forward to today and we can now see the CPI declining and the TIPs declining even faster, This ETF Tracks the price of these TIPs and we can see that it is breaking through support even though the CPI has only retraced half way. If the CPI continues on this path and the Bond Market continues to price in Long Term Deflation, we should then see the pricing of this TIPs based ETF come down crashing in a big way. If that does happen, I would target at least the 1.618 Fibonacci Extension.

US debt ceiling debacle and US 10-year yieldsUS 10-year bond yields have been trending lower since Oct 2022 after touching high around 4.250%. The rise in the 10-year yield from the past two weeks saw yields stop just short of the blue 61.8% Fibo level of 3.885%. Yields are currently testing the 200-day MA rate of 3.649% and a break below will allow bonds to rally further towards the 50-day MA rate of 5.525% which coincides with the black 61.8% Fibo rate of 3.474%.
I expect bond yields to get intimidating soon as the bond rally runs out of steam. Here follows the main fundamental reasons why I believe 10-year bond yields will soon climb above 4.00%.
1. Global financial conditions are easing, and excess liquidity is rising. Short-term rates seem to be peaking not just in the US but globally. Once global rates have peaked, it will allow the market to price in a future cyclical upturn for the US economy. Longer-term yields will capture this sentiment by moving higher as investors will prefer riskier assets to reap the rewards on buoyant liquidity conditions.
2. Inflation is becoming entrenched. Bonds are not a good inflation hedge which will further motivate the sell-off in longer-term treasuries. Heightened inflation expectations are the canary in the coal mine warning that bond holders may soon demand extra yield to lend money.
3. Bond issuance will rise when the debt-ceiling debacle is resolved. Additionally, the debt ceiling has brought scrutiny to the US’s fiscal situation which will dampen investor appetite for US debt (safe haven or not). Furthermore, foreign reserve holders have begun to diversify their holdings, while elevated short-term rates have raised FX hedging costs and kept buyers like Japan away.

Yields Prepped to Spike Higher after a Confirmed TLT BreakdownThe TLT has broken down an Ascending Broadening Wedge and given us one Bearish Confirmation back test; now we are looking for a second lower high within the range of the breakdown to truly get convicted on the move. However, for the time being, I do think this chart should be watched, as I have a suspicion that a lot of the shorter- and midterm bond yields are going to spike higher along with the US Dollar for reasons I already explained in this post here:

TMV leverage inverse ETF for treasuries SHORTTMV on the one-hour chart tested two standard deviations above the mean VWAP in
both late May and early July it fell to one standard deviation below VWAP but then rose
sharply into beyond the two standard deviations line ( thick red ) ascending into a YTD high.
I believe that this is due to the recent federal debt creditworthiness downgrade.
The threatened rise of BRICS reserve currency and potentially adversely affects the
value of the dollar ( DXY) while supporting gold prices. I see this as a good continuation play
no matter the overextension of price. Both the dual MTF and the zero lag MACD however
suggest a pullback. The mass flow indicator does as well. As a result I will look at TMF
to go long trusting the indicators to give me a directional bias.
