SOLANA can hold the cycle trend to up $250Solana is now at an important level of trend, and can hold in the coming time the cycle key level for a new power trend increase to up $250 in the coming time.
On the low time frame $220 can be the next target, when BTC has a stability trend or an increase trend.
Trend
UDS - Correction Inside an Uptrend: Eyes on 1.45–1.35UDS remains overall bullish on the 4H , riding a rising channel. After the impulse, price is drifting in a falling channel and inching toward the lower blue trendline.
The 1.45–1.35 area is key 🔑. It lines up with channel support and a prior structure base—clean confluence for buyers to step in. As long as it holds, I’ll look for trend-following longs toward 1.80 first, then 2.00–2.20 on momentum 🚀.
If 1.35 breaks and holds, I’ll step aside and reassess a deeper pullback toward 1.25 before looking for fresh confirmation ⏳.
What’s your move here => buy the dip at confluence or wait for a break of the red channel before joining? 🤔
⚠️ Disclaimer: This is not financial advice. Always do your own research and manage risk properly.
📚 Stick to your trading plan regarding entries, risk, and management.
Good luck! 🍀
All Strategies Are Good; If Managed Properly!
~Richard Nasr

NZDCAD: Weak Bearish SignalThis pair is interesting, but must be approached with caution.
Daily Timeframe:
Price crosses below HTL, but the overall daily price action is quite chaotic so should proceed with caution
H1 Timeframe:
Price fails to make a new higher high on the intraday timeframe, which is a good sign that this uptrend is weakening
There's also greater confluence with the overall downtrend as price crosses below ATL
Another indication of downtrend is price below EMA20 and EMA20 is pushing below EMA60

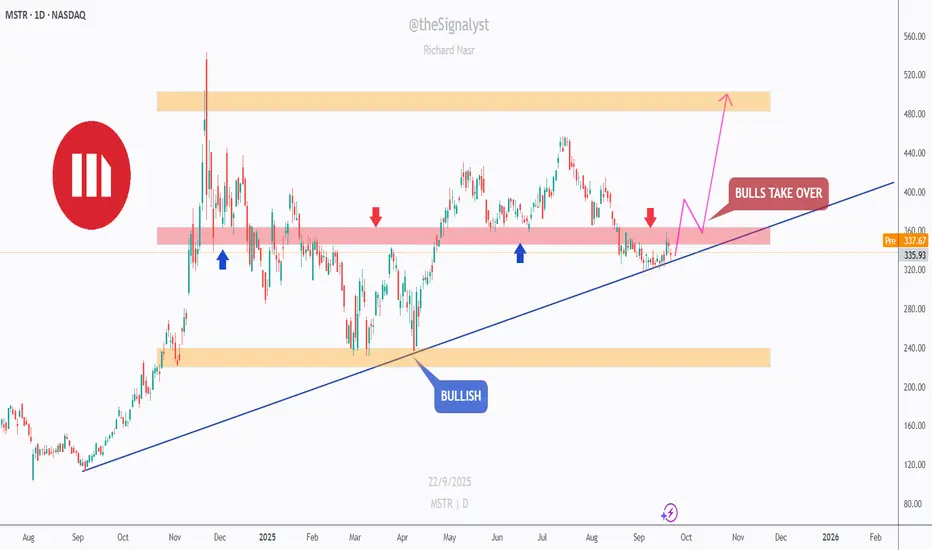
MSTR - Trendline Support vs. Supply Cap!MSTR has been overall bullish on the daily, respecting a rising trendline since last year. Price is coiling right beneath the 330–350 supply band after multiple rejections.
This area is key 🔑. It overlaps prior supply and the rising trendline—clean confluence. If bulls defend the trendline and we see a clean daily close above 350, momentum could extend toward 400 first, then 470–520 inside the broader range 🚀.
If the trendline gives way, I’ll look for a deeper dip toward 260–240 demand before bulls try again. Until then, structure favors the upside while the line holds.
What’s your plan => buy strength above 350 or wait for a retest on the trendline first? 🤔
⚠️ Disclaimer: This is not financial advice. Always do your own research and manage risk properly.
📚 Stick to your trading plan regarding entries, risk, and management.
Good luck! 🍀
All Strategies Are Good; If Managed Properly!
~Richard Nasr
GBPNZD: Trend ContinuationMomentum is picking again on the GBPNZD pair. Here are my observations on the daily and H1 timeframes.
Daily Timeframe:
HTL marks a resistance turned support
Price is also exiting the EMA areas, which is an indication of momentum
H1 Timeframe:
Price shows momentum as it crossed above the DTL
Price shows confluence with higher timeframe trend as it holds above EMA20
Uptrend is signaled by EMA20 remaining above EMA60

AUDCHF: Weak TrendMomentum is beginning to pick up on the AUDCHF pair. This is based on the EMA behavior along with price's behavior around the ATLs plotted. Here are my observations across two key timeframes.
Daily Timeframe:
Price crosses below ATL > first indication of momentum picking up
EMA20 is beginning to move away from EMA60 > second indication of momentum
H1 Timeframe:
EMA20 diverges away from EMA60 > indication of momentum
Price crosses below intraday HTL > confluence with overall downtrend if there isn't a liquidity trap

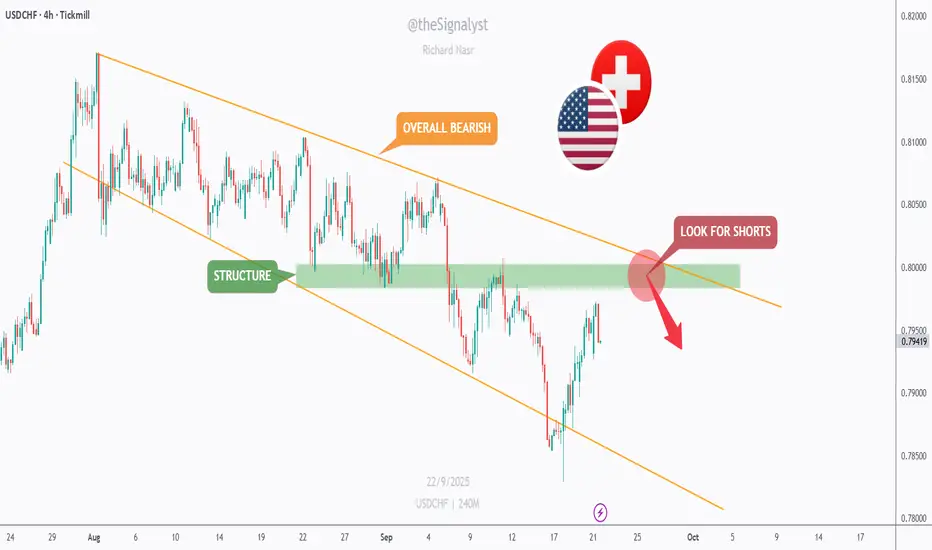
USDCHF — Rally Into Structure, Short the Retest?USDCHF has been overall bearish on the 4H, sliding inside a falling channel. After a bounce, price is rotating back into the 0.798–0.802 structure zone, right at the channel’s upper bound.
This confluence is key 🔑. If sellers react here, I’ll look for rejection shorts toward 0.790 first, then 0.785–0.780 near the channel floor. A clean 4H close and hold above 0.802 would invalidate the idea and expose 0.806–0.810 next ⏳.
What’s your plan => fade the rally at supply, or wait for confirmation before jumping in? 🤔
⚠️ Disclaimer: This is not financial advice. Always do your own research and manage risk properly.
📚 Stick to your trading plan regarding entries, risk, and management.
Good luck! 🍀
All Strategies Are Good; If Managed Properly!
~Richard Nasr
EURAUD: Counter-Trend TradeNot my conventional signal as this one is looking to trade in the opposite of the trend.
Daily Timeframe:
EMA20 is barely below EMA60 > downside momentum might pick up
Price is barely crossing below EMA20 > another indication of downside momentum
Price crossed below ATL, pulled back, and now seems to be continuing lower
H1 Timeframe:
Price crosses below ATL > first indication of uptrend failing to continue
Note that EMA20 is above EMA60 still > there is a risk that this will trap sellers

GBP/USD - 1H Forecast - YoYo Trade Setups🇬🇧🇺🇸 GBP/USD – 1H Breakdown
Cable’s been wildin’ 🤯 — we smashed into that daily imbalance, tapped supply, and now price is bleeding lower straight into demand.
🔑 What’s Cooking:
Price tagged the Daily IMB + 71% retrace, then dumped.
Now chilling near demand around 1.345 – 1.348 (possible snack stop 🍫).
If bulls defend here → we get a bounce back toward 1.357 – 1.360 supply for a cheeky liquidity grab 🏹.
From there? Expect a heavy distribution dump back toward 1.3350 lows 📉
🎯 Playbook:
Demand bounce → push into 1H / 4H supply.
Reject at supply → sell-off continuation.
🔍 Outlook
Short-term: Relief bounce incoming 🕺
Mid-term: Looking heavy, bears wanna drag this lower.
Bias : Bounce first → then bigger dump 🚀🔪

AUD/USD - Forecast (To fall further)🇦🇺🇺🇸 AUD/USD – 8H Breakdown
AUD/USD just wrapped up that juicy Wave 3 run and topped near 0.6780. Now we’re cooling off with a corrective pullback — perfect spot to hunt buys 👀
🎯 Buy Zones
Buy Zone 1: 0.6520 – 0.6530 → first bounce area ⚡
Buy Zone 2 (Preferred): 0.6460 – 0.6480 → 71% retrace + wedge support 🏹
📈 Playbook
Let price dip into demand (ideally Buy Zone 2).
Load up → ride it back toward 0.6700.
If bulls flex, we sweep those 0.6780 highs for liquidity. 🚀
🔍 Outlook
Short-term: Expect deeper retrace into demand.
Mid-term: Bulls looking for another leg higher.
Bias : Pullback → Buy continuation 🔥

USD/JPY - Fake Breakout. Is price Distributing💹 USD/JPY – 4H Forecast
Weekly Structure:
Price is still holding strong above demand, with 151.0 acting as the big liquidity magnet.
Daily Structure:
We’ve been stuck in a wide consolidation range between 146.0 support and 150.9 resistance. Market keeps faking both sides, but bulls are slowly regaining control.
4H Structure:
Recent fake breakout/manipulation flushed stops before shifting bullish.
Imbalances (Daily + Weekly) got filled on the push up.
Price is now respecting the bullish structure, eyeing a move higher.
Buy Zone 1 (Preferred): 146.7 – 147.0
Buy Zone 2 (Needs confirmation): 146.1 – 146.2
Upside liquidity target sits around 150.9 – 151.0 BSL.
🔍 Outlook
Short-term: Pullback into demand zones.
Mid-term: Bullish continuation → eyes on 150.9 – 151.0.
Bias : Short-term retrace → Mid-term bullish.

XRP - Triangle Breakout, Eyes on 3.2?XRP broke out of its descending triangle on the daily and shifted the structure bullish. Price is now trading inside the 3.00–3.20 resistance band.
This zone is key 🔑. It’s prior supply and the top of the range. A clean daily close above 3.20 would open 3.40, then 3.60+ inside a fresh markup leg.
If buyers fail to clear it, I’ll watch for a healthy dip toward 2.80–2.90 (triangle base + demand) to reload. Bias stays bullish while the 2.70–2.80 floor holds.
What’s your plan - buy the break above 3.20 or wait for a retest into 2.80–2.90? 🤔
⚠️ Disclaimer: This is not financial advice. Always do your own research and manage risk properly.
📚 Stick to your trading plan regarding entries, risk, and management.
Good luck! 🍀
All Strategies Are Good; If Managed Properly!
~Richard Nasr

USD/CHF - Trade Setup🔎 Bias
Short-term bullish continuation after BOS confirmation.
📊 Technical Breakdown
1H Structure: Market broke structure (BOS) after sweeping liquidity below 0.7890.
Demand Zone : 0.7885 – 0.7900 aligns with 71% fib retracement and MSS reversal.
Liquidity : Sell-side cleared, price reclaiming higher order flow.
Targeting : Re-test of previous range highs + imbalance fill above 0.8030.
🎯 Entry / Exit
Entry zone: 0.7890 – 0.7900
Targets:
TP1: 0.7960
TP2: 0.8030
Invalidation : Below 0.7870
⚖️ Risk Management
SL below 0.7870
Risk 1–2% only, scaling partials at TP1
📌 Outlook
Clean structure shift, demand respected, and liquidity sweep complete. If bulls maintain control, upside continuation toward 0.8030 is on the cards.
Bias : Bullish continuation 📈

XAUUSD 30M – Intraday Plan Around the RangePrice is consolidating between $3,660.93 (resistance / buy trigger) and $3,626.93 (support / sell trigger). Current price is near $3,648, sitting mid-range. Breakout confirmation is key.
🔼 Bullish Plan (needs confirmation)
Trigger: 30-min body close above $3,660.93.
Targets: $3,662.79 → $3,665.17 → $3,669.30.
Management: Take partials at the first target, move SL to breakeven once $3,661 is cleared, trail remainder if momentum continues.
🔽 Bearish Plan (clean if floor breaks)
Trigger: 30-min body close below $3,626.93.
Targets: $3,621.49 → $3,619.00 → $3,616.88.
Management: Scale partials at the first target, protect remaining position at breakeven. Trail if selling momentum builds.
🔄 Range Scalp (higher risk — small size)
Shorts: rejection near $3,659–$3,660, target $3,648–$3,650, SL above rejection high.
Longs: bounce near $3,627–$3,628, target mid-range (~$3,640–$3,645), SL under wick low.
✅ Break Confirmation
Strong 30-min body close beyond the trigger.
Expansion candles with follow-through.
❌ Invalidation
Breakout closes back inside the box on the next bar.
Multiple wicks through levels without momentum.
📌 Bottom Line
Above $3,660.93 → bullish bias toward $3,662.79 → $3,665.17 → $3,669.30.
Below $3,626.93 → bearish bias toward $3,621.49 → $3,619.00 → $3,616.88.
Inside range = scalp only, keep risk tight.

This $PENGU Can Fly
Summary
COINBASE:PENGUUSD has traced a broad 2025 “cup” base, with April setting the low and price now back to the January supply shelf. Price forming a bullish wedge just below all-time highs. As we retest what I call the "blue sky" box, we attempt to resolve a contracting wedge to the upside, printing a fresh daily higher high (HH). While price accepts above local resistance, the path of least resistance is higher with an initial magnet toward the ATH "blue sky" box.
Market Structure and Setup
The higher-timeframe structure is the completed cup + reclaim of the former supply shelf ("blue sky" box). On the daily, the sequence is: retest of the shelf as support → wedge compression → upside break → HH. This multi-timeframe alignment (HTF reclaim + D1 momentum) provides defined risk against the shelf and clear upside reference points (ATH → extensions).
Fibonacci-Based Upside Roadmap
Anchor the swing from the April handle low to the August/September impulse high. The roadmap is:
First waypoint: prior ATH band / 1.00 extension (supply; expect reactions).
Continuations: 1.272 and 1.618 extensions of the April → August leg as conditional targets if ATH is accepted and weekly momentum persists.
These are waypoints, not promises—active only while price holds above the reclaimed shelf.
Microstructure: Acceptance > Expansion
The break produced a HH, but the higher-quality entry often comes from acceptance: a shallow pullback that holds the top of the blue box and forms a D1/4H higher low (HL). That HL becomes the pivot to trail against. If momentum continues without a pullback, treat local range highs as a go-with trigger and manage tightly.
Execution Plan
Setup A – Retest Buy (preferred): Accumulate on a controlled retest into the blue breakout box, then look for a 4H reclaim and higher low to confirm buyers. Invalidation is a daily close back below the shelf or loss of the HL. Distribute into the ATH band first; let a runner work toward 1.272/1.618 if acceptance above ATH materializes.
Setup B – Continuation Buy: If there’s no retest, enter on a clean break-and-hold above the recent HH as a momentum trigger. Invalidation sits under the breakout pivot (last 4H swing). Use smaller size and trail faster given the paid-up entry.
Setup C – Failed-Break Short (contingency/hedge): Engage only if price loses the shelf on a daily close and then rejects on a reclaim attempt from below. Invalidation is re-acceptance back above the shelf. Targets are the cup’s midpoint and the 50–61.8% retrace of the April → August impulse.
Invalidation Criteria
Near-term: a daily close back below the blue shelf = reclaim failed; stand down and wait for fresh structure.
Structural: a weekly close back inside the mid-cup range would negate the completed base and argue for more time/width.
Risk & Sizing
Risk ≤1% per idea; position size = account_risk ÷ (entry→stop). Cut risk further if liquidity is thin or wicks are frequent.
Use reduce-only stops and avoid clustering at obvious lows/highs.
Take 30–50% into ATH supply; trail the remainder beneath 4H HLs or a fast EMA pair (e.g., 8/21) to self-finance the trade.
Fundamental/Flow Linkages
As a high-beta crypto/NFT-adjacent asset, PENGU’s tape is sensitive to broad crypto liquidity, meme-beta flows, and listing/funding dynamics. A trending BTC/ETH backdrop and favorable risk sentiment are supportive; adverse headlines, liquidity air-pockets, or exchange changes can truncate moves abruptly.
Key Risks
Crypto beta: a risk-off impulse in majors typically unwinds alt momentum irrespective of local structure.
Liquidity/venue risk: thinner books can produce stop-hunts and gap moves; listing or market-maker changes can impact spreads.
Narrative fatigue: meme/NFT-linked tokens can overshoot then mean-revert sharply as attention rotates.
Technical failure: acceptance back below the shelf converts today’s support back into resistance and invites a deeper cup-middle retrace.
Conclusion
While PENGU consolidates around ATHs, I want to be long on retests that form higher lows or on clean continuation through range highs. First distribute into the ATH band; if acceptance builds above it, press runners toward the 1.272 → 1.618 roadmap. Lose the shelf on a daily close, and the trade is off until structure rebuilds.
Not financial advice. Levels and sizing should be adapted to your process and constraints.

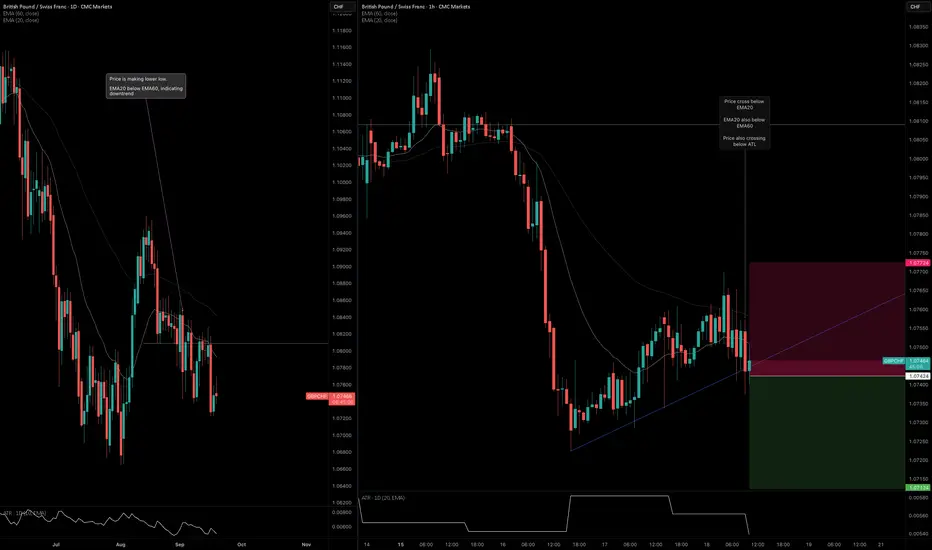
GBPCHF: ATL BreakoutI noticed confluence over on the GBPCHF pair. Here's the breakdown on the daily and H1 timeframes.
Daily Timeframe:
EMA20 is below EMA60 > downtrend structure
Price is also bouncing below EMA20 > confirms downtrend
Price also holding below HTL based on previous end at bearish candle
H1 Timeframe:
Price is exiting the EMA band > momentum has high potential to accelerate lower
EMA20 is below EMA60 and expanding > confluence that momentum is accelerating
S&P 500 Outlook: Bearish Pullback While Under 6,634SPX500 – Technical Overview
The S&P 500 recorded a new all-time high at 6,633 as markets brace for the Federal Reserve’s rate decision later this week.
Futures remain supported by expectations of a 25 bps cut, while traders await Powell’s commentary for guidance on inflation, labor-market weakness, and tariff risks.
Monday’s rally to record highs was fueled by optimism around U.S.–China trade talks, strong tech performance, and fresh gains in gold and mining stocks.
Technical Outlook
📉 Bearish correction:
While price trades below 6,634, a near-term pullback is favored.
Downside targets: 6,605 → 6,590, with deeper support at 6,571 if selling pressure accelerates.
📈 Bullish continuation:
A confirmed 1H close above 6,634 would reassert bullish momentum.
Next upside targets: 6,662 → 6,700.
📌 Market Context:
The Fed’s meeting and Powell’s tone remain the primary catalysts. A dovish message or stronger-than-expected cut could fuel a breakout above 6,634 toward new highs, while a cautious or hawkish stance may encourage a deeper correction before the next bullish leg.

NZDUSD - Follow The Bulls AGAIN!Hello TradingView Family / Fellow Traders. This is Richard, also known as theSignalyst.
📈NZDUSD has been overall bullish trading within the rising broadening wedge marked in blue.
This week, NZDUSD has been retesting the lower bound of the wedge.
Moreover, the green zone is a strong structure.
🏹 Thus, the highlighted blue circle is a strong area to look for buy setups as it is the intersection of the lower blue trendline and green structure.
📚 As per my trading style:
As #NZDUSD approaches the blue circle zone, I will be looking for trend-following bullish reversal setups (like a double bottom pattern, trendline break , and so on...)
📚 Always follow your trading plan regarding entry, risk management, and trade management.
Good luck!
All Strategies Are Good; If Managed Properly!
~Richard Nasr

GOLD HAS DOWN TO 3.658 AFTER THE STRONG ZONE 3690 - 3700 📊Market Structure
🔤After the strong rally from 3640 → 3700, price has formed multiple BOS, confirming a bullish structure.
🔤However, upon tapping the supply zone 3690 – 3700, a bearish CHoCH appeared, pushing price back down to 3,658, signaling that sellers are currently in control in the short term.
🔤Unfilled FVGs and order blocks below remain as potential targets for price to mitigate.
💡Trade Plan
🔼Scenario 1 – Short with the short-term trend
Entry: 3680 – 3690 (Supply + FVG)
Condition: Wait for bearish reaction (CHoCH/BOS on M5–M15).
Reason: Market has shown a bearish CHoCH, and supply above is where sellers are aggressive → suitable for shorting with the short-term momentum.
🔼Scenario 2 – Long from deeper demand
Entry: 3635 – 3640 (Demand + FVG)
Condition: Look for bullish BOS on lower timeframe.
Reason: This is the main demand zone, with high probability for buyers to step back in.
🔽Scenario 3 – Break & Retest Short
If price breaks below 3650 with a strong candle → wait for a retest at 3650 – 3655 to sell again.
Reason: This shows weak buyers, and the market is targeting lower liquidity levels.
➡️ Short-term bias leans bearish, but the 3635 – 3640 zone remains the key decision point — whether price bounces back up or breaks deeper to the downside.

EURJPY: Trend ContinuationNot many confluences here, but there's one key observation on the daily timeframe and another key observation on the H1 timeframe.
Daily Timeframe:
Price crossed the HTL two days ago, and failed to close below it yesterday
The current session's bullish bar signals that momentum is likely to continues upward
H1 Timeframe:
The DTL isn't really at play anymore, not fully marking a clean momentum break
However, price crossing above the EMA20 and exiting the EMA20-60 band signals intraday momentum is accelerating as well

Gold - Everything is Possible, as Always🚀 FX_IDC:XAUUSD Gold's Wild Ride: What's Brewing After the $3674 High? 🤯
Hey Goldbugs! 🤩 Our shiny friend, XAUUSD, has been on an absolute tear lately. Market makers did their magic, nudging Gold to a comfy spot around $3640, just shy of its ALL-TIME HIGH of $3674! 🚀 But now... crickets. What's next for our "always up" precious metal? Let's decode this mystery in a flash! 👇
The Lowdown: Why Gold's Taking a Breather 😴
1. The "Less Bad" News Effect:
Recent U.S. data has been... well, "less bad". Inflation/deflation drama is cooling off, and markets are starting to think things aren't as grim as they were. This makes some traders less keen on Gold, but don't forget the big players (institutions!) still need their fix. So, a tug-of-war begins! ⚔️
2. Overheated Engine Syndrome! 🌡️
Gold's run from $3321 to $3674 was a whopping +10.5% ($353!) at an almost 45-degree angle! That's impressive, but even the best engines need to cool down. Our daily RSI values have been chilling above 75% – that's "overheated" territory! 🔥 A correction is basically Gold taking a well-deserved nap.
The "C" Word: What Correction Looks Like 📉
Forget complicated math! A correction is usually a 10-20% price dip. Given Gold's recent sprint, we could be looking at a 20-30% pullback from that $353 gain, meaning a possible $70-$105 drop. 📉
Target Zones?
Many eyes are on $3580. But hey, Gold likes surprises! It could go lower, perhaps even test $3550 or more!
Your Trader's Toolkit:
Don't Get Caught Napping! 🛠️
Want to predict Gold's next move? Here's your cheat sheet:
Candlestick Clues: Watch for Shooting Stars 🌠, Hanging Men 🕯️, Spinning Tops, and Dojis. These are like little whispers telling you the trend might be tired.
EMA Lines: These are your trend compasses!
Fibonacci, Baby! 💫 Seriously, if you haven't, dive into Fibonacci Channels and Circles. They're like a crystal ball for price moves!
Economic Calendar: 🗓️ CPI, PPI, NFP, and U.S. Inflation Data are Gold's daily bread and butter. Know them!
🧠 ICT Insights: What the Pros Are Seeing 📊
Market Structure Shift (MSS): After hitting $3674, Gold's current wiggles (Lower Highs & Lower Lows) within this consolidation hint at a short-term shift in order flow. It's not a full reversal, but a pause for thought. If you look closely, you can see a Bull Flag Pole exists and the Flag is forming, currently a triangle, a good sign before the liquidity needs to get taken out from the bottom.
Liquidity Magnets:
Buy-Side Liquidity (BSL): Loads of orders (and stop losses!) waiting above $3674. That's a juicy target if Gold decides to moon again!
Sell-Side Liquidity (SSL): Plenty below the recent low around $3590-$3600. A dip here could be a "stop hunt" before bouncing.
Fair Value Gaps (FVG) & Order Blocks (OB): Those rapid green candles left "gaps" and "blocks" during the ascent. Gold loves to retrace and "fill" these gaps or retest these blocks ($3590-$3600 is a key OB zone!) before its next big move.
The Verdict? Gold's Not Done Yet! ✨
Is Gold heading for $3700+? YES! But probably not right now. A little cooldown, a bit of retracement to those key support levels and ICT zones, seems inevitable.
So, what to do? Be patient, be responsible with your capital, and keep your eyes peeled for those technical clues. Gold's next big move could be around the corner!
Next Week's Radar (ignoring the news for a sec):
Bullish Target: $3800 🚀
Bearish Target: $3550 🐻
Significant large orders are on
Sell Stop: 3611
Sell Limit_ 3657, 3659
Buy Limit: 3600, 3580, 3500
Buy Stop: 4497
-------------------------------------------------------------------------
This is just my personal market idea and not financial advice! 📢 Trading gold and other financial instruments carries risks – only invest what you can afford to lose. Always do your own analysis, use solid risk management, and trade responsibly.
Good luck and safe trading! 🚀📊

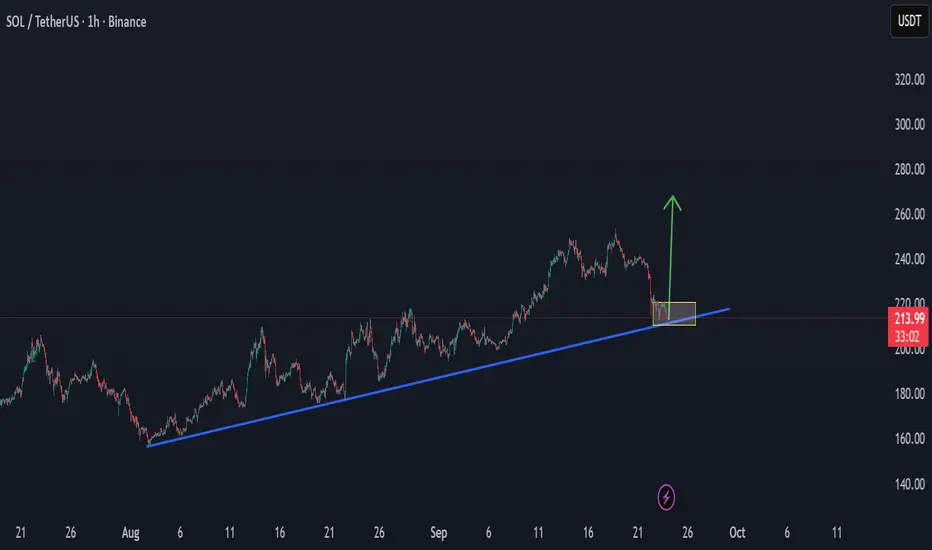
SOL – Bulls Holding the Channel!SOL has been overall bullish, trading inside a clean ascending channel. Price broke above the $215 – $220 structure zone and pushed higher, but is now pulling back for a retest.
This zone is key 🔑 . It aligns with channel support, making it a strong confluence for buyers to step in. If bulls defend it, momentum could continue, and SOL may push toward higher levels inside the channel 🚀.
If the zone fails, a deeper correction could follow before another attempt from the bulls. Until then, the bias remains bullish as long as structure holds.
What do you think — will the bulls 🐂 step in and send SOL flying again, or will bears take over for a deeper pullback? 🤔
⚠️ Disclaimer: This is not financial advice. Always do your own research and manage risk properly.
📚 Stick to your trading plan regarding entries, risk, and management.
Good luck! 🍀
All Strategies Are Good; If Managed Properly!
~Richard Nasr

GOLD TREND MOVEMENTGold's bullish impulsive move up to 3700 and after we see a bearish retracement up till 3660's
Note that this move is merely a pullback before a continued bullish hedge as the trend depicts.
As we anticipate the fundamentals- economic news data, we also foresee a continued bulliish hedge at the base of trend
