EURAUD – Channeling the Bears!EURAUD has been overall bearish 📉, trading inside a clear descending channel.
Price recently bounced and is now retesting the 1.7800 structure zone, which aligns with the upper bound of the channel. This area is acting as a strong confluence 🔑, making it a potential spot to look for short opportunities.
As long as price remains below this structure, sellers 🐻 are likely to stay in control, with downside continuation toward the channel’s lower bound.
Patience ⏳ is key here — waiting for bearish confirmation can provide a cleaner entry and reduce risk.
⚠️ Disclaimer: This is not financial advice. Always do your own research and manage risk properly.
📚 Stick to your trading plan regarding entry, risk, and trade management.
Good luck!
All Strategies Are Good; If Managed Properly!
~Richard Nasr
Trend

EURUSD - Follow The Bulls Indeed!Hello TradingView Family / Fellow Traders. This is Richard, also known as theSignalyst.
📈EURUSD has been overall bullish trading within the rising channel marked in blue.
This week, EURUSD has been retesting the lower bound of the channel.
Moreover, the orange zone is a strong demand.
🏹 Thus, the highlighted blue circle is a strong area to look for buy setups as it is the intersection of the lower blue trendline and orange demand.
📚 As per my trading style:
As #EURUSD approaches the blue circle zone, I will be looking for trend-following bullish reversal setups (like a double bottom pattern, trendline break , and so on...)
📚 Always follow your trading plan regarding entry, risk management, and trade management.
Good luck!
All Strategies Are Good; If Managed Properly!
~Richard Nasr

EURGBP – Battleground of Supply and Demand!EURGBP has been trading between clear supply and demand zones ⚖️, respecting both ends of the range.
After rejecting the 0.8750 supply zone, price turned lower, showing that sellers remain in control. Currently, EURGBP is hovering around the 0.8620 – 0.8640 demand zone, where buyers previously stepped in.
This area forms an important decision point 🔑:
- If demand holds, we could see a bounce back toward mid-range levels.
- If broken, a continuation lower would confirm supply’s dominance 📉.
Patience here is key ⏳ — waiting for confirmation at these zones can help filter out false moves and set up a cleaner trade.
⚠️ Disclaimer: This is not financial advice. Always do your own research and manage risk properly.
📚 Always follow your trading plan regarding entry, risk management, and trade management.
Good luck!
All Strategies Are Good; If Managed Properly!
~Richard Nasr

USDCHF: Trend ContinuationGoing to make a trend continuation play on the USDCHF pair. I think there's a few levels to look at on both the daily and hourly levels.
Daily Timeframe:
Price crossed the daily HTL at the beginning of September
Price pulled back three days level but still held below it
H1 Timeframe:
This is the second ATL that price is crossing; based on the first ATL cross, movement is clean
Price did not exit from the EMA20/60 band so should reduce side

EURUSD - Already Overbought!Hello TradingView Family / Fellow Traders. This is Richard, also known as theSignalyst.
📈EURUSD has been overall bullish trading within the rising channel marked in blue.
However, it is currently retesting the upper bound of its channel.
Moreover, the green zone is a strong resistance.
🏹 Thus, the highlighted red circle is a strong area to look for sell setups as it is the intersection of the upper blue trendline and green resistance.
📚 As per my trading style:
As #EURUSD approaches the red circle zone, I will be looking for bearish reversal setups (like a double top pattern, trendline break , and so on...)
📚 Always follow your trading plan regarding entry, risk management, and trade management.
Good luck!
All Strategies Are Good; If Managed Properly!
~Richard Nasr

CHFJPY: Trend ContinuationAfter a pullback throughout August, it seems like this pair is gaining its momentum back. Here are my observations over on different timeframes.
Daily Timeframe:
EMA20 is above EMA60, which signals there's an overall uptrend
Price also pulled back and stayed above the DTL, indicating that this breakout is successful
H1 Timeframe:
Price crosses above the DTL, which is another indication that trend confluence is resuming
EMA20 being above EMA60 and diverging is giving indications that momentum is likely picking up

CADCHF: Trend ContinuationCADCHF continues to remain bearish as it holds below the key level on the daily timeframe. Here's a summary of my key observations over on the daily and intraday timeframes.
Daily Timeframe:
Price broke the key support level in early September
After some sideways price action, price is currently making a bearish bar that engulfs the prior day's doji
H1 Timeframe:
Price broke through the ATL, which shows confluence with the downtrend
EMA20 is also below EMA60, moving further apart to signal momentum is picking up
Price is also below EMA20, which signals confluence with downtrend as well

EUR/USD - Trade Idea (Forecast Linked)🕰 Weekly View
Price is pushing away from major support at 1.14–1.15 and climbing into the 1.18–1.20 resistance zone. Weekly structure still favors upside momentum while support holds.
📉 Daily Structure
Resistance: 1.18–1.20 strong supply.
Support : 1.16–1.17 demand , with deeper discount demand sitting at 1.15–1.16.
Daily price action shows liquidity being swept both sides before a push higher.
⏱ 8H Breakdown
Price is reacting from unmitigated demand around 1.16–1.17. A wedge breakout is sending price toward resistance at 1.18–1.20. If rejected, look for retrace back into discount demand (1.15–1.16) before continuation.
🔎 Outlook
Scenario 1 → Sweep into 1.18–1.20 supply → retrace back into 1.15–1.16 discount demand → continuation higher.
Scenario 2 → Clean breakout above 1.20 accelerates toward 1.22+.
Bias : Short-term reaction lower possible → mid-term bullish continuation.

EUR/USD - Forecast 🕰 Weekly View
Price has broken out of the long-term downtrend and is now retesting the 1.16–1.17 support zone as new structure. If this level holds, momentum favors continuation higher toward 1.20–1.22.
📉 Daily Structure
Resistance: 1.18–1.20 supply zone.
Support: 1.16–1.17 demand base.
Daily structure shows accumulation and breakout, with price consolidating just under higher resistance.
⏱ 8H Breakdown
Price has respected the wedge breakout and is holding above demand. If support at 1.16–1.17 continues to hold, expect another leg up into 1.20+ targets. Failure here reopens downside back toward 1.12–1.13 demand.
🔎 Outlook
Scenario 1 → Hold above 1.16 and push into 1.20–1.22.
Scenario 2 → Rejection at resistance leads to deeper correction into 1.12–1.13.
Bias : Pullback into support → bullish continuation toward 1.20–1.22.

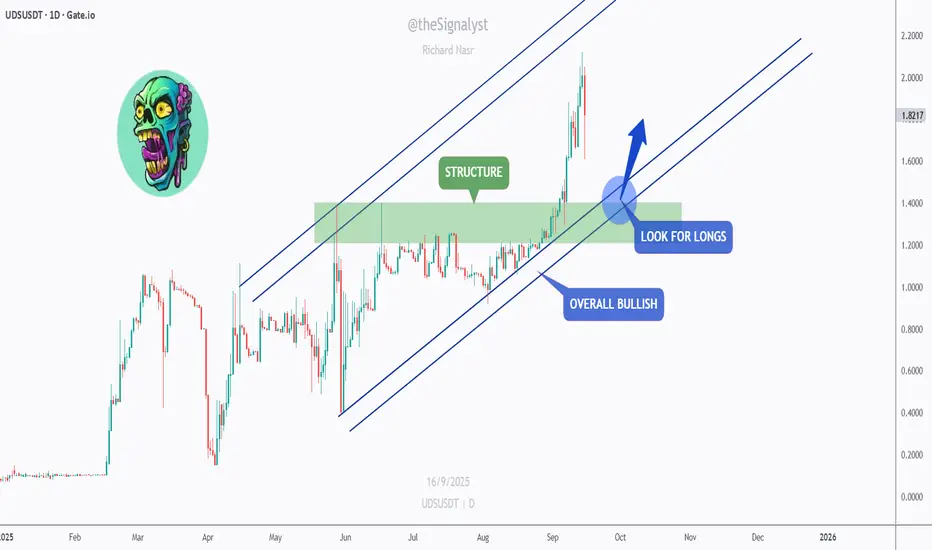
UDS – Bulls on the Move!Hello TradingView Family / Fellow Traders. This is Richard, also known as theSignalyst.
📈UDS has been overall bullish trading within the rising channel marked in blue.
This week, UDS has been retesting the lower bound of the channel.
Moreover, the green zone is a strong structure.
🏹 Thus, the highlighted blue circle is a strong area to look for buy setups as it is the intersection of the lower blue trendline and green structure.
📚 As per my trading style:
As #UDS approaches the blue circle zone, I will be looking for trend-following bullish reversal setups (like a double bottom pattern, trendline break , and so on...)
📚 Always follow your trading plan regarding entry, risk management, and trade management.
Good luck!
All Strategies Are Good; If Managed Properly!
~Richard Nasr
EUR/USD - Moving into Buy movements🕰 Monthly View
Price is breaking out of the major support/resistance zone around 1.18–1.20 after years of compression. Historically, this level has acted as a turning point, and now momentum favors the upside. MACD confirms strength with a bullish cross, pointing to continuation.
📉 Weekly Structure
Resistance: Cleared at 1.20, room to expand higher.
Support: 1.10–1.12 base holds as long-term demand.
Macro structure now looks like a sustained breakout phase.
⏱ Daily / Lower-Timeframe Perspective
Price has been steadily pressing higher without significant supply above. The clean breakout above 1.18 suggests little resistance until much higher levels, leaving upside open.
🔎 Outlook
Bullish momentum dominates. As long as price holds above 1.18, continuation toward 1.30+ becomes likely. MACD divergence that held the downside has now shifted, fueling the upside breakout.
Bias : Strong bullish continuation → mid-to-long term upside toward 1.30+.

XAUUSD Gold Trading Strategy September 15, 2025XAUUSD Gold Trading Strategy September 15, 2025: Weekly trend outlook, gold still has enough conditions for the possibility of continued price increases.
Basic news: After surpassing the 3670 USD/ounce mark, the highest level in history, the gold price has entered a correction phase, in the context of the market focusing on monitoring the policy moves of the US Federal Reserve (Fed). According to CME's FedWatch tool, investors are almost certain that the Fed will cut interest rates by 25 basis points, bringing the margin to 4 - 4.25%. However, the scenario of the Fed cutting 50 basis points is still considered, because this could cause the USD to plummet and push gold to skyrocket.
Technical analysis: The sideway range of 3600 - 3660 is still holding. Currently, we will wait for trading points at the 2 edges of the sideway range, but the priority is still mainly trading according to the trend.
Important price zones today: 3600 - 3605 and 3660 - 3665. Today's trading trend: Sideway.
Recommended orders:
Plan 1: BUY XAUUSD zone 3600 - 3602
SL 3597
TP 3605 - 3615 - 3635 - 3665 - OPEN.
Plan 2: BUY XAUUSD zone 3618 - 3620
SL 3615
TP 3623 - 3630 - 3650 - 3665.
Plan 3: SELL XAUUSD zone 3663 - 3665
SL 3668
TP 3660 - 3650 - 3640 - 3630 (small volume).
Wish you a new week of safe, effective and profitable trading.🥰🥰🥰🥰🥰

NZD/USD - Forecast🕰 Weekly View
Price is still respecting the monthly downtrend. Strong support sits lower at 0.55–0.56, but as long as price stays above recent structure, buyers could defend. Weekly imbalance still unfilled above.
📉 Daily Structure
Resistance: 0.61–0.62 (no clear supply above until that zone).
Support: 0.58–0.59 demand block.
Currently ranging mid-structure, building a base for the next push.
⏱ 4H Breakdown
Price is holding an 8H demand zone at 0.59 and has built a buyer level there. Short-term resistance sits near 0.61, where rejection could send us back to retest 0.59 before continuation.
🔎 Outlook
Scenario 1 → Retest 0.59 demand, then push into 0.61–0.62 supply.
Scenario 2 → Failure to hold 0.59 leads to deeper move into 0.56 strong support.
Bias: Pullback into demand → bullish continuation toward 0.61–0.62.

USD/CAD - Forecast 13/9🕰 Weekly
Price has been holding inside a swing range with support around 1.36 – 1.37 and resistance higher near 1.46. Structure hints at a bigger bullish leg if buyers step in.
📅 Daily
Market is pressing against a descending trendline and sitting in a parallel channel. Demand is building around 1.37 – 1.38, while upside targets point toward 1.41 – 1.42 if broken.
⏱ 8H
Price recently swept liquidity below (BSL) and is now coiling under resistance. If we hold 1.37 support, the path opens for a push into 1.40 – 1.41.
🎯 Outlook
Bullish Case: Hold above 1.37 → breakout toward 1.40 – 1.42.
Bearish Case: Lose 1.37 → deeper correction back toward 1.35 demand.
⚖️ Bias : Short-term consolidation → mid-term bullish toward 1.40+.
Thanks traders and like and follow if you agree

Gold - Forecast 13/9Weekly: Still bullish, but a demand zone sits lower with Imbalance at 3,400 – 3,450 if price pulls back.
Daily: Price is in a rising channel, starting to slow down. Demand at 3,520 – 3,560.
4H: Rising wedge forming, liquidity swept at highs. Two areas of Imbalance refined from weekly. Best buy zone = 3,460 – 3,480.
🎯 Outlook
Small pullback likely.
If 3,460 – 3,480 holds → push back to 3,640 – 3,660.
If not → deeper dip into 3,400 – 3,450 before continuing up.
⚖️ Bias: Short-term pullback → mid-term bullish.
Follow for more

BTC – the $130K Roadmap!CRYPTOCAP:BTC is showing strong bullish structure both short-term and long-term 📈
After forming a clean inverse head & shoulders at support, price broke higher and is now trading within a rising channel.
🟢 Bullish short-term: As long as BTC holds above the $113,000 – $115,000 structure zone, buyers remain in control.
📊 Bullish long-term: Price continues to respect the major ascending channel, keeping the bigger picture bias to the upside.
🎯 Next target: If momentum continues, BTC could be on track toward the $130,000 resistance.
Patience here is key ⏳ — pullbacks into support could offer fresh continuation entries for the bulls 🐂.
⚠️ Disclaimer: This is not financial advice. Always do your own research and manage risk properly.
📚 Stick to your trading plan regarding entries, risk, and management.
Good luck!
All Strategies Are Good; If Managed Properly!
~Richard Nasr

Mastering Market Rhythm Through Adaptation👋Welcome, everyone!
In my previous post, I shared “The Secret Formula: Time + Structure = 80% Win Rate!” – a powerful way to increase your trading accuracy. But here’s the truth: even the best formula won’t work if you apply it blindly to every situation.
That’s why today I want to dive deeper into the next key lesson:
👉 Mastering Market Rhythm Through Adaptation
Why is this important?
The market has its own rhythm. Sometimes it trends strongly, sometimes it ranges, and other times it becomes extremely volatile. If you try to force one strategy on every scenario, you’ll be out of sync – and out of money.
By adapting, you will:
Know when to trade aggressively and when to scale down.
Choose the right strategy for the right market phase.
Most importantly: protect your capital and survive long enough to thrive.
How to adapt in practice
- Identify the market condition: Trend – Range – High Volatility.
- Adjust your strategy:
Clear trend → trend-following.
Range-bound → trade support and resistance.
High volatility → reduce lot size, focus on risk control.
- Multi-timeframe analysis: H1 may look sideways while H4 shows a clear trend.
- Always prepare a Plan B: If the market shifts, you won’t be caught off guard.
Real-world examples
XAUUSD: Fed cuts rates → gold rallies → follow the trend.
EURUSD: Pre-news uncertainty, ranging between 1.0850 – 1.0950 → range trading.
BTCUSDT: ETF approval sparks huge volatility → cut position size, wait for stability.
Final thoughts
There is no “holy grail” in trading. The real edge comes from knowing how to dance in sync with the market’s rhythm . The formula Time + Structure shows you where and when, while market adaptation shows you how long you can stay in the game.
👉 Would you like me to share a live case study on XAUUSD , applying both Time + Structure and Market Condition Analysis step by step?

NEAR’s Biggest Move of 2025 Incoming?NEAR has been consolidating for months, carving out a textbook accumulation phase within the broader descending channel. Each previous cycle bottom (marked in red) has acted as a launchpad, and price is once again aligning with the cycle rhythm.
As long as the $2.5 – $2.7 demand zone holds, NEAR remains well-positioned for a potential breakout. A clean push above the short-term descending structure could ignite the impulse leg toward the $5.5 – $6.5 zone, where the next projected cycle top lies.
📌 Key Takeaways:
Structure: Price is respecting the descending channel with repetitive cycle bottoms and tops.
Accumulation: Sideways action suggests smart money is loading up.
Impulse Potential: Breakout could trigger a strong rally into the next resistance zone.
Invalid Level: A daily close back below $2.5 would put the bullish scenario on hold.
Patience is key here ⏳—waiting for confirmation above structure ensures we catch the move, not the noise.
⚠️ Disclaimer: This is not financial advice. Always do your own research and manage risk properly.
📚 Always follow your trading plan regarding entry, risk management, and trade management.
Good luck!
All Strategies Are Good; If Managed Properly!
~Richard Nasr

EURJPY: Uptrend ContinuationSeveral observations over on the daily and H1 timeframes.
Daily Timeframe:
EMA20 remains above EMA60, which indicates uptrend from a technical standpoint.
Price is also crossing above HTL so that's no longer holding as resistance.
H1 Timeframe:
Price crosses above ATL, pulls back, and holds above breakout level.
The demand zone is subjective but price's pull-back did remain above this zone.

BTC - The Head and Shoulders of the Year?Bitcoin is shaping one of the most powerful reversal patterns traders could ask for: the inverse head and shoulders. After holding the ascending channel’s lower bound and bouncing from the key structure zone, BTC is signaling that bulls may soon take over.
Here’s what stands out on the chart:
🟢 Bullish Channel: Price continues to respect the rising channel, maintaining its long-term bullish outlook.
🛡️ Structure Zone: The $110,000 – $113,000 region is acting as a crucial pivot, flipping from support to resistance.
🔄 Inverse Head and Shoulders: A textbook reversal setup is forming, with the neckline aligning perfectly with structure.
🚀 Bullish Breakout: A confirmed break above this neckline could trigger the next major impulse move, putting BTC back on track toward higher channel targets.
Bulls need a clean daily close above the neckline for full confirmation — until then, the setup is in play but not yet validated.
📌 Will this become the pattern of the year that propels Bitcoin to new highs?
This is for educational purposes only, not financial advice. Always manage your risk before entering any trade.
📚 Stick to your trading plan regarding entries, risk management, and trade execution.
Good luck!
All Strategies Are Good; If Managed Properly!
~Richard Nasr

SPELL/USDT HAS HIGH CHANCE TO BREAK UP $0,001Depending on last data and since BTC is positive Spell show that this can be the bottom and for new reenter to up $0,001, we will follow the coin for confirmations.

Gold Trading Strategy XAUUSD 11/9/2025Gold Trading Strategy XAUUSD 11/9/2025: Gold is stable, traders prepare ahead of important US CPI data, conditions and technical positions to watch.
Fundamental news: Spot gold prices were generally stable in today's Asian trading session, currently around $3630/ounce. Gold prices are in a wait-and-see mode, closely watching the all-time high before the release of US CPI data for August. Weak US PPI inflation data, fueling speculation that the Federal Reserve will continue its easing cycle at its upcoming meeting in September.
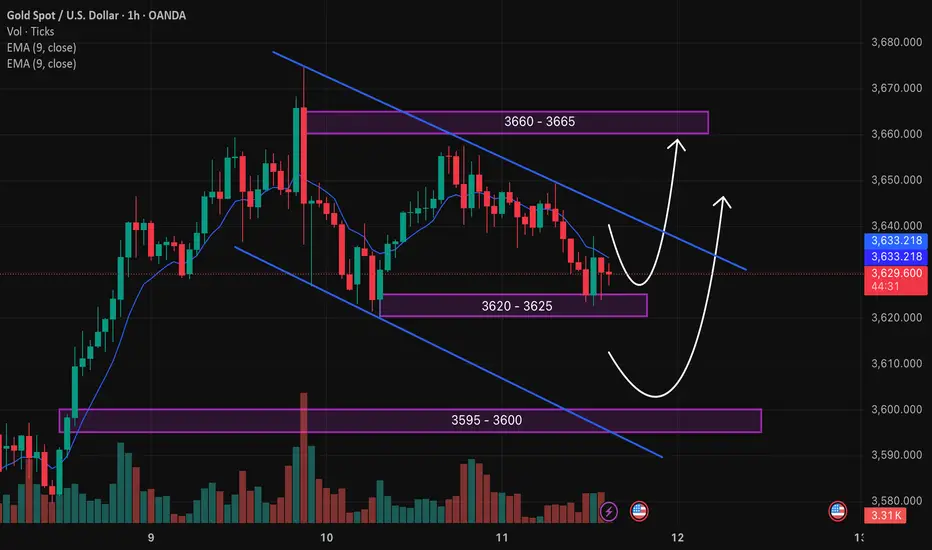
Technical analysis: After making the latest ATH at 3675, gold prices are correcting and forming a short-term downtrend channel in the H1 frame, however, the 3620 - 3625 area is still a good support zone for gold prices. Currently, there will be 2 scenarios with the highest probability of occurrence: Case 1: Gold price will form an upward price pattern around the 3620 - 3625 area and increase sharply, we will wait for the reaction when the price meets resistance at 3660 - 3665. Case 2: Gold price continues to follow the downtrend channel to the lower support area of 3595 - 3600 and then increase again. We will trade based on these 2 scenarios and still prioritize trading according to the main trend.
Important price zones today: 3620 - 3625, 3595 - 3600 and 3660 - 3665.
Today's trading trend: BUY.
Recommended orders:
Plan 1: BUY XAUUSD zone 3620 - 3622
SL 3617
TP 3625 - 3635 - 3645 - 3665 - OPEN.
Plan 2: BUY XAUUSD zone 3598 - 3600
SL 3595
TP 3603 - 3610 - 3630 - 3660 - OPEN.
Plan 3: SELL XAUUSD zone 3663 - 3665
SL 3668
TP 3660 - 3650 - 3640 - 3630 (small volume).
Wish you a safe, effective and profitable trading day.🌟🌟🌟🌟🌟

Gold Trading Strategy XAUUSD 11/9/2025Gold Trading Strategy XAUUSD 11/9/2025: Gold is stable, traders prepare ahead of important US CPI data, conditions and technical positions to watch.
Fundamental news: Spot gold prices were generally stable in today's Asian trading session, currently around $3630/ounce. Gold prices are in a wait-and-see mode, closely watching the all-time high before the release of US CPI data for August. Weak US PPI inflation data, fueling speculation that the Federal Reserve will continue its easing cycle at its upcoming meeting in September.
Technical analysis: After making the latest ATH at 3675, gold prices are correcting and forming a short-term downtrend channel in the H1 frame, however, the 3620 - 3625 area is still a good support zone for gold prices. Currently, there will be 2 scenarios with the highest probability of occurrence: Case 1: Gold price will form an upward price pattern around the 3620 - 3625 area and increase sharply, we will wait for the reaction when the price meets resistance at 3660 - 3665. Case 2: Gold price continues to follow the downtrend channel to the lower support area of 3595 - 3600 and then increase again. We will trade based on these 2 scenarios and still prioritize trading according to the main trend.
Important price zones today: 3620 - 3625, 3595 - 3600 and 3660 - 3665.
Today's trading trend: BUY.
Recommended orders:
Plan 1: BUY XAUUSD zone 3620 - 3622
SL 3617
TP 3625 - 3635 - 3645 - 3665 - OPEN.
Plan 2: BUY XAUUSD zone 3598 - 3600
SL 3595
TP 3603 - 3610 - 3630 - 3660 - OPEN.
Plan 3: SELL XAUUSD zone 3663 - 3665
SL 3668
TP 3660 - 3650 - 3640 - 3630 (small volume).
Wish you a safe, effective and profitable trading day.🌟🌟🌟🌟🌟