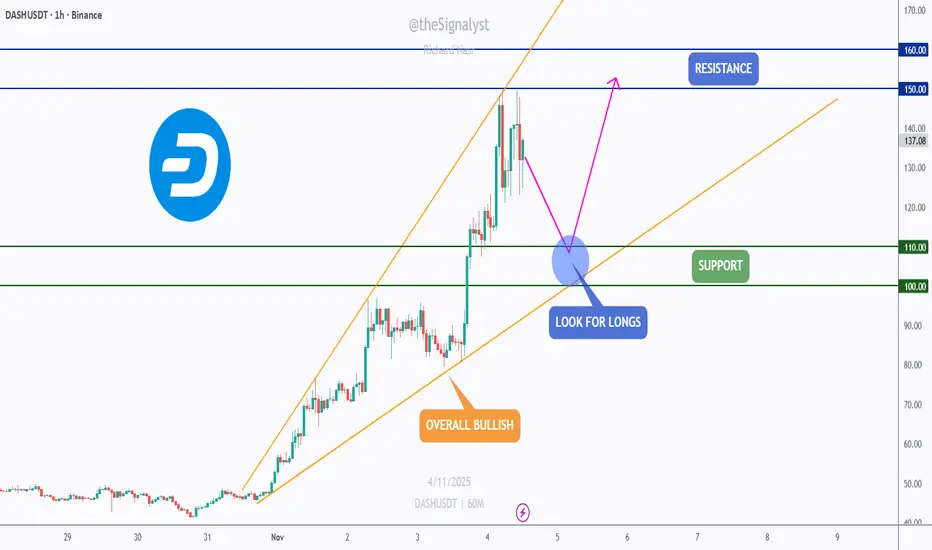
DASH - Top Performer Setting Up for the Next Leg!🏹DASH has been one of the top-performing altcoins this month, showing strong momentum and clear leadership among mid-cap assets.
💣After an explosive rally, price is now pulling back within a well-structured rising wedge, a healthy correction within an overall bullish trend.
As DASH approaches the intersection of support and the lower bound of the wedge, this confluence zone will be key to watch.
I’ll be looking for trend-following long opportunities from that area, targeting a continuation toward the $150–$160 resistance zone.
⚔️As long as the $100 support holds, the bulls remain firmly in control, and this dip could be the perfect opportunity to join the next wave up.
⚠️ Disclaimer: This is not financial advice. Always do your own research and manage risk properly.
📊All Strategies Are Good; If Managed Properly!
~Richard Nasr
Trend
AFTER THE BREAKDOWN 105K IS THE KEY LEVEL FOR RECOVERYWe have seen an unexpected breakdown in BTC, even despite the positive news about the China deal. BTC continued to decline further, although the data has generally been pointing in the right direction.
At the moment of writing, BTC is still in a downtrend. However, the $105K level could be a key point that triggers a potential recovery, depending on how the upcoming data unfolds.
We will continue to monitor whether BTC can enter the $105K zone in the coming time frames.

GBP/JPY Bullish Breakout SetupGBP/JPY is forming a bullish structure above the trend line after a break of structure (BoS). Price is consolidating and showing potential for an upward move toward the marked target zones near 203.00.

CADJPY - The Trio Retest Setup!📈CADJPY has been on a strong bullish run lately, but price is now approaching a critical confluence zone, the perfect Trio Retest Setup.
The red circle highlights the intersection of two upper trendlines (the rising channel and the short-term wedge) together with a major horizontal resistance at 111.00.
⚔️This trio intersection creates a powerful technical barrier, suggesting that the pair is overbought in the short term. From here, I’ll be looking for signs of exhaustion or reversal patterns to catch the next corrective leg down.
🔎A potential retracement could send CADJPY back toward the 106.00–105.00 support zone, which also aligns with the lower boundary of the main ascending channel.
Until the trio zone is broken decisively to the upside, the bears might step in to cool off the momentum.
⚠️ Disclaimer: This is not financial advice. Always do your own research and manage risk properly.
📊All Strategies Are Good; If Managed Properly!
~Richard Nasr

Gold Price Breakout Toward 4,037 Target(XAU/USD) is forming a symmetrical triangle pattern on the 1-hour chart, suggesting potential breakout momentum. The price is currently trading near $4,014, with an upside target of $4,037 if bullish momentum continues. Key support zones are located at $3,960, $3,920, and $3,880.

EURUSD - Preparing for the Next Wave of Bearish Momentum!🏹EURUSD remains trapped within a well-defined descending channel, with the market structure clearly favoring the bears.
Each rally has been met with selling pressure, forming a series of lower highs and lower lows, a textbook example of controlled downside continuation.
⚔️As price approaches the confluence zone, where the upper red trendline meets the horizontal structure around 1.1680–1.1700, I’ll be looking for potential trend-following short setups. This intersection has acted as a strong rejection point in previous moves, and it remains a key decision zone for sellers to step back in.
If rejection confirms there, the next leg lower could retest the 1.1550, then 1.1500 support areas.
On the flip side, a daily close above 1.1720 would be the first sign of a possible short-term shift in sentiment.
Until proven otherwise, the trend is clear — rallies are for selling.
⚠️ Disclaimer: This is not financial advice. Always do your own research and manage risk properly.
📚All Strategies Are Good; If Managed Properly!
~Richard Nasr

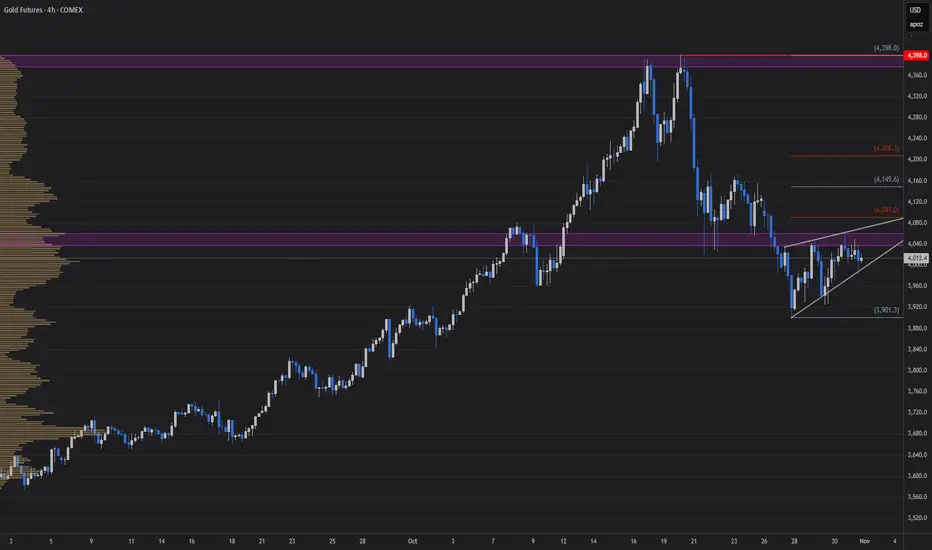
GC Higher or Lower?Looking at GC on the 4 hour TF, we see it consolidating in a small rising wedge. If price wants to continue higher, I will be looking for price to drop back down to the $3980s level and then move higher breaking out of the wedge. If price wants to continue lower, I will be looking for price to make its way up to the 38.2% Fibonacci level marked on the chart, around $4090s, before breaking back down and creating another leg down in its recent downtrend.
What are your thoughts on GC?
BTC Entering New Uptrend —Weekend Volume Could Drive Price $116+BTC Entering New Uptrend — Weekend Volume Could Drive Price Above 116K +🚀
Bitcoin is showing strong signs of recovery after stabilizing at the lower support zone near 106K. The current structure indicates that BTC is entering a new uptrend, with higher lows forming and momentum gradually building.
📊 Market Structure:
BTC successfully held the volume support area and has begun to reclaim key short-term levels.
A break above 112K would confirm the shift in market momentum toward bullish continuation.
The next key resistance and target zone sits around 116K–117K.
💥 Weekend Outlook:
Volume is expected to increase through the weekend, which could fuel a strong upward move toward the 116K+ region.
With sentiment recovering and liquidity returning to the market, BTC appears positioned for a potential weekend breakout.
⚙️ Scenarios to Watch:
Holding above 109K–110K keeps the structure bullish and supports continuation toward 116K+.
Rejection below 109K could lead to a short pullback before another attempt upward.
💬 Summary:
BTC has entered a new uptrend phase, supported by strengthening volume and structure.
If momentum continues, a push beyond 116K during the weekend looks increasingly likely.

WIF/USDT – Accumulation Phase Before Potential RecoveryWIF continues to consolidate after an extended downtrend, currently trading around $0.53 within a well-defined range between $0.45 (support) and $0.85 (resistance).
The structure shows signs of base formation, with steady accumulation and reduced volatility — a setup that often precedes directional movement.
Support zone: $0.45 remains the key demand area where buyers are consistently stepping in.
Resistance zone: The main resistance to watch is near $0.85 — a breakout above could confirm trend reversal.
Volume behavior: Gradually increasing volume hints at potential momentum build-up for an upward move.
If market sentiment improves, WIF could attempt a return toward the $0.75–$0.85 zone, marking a mid-term recovery phase. For now, holding above $0.50 keeps the structure constructive for a bullish continuation.

AIOT/USDT – Consolidation Phase Before Potential BreakAIOT/USDT has formed a solid base around $0.39, showing early signs of accumulation. The pair is currently consolidating within a broad range between $0.39 and $1.12, with recent price action suggesting that momentum may be building for a move higher.
Support zone: $0.39 remains the critical floor level — holding above this area indicates strength.
Mid-range resistance: The $0.72 level will act as the first major test for bulls.
Target zone: A breakout above $0.72 could open the path toward $1.00–$1.12, which aligns with the upper range boundary.
The structure shows early curvature in price movement, hinting at a potential rounding bottom pattern forming. If volume increases, AIOT could begin a gradual recovery phase toward the top of the range.

EURCAD - Buy the Bounce at Confluence!📈EURCAD remains in a steady rising channel on the daily. Price has pulled back into a strong support zone that perfectly aligns with the channel’s lower bound and the base of the recent micro wedge.
🏹As long as this confluence holds, I’ll be looking for trend-following longs from here, aiming first for the recent highs, then the channel top.
⚠️ Disclaimer: This is not financial advice. Always do your own research and manage risk properly.
📊All Strategies Are Good; If Managed Properly!
~Richard Nasr

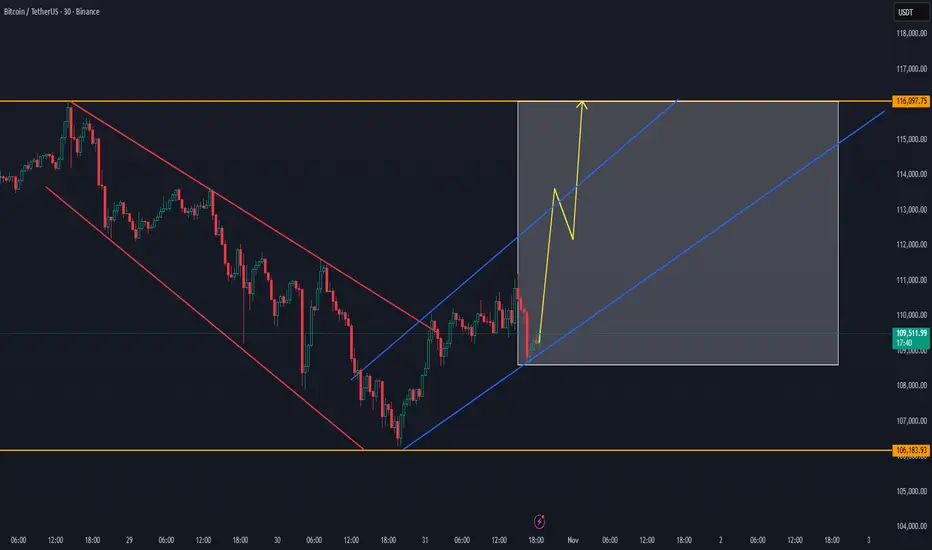
BTC Weekend Setup — Possible Volume Push Toward 116KBTC Weekend Setup — Possible Volume Push Toward 116K 🔥
Coinbase effect + China can play an important role for the breakout of 116K+
Bitcoin has broken out of its descending channel, reclaiming structure and showing early signs of strength.
Momentum is gradually building within the new ascending trend, suggesting that the weekend could bring a volume expansion targeting the 116K zone.
📈 Technical Outlook:
BTC successfully flipped the 106K–108K area into support.
The new uptrend channel is forming higher lows and showing a steady recovery pace.
Volume remains low but is expected to increase into the weekend, often a period of volatility and directional moves.
🎯 Targets:
First resistance: $112K–$113K
Main target zone: $115K–$116K
If volume confirms, a push to 116K could complete this short-term recovery cycle.
⚠️ Risk note:
Failure to hold above $108.5K could slow momentum, bringing price back to retest lower trendline support.
💬 Summary:
BTC is positioned for a potential weekend volume push, with a clear channel structure guiding price toward the 116K resistance zone. Momentum is cautiously bullish — watching for confirmation through weekend trading activity.
Bitcoin Weekend Volume Could Exceed 116K as Smart Money Accumula📊 Market Update
Bitcoin has been building strength since the 106K–107K level, showing signs of a new uptrend. Both the lower time frames and the main trend are currently positive. There’s a strong possibility that BTC will target 112K as the first level, with 116K+ also possible depending on the weekend trading volume.
🔹 Market Structure
The market structure is gradually building, suggesting smart money inflows into BTC over the last 10 hours. We’ll continue tracking this development closely further

BTC GOLDEN CYCLE CAN START ANY MOMENT WITH BREAKOUT 112K AFTER..BTC Breakdown Completed — Potential Rebound Toward $112K 🔁
Bitcoin has successfully tested the 106K zone, completing the expected breakdown move.
Price action now shows early signs of stabilization, suggesting that a recovery toward $112K–$113K could follow in the short term.
📊 Market Outlook:
Support was confirmed near $106K, halting further downside pressure.
Short-term resistance sits around $111.6K–$113.5K, the next likely retracement target.
Momentum remains weak but improving — volume shows early buyer re-entry.
📈 Scenario:
If BTC maintains support above $107K, a technical bounce toward the mid-range near $112K becomes likely before facing renewed resistance.
However, failure to sustain current levels could risk a retest of $106K.
💬 Summary:
BTC completed its breakdown to the 106K area and is now forming a possible relief rebound setup targeting $112K–$113K range.
With the same data, we did expect before the breakdown from 115K to 106K zone

NZDCHF: H1 ATL BreakKey observations across the D1 and H1 timeframes
D1
Pair is in a clean downtrend
Right now, the bearish bar hasn't closed below the low of the bullish bar, which is a small point of concern for selling strength
H1
Price is crossing below a very structural ATL
EMA bands haven't crossed over yet

Bullish? Maybe This Will Change Your Mind About ETHHi guys,
This monthly inverse chart should make things clear to you that the market is about to crash hard!
Everyone is so bullish and Microstrategy just announced another BTC purchase which is a huge RED ALERT for all crypto investors.
Stay safe and let me know what do you guys think about this !

BTC Showing Early Signs of a Possible New UptrendBTC Showing Early Signs of a Possible New Uptrend 🚀
The key is to follow the trend. BTC can return from this point back up 109K
Bitcoin has bounced from the lower range near $107K, holding support after several strong rejections to the downside.
The current structure suggests that momentum could be shifting upward, as the market forms a potential new base for recovery.
There is a good chance that the secure whale trend could use 107K as support for entering on a later time frame to a new cycle
📈 Current outlook:
Support has been confirmed around $107K–$108K, where buyers stepped in with volume.
Short-term resistance remains at $111.6K–$113.3K — a breakout above could confirm a trend reversal.
The price is now trading in the mid-range, building strength for a possible push higher.
📊 Observation:
If BTC manages to reclaim and hold above $113K, the next leg up toward $116K could begin, signaling the start of a new uptrend cycle.
Failure to hold this recovery base would risk another test of the $107K zone.
💬 Summary:
BTC has shown strong recovery signs after defending support — momentum now points toward a possible new uptrend if it sustains above key resistance levels.

BTC Loses Structure — Risk of Falling Below $106KBitcoin has officially lost the low-time-frame structure, confirming the end of the previous uptrend zone.
Momentum has shifted to the downside, with sellers gaining control and price now approaching a critical breakdown level.
📉 Current outlook:
BTC remains under $112K, signaling continuation of short-term weakness.
The end uptrend zone around $109K failed to hold support.
Market structure shows potential continuation below $106K if no reversal occurs soon.
📊 Observation:
Buyers have not defended the local range, and repeated rejections near $116K confirm exhaustion of bullish strength.
The next liquidity pool sits below $106K, which could act as the next target zone in this downtrend sequence.
💬 Summary:
BTC has broken its short-term structure — the chart shows clear downside risk with potential move below $106K if pressure continues.

BTC - Bouncing From the Sweet Spot?⚔️Bitcoin is currently sitting at a high-confluence zone , where the daily support perfectly aligns with the lower bound of the ascending wedge. This intersection makes it a prime area to look for potential bullish reactions.
🏹As long as this support holds, I’ll be looking for long opportunities, expecting BTC to push higher within the wedge structure.
The first target for this bullish move lies around the upper bound of the wedge, which conveniently lines up with the supply zone near $122,000, a key resistance to watch.
📉If the support fails, the structure could shift, but for now, bulls still have the technical edge.
⚠️ Disclaimer: This is not financial advice. Always do your own research and manage risk properly.
📊All Strategies Are Good; If Managed Properly!
~Richard Nasr

Gold /XAUUSD long🎯 Idea Summary:
· Direction: Long
· Instrument: XAUUSD (Spot Gold)
· Primary Timeframe: 4H
· Bias: Bullish (Counter-trend bounce)
📊 Technical Rationale:
· Market Structure: The longer-term trend is still bullish, but price has corrected into a major support zone. Looking for a bounce.
· Key Levels:
· Support: $2315** (Previous Resistance), **$2300 (Major Psychological & Swing Low)
· Resistance: $2340** (Recent Swing High), **$2355 (21 EMA)
· Price Action / Pattern: Price is approaching the $2315 support. Watching for a bullish reversal candle (like a hammer or bullish engulfing) for a confirmation signal.
· Confluence:
· The $2315 level coincides with the 61.8% Fibonacci retracement of the last major up-move.
· RSI is entering oversold territory (<30), suggesting selling pressure may be exhausting.
⚙️ Trade Setup:
· Entry Zone: $2315 - $2320 (On a bullish confirmation candle)
· Stop Loss: $2305 (Just below the key $2300 psychological level and the Fib level)
· Take Profit Targets:
· TP1: $2340 (First resistance, take 50% off)
· TP2: $2350 (21 EMA & next resistance)
· Risk-Reward Ratio: ~1:2.5
💡 Narrative / Fundamental Context:
This is a mean-reversion play within a bull market.The confluence of a major Fibonacci level, prior support, and oversold RSI creates a high-probability zone for a technical bounce. A break below $2300 would signal a much deeper correction is likely.
Disclaimer: This is my personal analysis and not financial advice. Trading commodities like gold carries a high level of risk. Always do your own research (DYOR) and manage your risk appropriately.

BTC Still in Breakdown ZoneBTC Still in Breakdown Zone ⚠️
Bitcoin remains inside the breakdown structure, consolidating under pressure after failing to reclaim the upper range near $116K.
The current setup continues to show bearish volume behavior, suggesting that the market is still in a controlled downtrend phase.
📉 Current outlook:
Breakdown zone spans $116K – $110K.
Price continues to trade mid-range around $113K, with limited bullish momentum.
The breakdown volume indicates ongoing distribution — sellers remain active.
📊 Observation:
BTC is holding slightly above $112.5K, but without strong buying confirmation.
If this consolidation breaks lower, the next liquidity target sits around $110K, marking the bottom of the breakdown zone.
💬 Summary:
BTC is still in the breakdown phase, with selling pressure dominating short-term structure.
Until price reclaims $116K with volume, risk remains tilted toward the $110K region.

EUR/USD - Sell Trade setup🔥 EUR/USD 1H Forecast – Bears Back in Control! 🔥
Alright, traders — buckle up 😎
🧠 Market Structure
Price just tapped into that 1H supply zone around 1.16500, rejected hard, and is now breaking short-term structure to the downside. The clean liquidity sweep above highs flipped into bearish momentum — classic distribution setup 👇
You can clearly see a lower-high forming under the trendline, confirming HTF bearish order flow still dominates.
💣 Technical Breakdown
🧱 Supply Zone (Entry Zone): 1.1645 – 1.1660
🎯 Target Zone (Demand): 1.1550 – 1.1560
📉 Internal Structure: Break of short-term demand + retest = continuation leg
🧭 Trendline: Dynamic resistance still holding from previous swing highs
⚡ Momentum: Strong bearish candles + clean imbalance below
🩸 Game Plan
If price retests the minor 1.1630–1.1640 pocket, that’s a potential re-entry short zone for continuation toward the daily demand sitting near 1.1550.
Stops ideally above the 1.1660 wick, aiming for a 1 : 4 R-R toward the next liquidity pool.
🧩 Bias
🔻 Bearish — HTF confirms downside control, with lower-timeframe structure following through.
🧠 Quick Take
The bulls had their snack stop 🍪 at 1.1650 — now it’s time for bears to eat. If we get a clean retest, expect momentum to drive EUR/USD toward that 1.1550 low sweep before any potential bounce.

Bitcoin lost its low time frame — red day pressure aheadBitcoin has lost the low time frame structure around the $114.6K – $114.8K zone, signaling a possible shift in short-term momentum.
The break below this area indicates weakness, and BTC is now testing the mid-range levels while showing signs of slowing volume.
📉 Short-term view:
Momentum has turned bearish after rejection from $115.8K.
Next support zone sits around $108K – $109K, where buyers may try to step in.
If this level fails to hold, BTC could revisit $103K support — the key demand area from the previous range.
📊 Technical observation:
BTC’s structure shows a completed short-term top followed by a lower high formation.
This setup often confirms a local downtrend and can lead to several red candles before a new base forms.
💬 Summary:
Bitcoin lost its low time frame momentum, and we could be entering a red session.
We’ll monitor how price reacts near the $108K support zone to evaluate if buyers can regain control or if a deeper correction begins.
We follow the data, at this moment the marketview seems to be red, we will follow if this continues in the coming hours.
