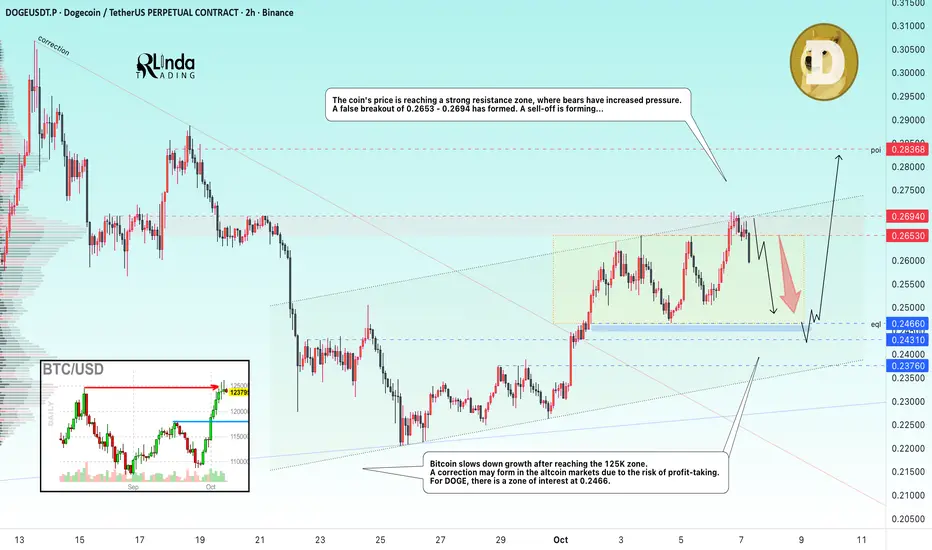
DOGEUSDT → Correction to 0.246. The hunt for liquidity BINANCE:DOGEUSDT.P attempted to realize its potential after breaking out of the downward resistance. After updating the local maximum to 0.27, the price entered a phase of correction and consolidation...
Bitcoin slows down its growth after reaching the 125K zone. A correction may form in the altcoin markets due to the risk of profit-taking. For DOGE, there is a zone of interest at 0.2466
The price of DOGE has reached a strong resistance zone, where bears have increased pressure. A false breakout of 0.2653 - 0.2694 has formed. A sell-off is forming...
Resistance levels: 0.2653, 0.2694
Support levels: 0.2466, 0.2431, 0.2376
Against the backdrop of market correction, a downward rally associated with panic selling is forming. The support zone that is of interest to the market is 0.2466, and this zone is quite capable of stopping the decline. A false breakdown and holding the price above 0.246 - 0.243 may renew interest in growth.
Best regards, R. Linda!
Trend
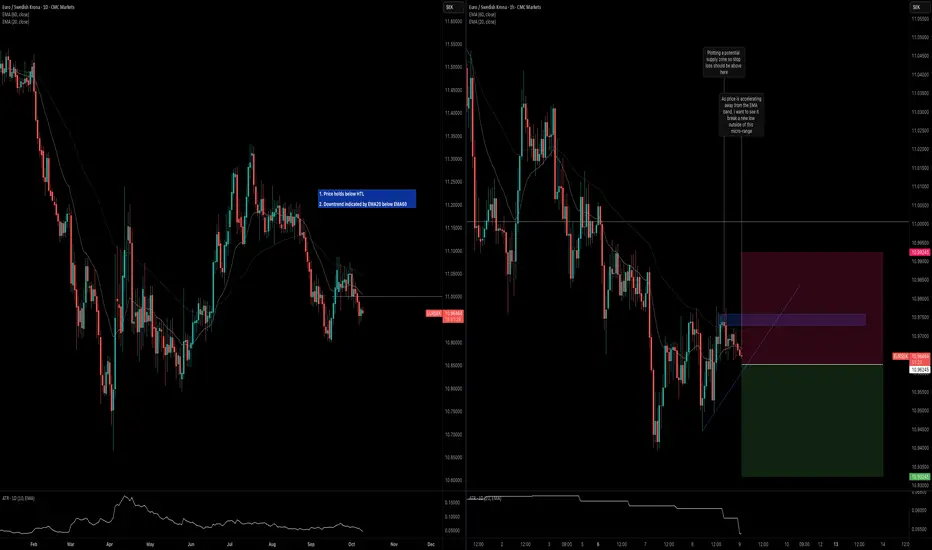
EURSEK: Trend ContinuationKey observations on the daily and H1 timeframes below.
Daily Timeframe:
Price is holding below HTL
Downtrend is indicated by EMA20 below EMA60
H1 Timeframe:
Price is accelerating away from EMA band
Sell stop set to enter when price breaks out of the micro-range
COAI DID ONE OF THE BEST INCREASES - NEXT ONE AVL:USDTChainOpera AI (AI/USDT) — From Our First Scan to Explosive Gains 🚀
We first scanned ChainOpera AI at just $0.38, and since then it has delivered an incredible surge, reaching new highs above $4.00+ — a massive performance move backed by strong momentum and trend continuation.
📈 Our First Scan: $0.38
💥 Current Levels: $4.32
🔥 Gain: +1000%+
The same technical setup and market structure now appear to be forming on AVL/USDT, showing early signs of accumulation and breakout potential similar to what ChainOpera AI showed before its explosive run.

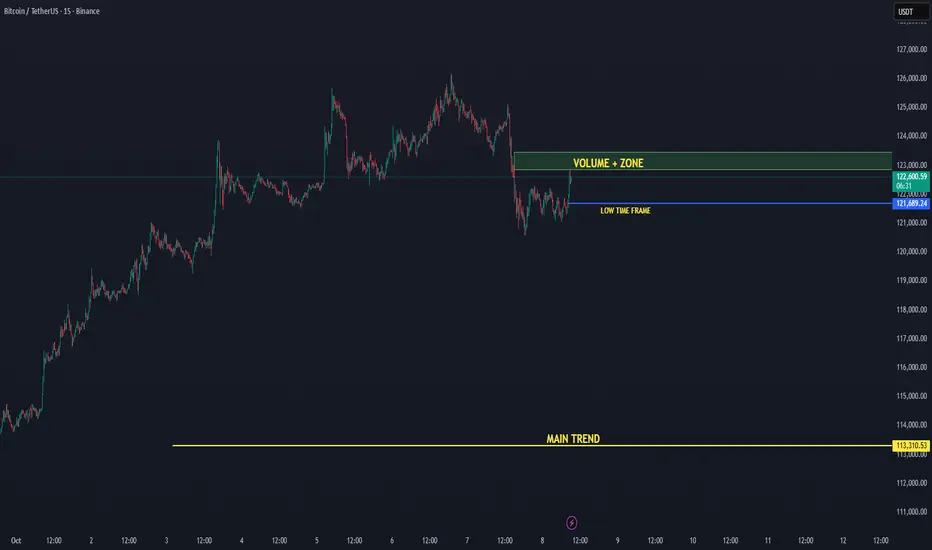
BTC/USDT — Low Time Frame Recovered, Eyes on Volume 08-10-2025Bitcoin has reclaimed its low time frame level near $121.6K, signaling renewed short-term strength. Price is now pushing upward toward the +Volume Zone, an area where increased buying activity could trigger a breakout continuation.
📈 Low Time Frame Reclaimed: BTC has stabilized above the local structure, confirming short-term bullish momentum.
🔊 Volume Zone Target: The next resistance sits around $123K, where increased trading activity could accelerate a move higher.
🟢 Main Trend Active: The primary uptrend remains strong as long as BTC holds above the $113K main trend support.
Technical Levels:
🟢 Main Trend Support: $113K
🟡 Low Time Frame Support: $121.6K
🔊 Volume Zone Resistance: $123K
🎯 Next Target: $125–$126K
Outlook:
Bitcoin is showing healthy recovery momentum, reclaiming short-term structure and heading into the Volume Zone. If it sustains above $121.6K and breaks $123K with volume confirmation, a continuation toward $125K+ becomes likely.
📊 Bias: Bullish continuation
📈 Focus: Volume reaction at $123K
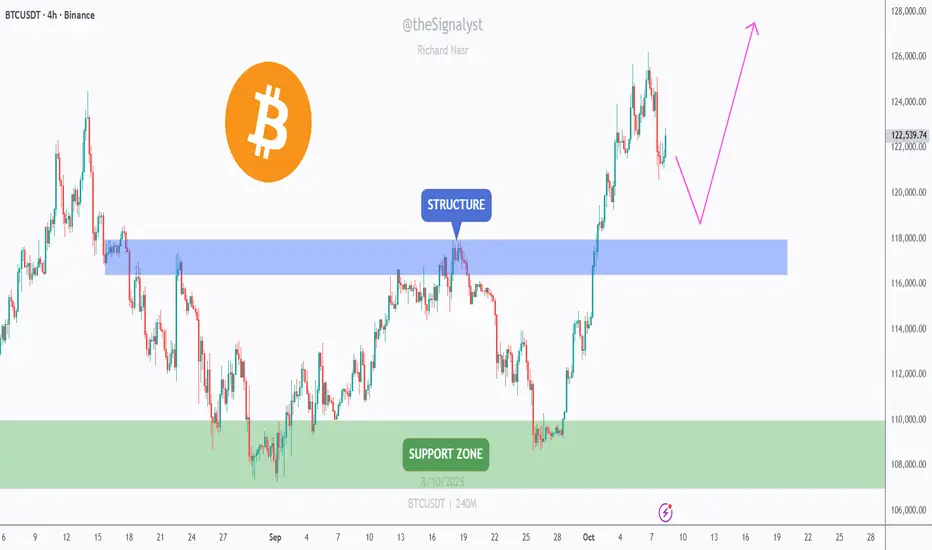
BTC – Eyeing a Retest of the $118K Structure!CRYPTOCAP:BTC broke above the $117K–$119K structure (blue zone) with strong momentum.
I’m now watching for a pullback to this area to form a higher low and resume the uptrend.
As long as price holds above $117K–$119K, I’ll look for trend-following longs toward $125K–$128K, then the $130K handle.
If the blue zone fails, the next support sits at $106K–$110K (green zone), where bulls may regroup.
⚠️ Disclaimer: This is not financial advice. Always do your own research and manage risk properly.
📚 Stick to your trading plan regarding entries, risk, and management.
Good luck! 🍀
All Strategies Are Good; If Managed Properly!
~Richard Nasr
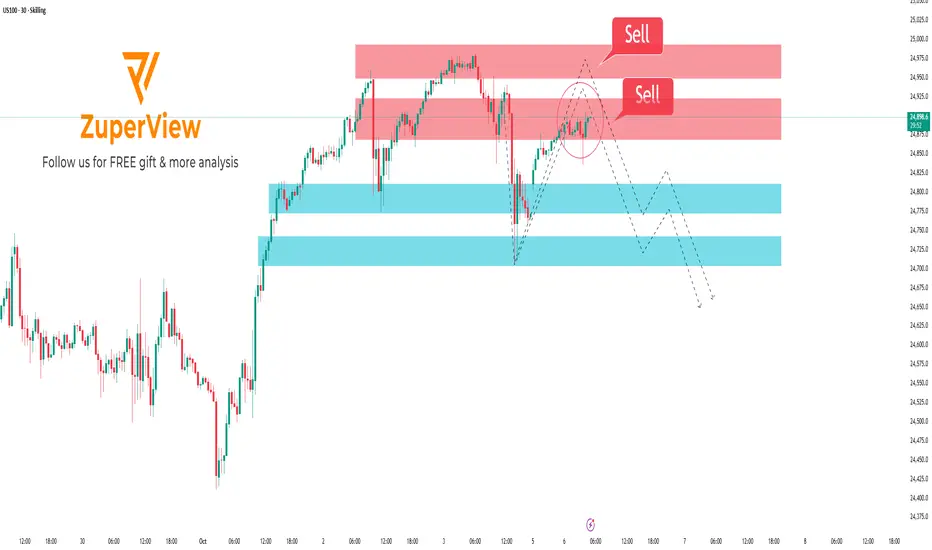
US100: Imbalance rejection – Bears back in control
🧠 SKILLING:US100 Technical Analysis
🧱 Resistance Zone (Imbalance)
• The 24,900 – 24,950 area acts as a strong resistance, overlapping with a supply/imbalance zone.
• Price has reacted bearish from this level, showing clear selling pressure.
• This is a potential area to look for short (Sell) setups.
________________________________________
📉 Current Market Structure
• After a sharp bullish retracement, price formed a rising channel 🔵.
• However, inside the highlighted circle, price has broken down from the channel — indicating weakening bullish momentum.
• This breakdown supports a short bias in the short term.
________________________________________
💡 Trade Plan
• Bias: Look for Sell setups near the resistance zone.
• Confirmation: Wait for a small pullback and a new lower high before entering short.
• Target (TP): Toward the Support zone 24,740 – 24,868 (previous bottom).
• Stop Loss (SL): Above resistance at around 24,950 – 25,000.
________________________________________
🟢 Support Zone
• The 24,740 – 24,780 area is the previous bottom, where price previously bounced strongly.
• This level might attract profit-taking from sellers or temporary buying interest.
________________________________________
⚠️ Risk Notes
• If price closes above 25,000 (H1 candle), the bearish scenario becomes invalid.
• Manage position sizing carefully and wait for clear confirmation before entering a trade.
________________________________________
🧭 Summary
• Short-term Trend: 🔻 Bearish correction
• Mid-term Trend: 🔄 Sideways – waiting for a breakout of either 24,740 or 25,000.
• Current Opportunity: Sell from resistance → Target support zone
Please like and comment below to support our traders. Your reactions will motivate us to do more analysis in the future 🙏✨
Harry Andrew @ ZuperView

EURAUD: DowntrendKey Observations
Daily Timeframe
EMA20 is slightly lower than EMA60 and price is below both to indicate weak downtrend
However, price is also holding below a daily HTL so buying pressure also remains weak or non-existent
H1 Timeframe
Price is exiting away from the EMA band and below both EMA20 and EMA60 to indicate high probability of downside momentum
If price crosses below the ATL, that's a further indication of downside momentum

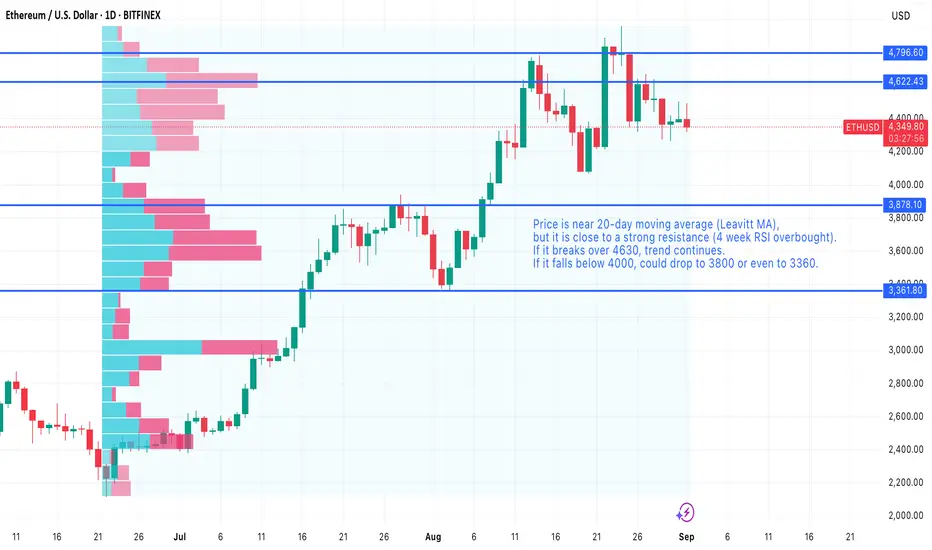
Break or Bust — ETH betwen Support vs. Overbought 4‑WeekETH sitting at the 20‑day Leavitt MA while hitting strong resistance — overbought of 4‑week RSI.
If price breaks and closes above $4,630, trend continuation is likely.
If price breaks below $4,000, expect a drop toward $3,800 and possibly $3,360.
Technical notes:
Use the 20‑day Leavitt MA as your short‑term trend anchor.
Watch for a confirmed daily close above $4,630 to signal continuation (entry on retest or momentum breakout).
A daily close below $4,000 invalidates the bullish case; targets: $3,800 then $3,360 (scale stops and size accordingly).
Manage risk with stops outside breakout levels and position sizing for potential volatility.
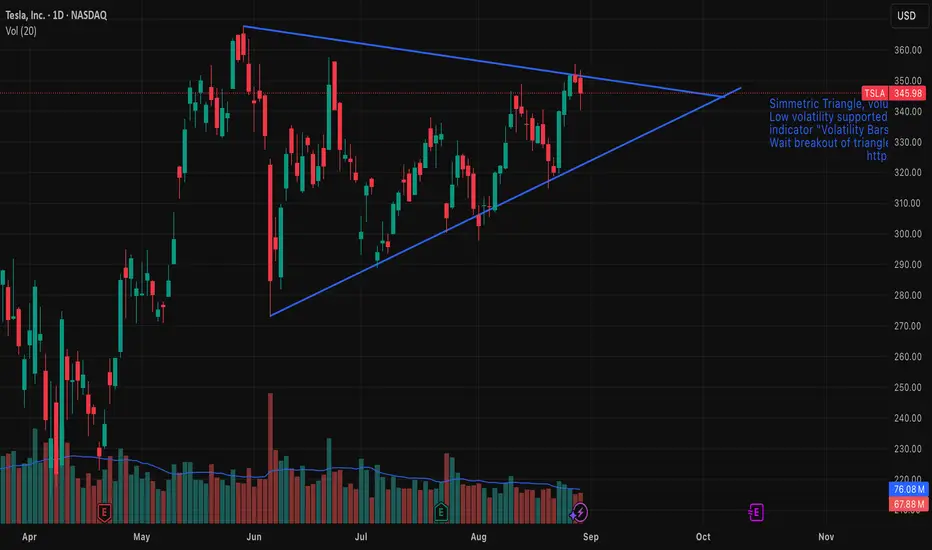
Tesla (TSLA) — Symmetrical Triangle Breakout IdeaSummary
Pattern: Symmetrical triangle on daily chart.
Expected timeframe for breakout: Within 1–2 weeks.
Targets: $367 on an upside breakout; $273 on a downside breakout.
Risk management: Use a stop-loss just outside the triangle after breakout confirmation; position size per your risk rules.
Setup & Rationale
A well-defined symmetrical triangle has formed on TSLA’s price action, characterized by converging trendlines connecting lower highs and higher lows. Volume has contracted inside the pattern, consistent with consolidation. Symmetrical triangles are neutral continuation/reversal patterns; the breakout direction provides the trading signal.
Key technical points:
Price is approaching the apex, increasing the likelihood of a decisive breakout in the next 1–2 weeks.
Volume decline during the consolidation and a volume spike on breakout would confirm conviction.
The breakout should be taken after a daily close beyond the upper or lower trendline (or after a retest), not merely intraday probes.
Entry Criteria
Upside trade: Enter long on a daily close above the upper trendline (or on a confirmed retest).
Downside trade: Enter short on a daily close below the lower trendline (or on a confirmed retest).
Targets & Measurement
Measure the pattern height (vertical distance between the initial high and low of the triangle) and project it from the breakout point.
Upside target (projected): $367.
Downside target (projected): $273.
Adjust targets proportionally if you use a measured move from the actual breakout point rather than the pattern’s maximum height.
Stops & Risk Management
Place stop-loss slightly outside the opposite trendline or beyond a recent swing point to avoid false breakouts.
Preferred approach: fixed-risk percent per trade (e.g., 1–2% of portfolio) and scale position size accordingly.
Consider tightening stops to breakeven after price clears ~50% of the distance to the target.
Confirmation: daily close beyond trendline plus above-average volume (up or down depending on direction).
Symmetrical triangles are neutral; false breakouts occur. Wait for confirmation.
News, earnings, or market-wide events can invalidate technical setups quickly—monitor catalysts.
Adjust targets/stops if volatility expands or if the breakout lacks volume confirmation.
BNBUSDT — Bullish consolidation ahead of resumed uptrendThe bullish consolidation in BNBUSDT that I’ve been watching has begun to resolve in the market’s favor. Price action is coiling after two consecutive white spinning-top candles, a pattern that signals indecision but also a readiness to resume the prior trend when confirmed. The move has occurred on heavier volume concentrated in the current price area, and the pair sits roughly halfway between two key Fibonacci retracement levels — a location that commonly precedes a corrective bounce rather than a full trend reversal. Trend Strength sits just above zero, suggesting a fragile bullish bias rather than conviction.
Viewed on a slightly wider timeframe, BNBUSDT is grinding inside a shallow range that resembles a consolidation brick; the path of least resistance still leans toward the upside provided the short-term structure holds. Conventionally, the presence of consecutive indecisive candles on increased volume near mid-Fibonacci territory combined with a mildly positive momentum indicator favors a corrective rebound rather than an extended sell-off.
Key short-term levels to monitor on the way up are the 38.2% Fibonacci retracement as the likeliest target for the initial bounce, with a secondary cap at the 50% retracement if buyers show enough follow-through. Beyond those, a return toward prior highs remains plausible, though that area will present a zone of elevated resistance and will need clear volume-backed breakout confirmation to be trusted.
RSI and other momentum readings are consistent with a measured recovery rather than an impulsive surge, so expect the move to unfold over the coming 2–3 weeks. If the market fails to sustain above the 38.2% level and momentum turns down, the alternate scenario would be a continuation of the consolidation or a deeper retracement toward the lower Fibonacci boundary.
Short summary:
Setup : consolidation with two white spinning-top candles, heavier volume locally, price midway between two Fibonacci levels, Trend Strength slightly > 0.
Base case : corrective bounce to 38.2% (primary) — up to 50% (maximum) — then continuation higher toward prior highs (resistance zone).
Timeframe : ~2–3 weeks.

Gold - 4H Forecast ☀️ GOLD – 4H Forecast ☀️
Alright gold gang, let’s talk business — XAU/USD is setting up for something clean 👇
🧠 Bias :
Still bullish overall, but we’re chilling in premium territory, and this structure screams “pullback incoming.” Expect a retrace before the next rocket launch 🚀.
🧩 Technical Breakdown:
Price just printed a Buy-Side Liquidity (BSL) grab up top — textbook liquidity sweep before a potential correction.
We’ve got a strong impulsive leg pushing off a 4H + Daily demand confluence around $3,850–$3,880.
The 71% fib retracement zone aligns beautifully with that 4H demand, creating a prime reload area if price dips.
The volume profile gap (POI) also hints at untested liquidity sitting below current highs.
🎯 Trade Idea:
Entry Zone: $3,880–$3,860 (4H & Daily demand overlap)
Target 1: $3,970 (current high retest)
Target 2: $4,010+ (continuation into new impulse)
Invalidation: Below $3,830 (break of structure + demand failure)
⚙️ Risk Management:
Keep risk tight — 1%–1.5% max. If we get a reaction at the 71% level, partials at $3,950 are smart to secure profits before the next leg.
💬 Summary :
Gold just ran buy-side liquidity and looks ready to dip into discount before ripping higher again. If we get a clean 4H or 1H confirmation in the demand, expect another bullish leg to unfold.

EUR/USD - 4H Forecast (Full Breakdown Linked)🔥 EUR/USD – 4H Forecast 🔥
Alright traders, here’s the 4H play for the Fiber 👇
🧠 Bias:
Short-term bearish, baby. Price just printed a Break of Structure (BOS) after a clean shift in momentum from the upside. The bulls are losing steam, and sellers are creeping back into the driver’s seat.
🧩 Technical Breakdown:
Price rejected beautifully from a 4H supply zone around 1.1750–1.1770, confirming bearish intent.
We’ve got a solid BOS and shift, setting the tone for a potential continuation leg down.
A minor pullback into the 4H zone could act as the sniper’s entry area.
Below sits a juicy imbalance and SSL (sell-side liquidity) near 1.1530–1.1560, waiting to get cleared.
🎯 Trade Idea:
Entry Zone: 1.1700–1.1740 (4H supply retest)
Target 1: 1.1580 (mid-range demand)
Target 2: 1.1440 (major liquidity pocket)
Invalidation: Above 1.1780 (if price reclaims the 4H supply, bias flips)
⚙️ Risk Management:
Stick to your plan — 1–2% risk max. Wait for confirmation candles or lower-TF rejection before diving in. No FOMO entries.
💬 Summary :
EUR/USD looks primed for a bearish continuation unless the bulls pull off a miracle reclaim. Eyes on that 4H zone — rejection there could kickstart the next drop.

NZDJPY – Retesting Upper Channel: Looking for Shorts!NZDJPY remains inside a falling channel on the 4H.
Price just spiked back into the upper trendline / supply (87.40–87.80), where sellers have reacted before.
As long as this red zone holds, I’ll look for lower-high + break-of-structure sell setups toward 86.30, then the 85.40–85.00 channel low.
A clean 4H close above ~88.00 would invalidate the idea and open room for 88.70–89.00.
⚠️ Disclaimer: This is not financial advice. Always do your own research and manage risk properly.
📚 Stick to your trading plan regarding entries, risk, and management.
Good luck! 🍀
All Strategies Are Good; If Managed Properly!
~Richard Nasr

NEAR – Post-Breakout Impulse in Play!NEAR has already broken out of its accumulation phase, confirming the end of its consolidation and the start of a fresh impulsive leg within the macro falling channel.
As long as price holds above the $2.80–$3.00 breakout zone, the bullish structure remains intact, with the next targets at $4.20–$4.80 and potentially $6.00–$7.00 — the upper boundary of the channel and a key confluence zone.
If price slips back below $2.80, it would signal a failed breakout and a possible retest of the previous lows.
⚠️ Disclaimer: This is not financial advice. Always do your own research and manage risk properly.
📚 Stick to your trading plan regarding entries, risk, and management.
Good luck! 🍀
All Strategies Are Good; If Managed Properly!
~Richard Nasr

AUDUSD: Trend ContinuationKey Observations
Daily Timeframe:
EMA20 remains above EMA60 > uptrend indication
Price holds above HTL > no strong downside momentum
H1 Timeframe:
Price crossed above DTL and holds
Price pulled back to DTL and held above it
Price also exited EMA band with momentum strength

EURSEK: Trend ContinuationKey Observations
Daily Timeframe:
Price breaks HTL and shows downtrend confluence with EMAs
EMA20 is also expanding away from EMA60 to indicate the downtrend continuation
H1 Timeframe:
Swinging this downtrend as intraday upside is exhausted
Price is also showing confluence with EMA20 and EMA60

USDCAD: H1 ConfluenceKey Observations
Daily Timeframe:
On Friday's close last week, price held above the daily level
This week's open indicate price is likely held supported
H1 Timeframe:
There's confluence on the H1 timeframe where price is crossing above the DTL
Price is also moving away from the EMA band, which indicates momentum could be picking up here

US100: Strong resistance sell setup on the 30-minute chart
📈 SKILLING:US100 — Technical Analysis: Sell Setup Near Strong Resistance
🔍 Technical Analysis:
• Currently, US100 price is approaching a significant resistance zone (highlighted in red). This area has acted as a strong ceiling in recent sessions, where sellers tend to emerge.
• The price has rallied back after a sharp decline but is showing signs of slowing momentum as it nears this resistance. This often leads to a rejection rather than a clean breakout, especially on a 30-minute timeframe.
• Below, the light blue zones represent key support levels, which could serve as realistic targets if sellers regain control. These zones are important areas where buyers previously stepped in, creating potential bounce points.
• The drawn dashed lines illustrate a possible price path: a test of the resistance level, failure to break higher, followed by a pullback and continuation of the downward trend.
• For confirmation of the sell setup, traders should look for reversal candlestick patterns such as rejection wicks (long upper shadows), bearish engulfing candles, or pin bars at the resistance zone. These signals help validate that sellers are gaining dominance.
• Volume and momentum indicators should also be monitored for divergence or weakening bullish pressure near resistance to strengthen the case for a sell.
📊 Trade Considerations:
• Entering a sell position should be done only after clear confirmation of price rejection at resistance.
• Setting a stop loss slightly above the resistance zone helps manage risk in case of a false breakout.
• Targets can be placed near the support zones (light blue areas), with partial profit-taking to lock gains while allowing some position to run if price reacts there.
📌 Summary:
The technical structure of US100 on the 30-minute chart suggests a high probability of price reversal from the strong resistance area. A cautious sell setup is favored, waiting for confirming price action signals to reduce risk. Proper risk management is essential to navigate potential volatility near this key level.
Please like and comment below to support our traders. Your reactions will motivate us to do more analysis in the future 🙏✨
Harry Andrew @ ZuperView
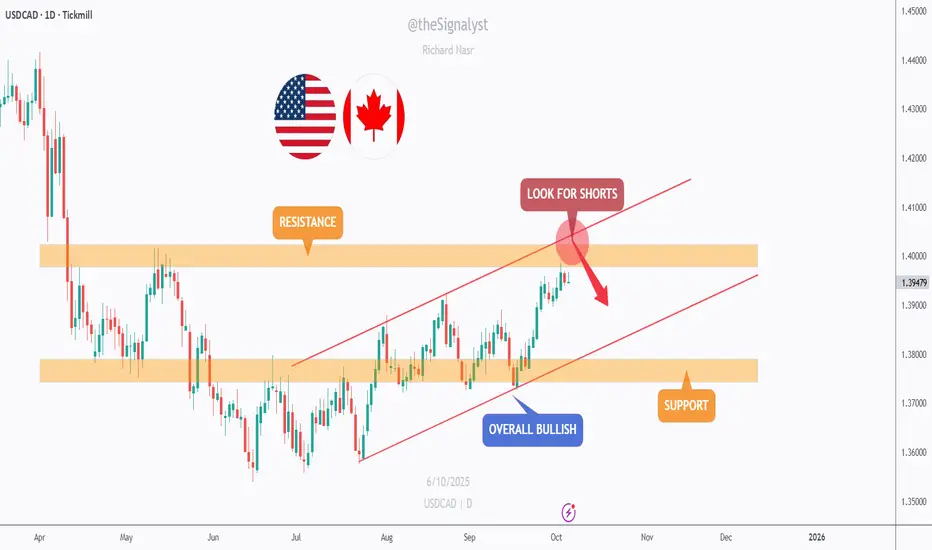
USDCAD – Testing a Major Resistance ZoneUSDCAD remains overall bullish, trading within a rising channel.
However, price is now approaching a key intersection between the upper trendline and a major resistance zone around 1.4000.
As price nears this confluence area, we’ll be looking for potential short opportunities, anticipating a possible rejection before any continuation higher.
The next support zone sits near 1.3750, where buyers might step back in if a pullback occurs.
⚠️ Disclaimer: This is not financial advice. Always do your own research and manage risk properly.
📚 Stick to your trading plan regarding entries, risk, and management.
Good luck! 🍀
All Strategies Are Good; If Managed Properly!
~Richard Nasr
AUDJPY — Buy the Retest?AUDJPY remains overall bullish inside a rising channel. Price is hovering above a 96.0–96.5 support zone, which previously acted as resistance and now aligns with the channel’s lower boundary, a solid confluence area.
🔑 Key levels
Support: 96.0–96.5 (zone to watch for bullish rejection)
Resistance: 98.5 then 100.0 (round number / channel upper band)
📊 Scenarios
Bullish 📈 If price retests 96.0–96.5 and prints confirmation (higher low / bullish candle), I’ll look for longs toward 98.5 → 100.0.
Bearish 📉 A daily close below 96.0 would invalidate the setup and open room toward the next liquidity pocket near the channel low.
What’s your plan here => wait for the retest into 96s, or trade the continuation if momentum kicks in first? 🤔
⚠️ Disclaimer: This is not financial advice. Always do your own research and manage risk properly.
📚 Stick to your trading plan regarding entries, risk, and management.
Good luck! 🍀
All Strategies Are Good; If Managed Properly!
~Richard Nasr

USDJPY - Range Floor + Trend Support = ConfluenceUSDJPY remains overall bullish within a rising channel, while price has been ranging between a lower demand band and the upper supply.
We’re now dipping into the 146.0–146.7 support area, which aligns with the channel’s lower boundary — a classic confluence zone to hunt for longs.
🔑 Key levels
Support: 146.0–146.7 (range floor + channel support)
Resistance: 149.8–151.0 (range top / supply)
📊 Scenarios
Bullish 📈 Look for a higher-low / bullish candle from 146s → path toward 149.8–151.0.
Bearish 📉 Daily close below 146.0 would invalidate the setup and open a deeper pullback before buyers try again.
Do you buy the retest into the 146s, or wait for momentum to kick in first? 🤔
⚠️ Disclaimer: This is not financial advice. Always do your own research and manage risk properly.
📚 Stick to your trading plan regarding entries, risk, and management.
Good luck! 🍀
All Strategies Are Good; If Managed Properly!
~Richard Nasr

AUDUSD: Momentum Picking UpKey observations
Daily Timeframe:
Price holds above EMA20 and bullish bar indicates potential upside momentum
EMA20 remains above EMA60 to technically indicate uptrend
H1 Timeframe:
Price cross above DTL to indicate upside momentum
Price also crossing above EMA20 to indicate uptrend resumption

AUDCAD: DTL BreakoutDaily Timeframe:
Bullish bar on market open indicates strength
Bullish bar also covering dojis on two previous days
H1 Timeframe:
Price crosses above DTL as first indication of momentum
Price is above crossing above EMA20
EMA20 is also expanding away from EMA60
Price crossing back above EMA60 indicates bearish sentiment is unlikely to hold
