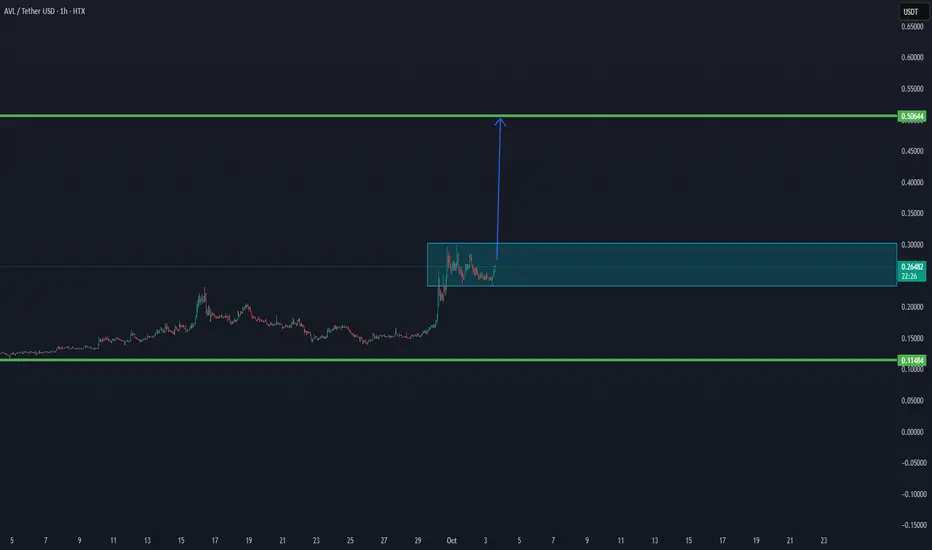
AVL/USDT IS ABLE TO BREAK IN THE COMING TIME TO $0,50✅ AVL has confirmed above both the low time frame and the main trend, showing strong bullish structure.
📈 With this setup, the chart is signaling a potential continuation move toward the $0.50 zone – the next major resistance.
Current support zone is holding well, which adds strength to the bullish case.
As long as AVL stays above the trend confirmations, momentum remains in favor of a breakout.
⚡ Outlook: Structure is positive, and upside potential toward $0.50 is active.
Trend
BTC - Weekly Breakout!📈 BTC has already broken out of its correction phase and is holding strong above $118k.
As long as $118k holds, the next targets sit between $126k–$140k.
Only a drop below $114k would delay the bullish outlook.
Trend remains strongly bullish after the breakout.
⚠️ Disclaimer: Not financial advice. Manage risk properly.
All Strategies Are Good; If Managed Properly!
~Richard Nasr.

NZDUSD: Sell Stop in Planned DowntrendThis is not an active entry but a planned sell stop entry.
Daily Timeframe:
Price crossed above HTL but quickly formed a doji to indicate weakness
EMA20 is below EMA60 and price is below EMA20 so there's an overall weak downtrend
H1 Timeframe:
Strong ATL is in the process of weakening as price recently failed to make a higher high
When price crossed below ATL, EMA20 should show confluence by crossing below EMA60 and the EMA band should continue expanding
If price makes a clean break lower, there's strong indication that there will be confluence with the daily downtrend

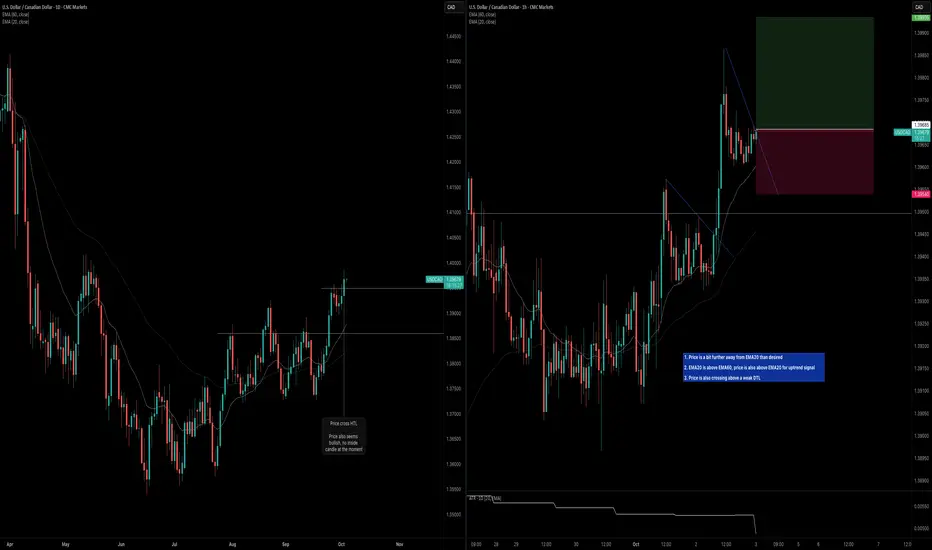
USDCAD: Uptrend ContinuationDaily Timeframe:
Price crosses above HTL and is holding
No inside bar formed yet so unlikely to see loss of momentum over the next day
H1 Timeframe:
Not idea that price is a bit further away from EMA20
Uptrend is indicated by EMA20 being above EMA60 and price being above EMA20
The DTL is also not a strong plot so reducing size
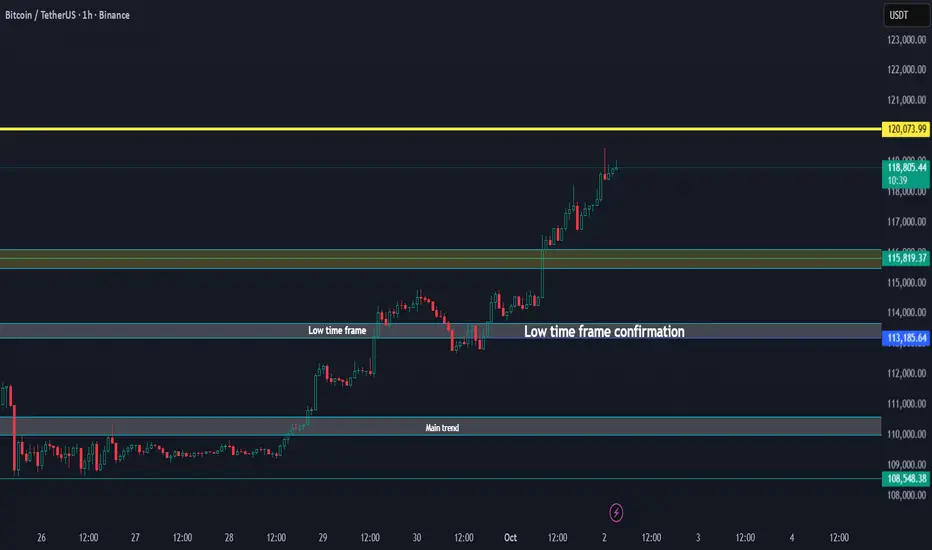
BTC Above All Key Levels, Trend Points Higher Update 02-10-2025🚀 Bitcoin / USDT Update
Bitcoin has broken above all key levels, showing strong momentum.
Main trend has been secured.
Low time frame is confirmed and holding.
Price is currently pushing into new zones with upside pressure.
If this strength continues, BTC could extend toward the 120K region, and a new trend could unlock further upside potential beyond that.
✅ As long as Bitcoin stays above the confirmation zone (~113K support), momentum remains bullish.
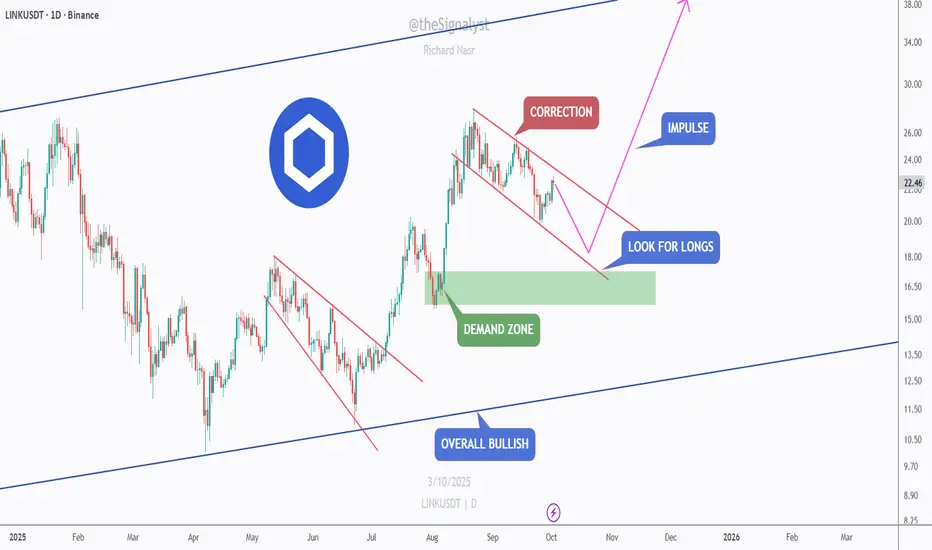
LINK — Bullish Structure, Corrective Dip into Demand!LINK remains overall bullish on the higher timeframe. Price is pulling back inside a descending channel (correction) after August’s impulse and is approaching a daily demand zone around $17–$18.5.
Scenarios:
Bullish 📈 Hold $17–$18.5 and/or break & close above $22.5–$23.5 → momentum toward $26, then $30+ if trend accelerates.
Bearish 📉 Daily close below $17 would weaken the structure and risk a deeper retrace before bulls try again.
Plan:
Look for confirmation at demand (higher low / bullish candle) or trade the break–retest above the channel for momentum entry.
⚠️ Disclaimer: This is not financial advice. Always do your own research and manage risk properly.
📚 Stick to your trading plan regarding entries, risk, and management.
Good luck! 🍀
All Strategies Are Good; If Managed Properly!
~Richard Nasr
GBPAUD: Second AttemptExperienced a bit of unwanted volatility earlier this morning, but I do think there's still quite a bit of downside pressure.
On the daily timeframe, price still remains below HTL. On the H1 timeframe, price appears to be ranging, but is painting larger bearish bars.
I think there is an opportunity to scale in if price crosses below EMA20 and the EMA20/60 band continues to expand.

GBPAUD: Price Holding Below Daily HTLDaily Timeframe:
Price initially crossed below daily HTL on September 11th, but failed to hold below it as price reversed for the following days
Price crossed below daily HTL again on September 30th, but closes below significantly
Price attempted to trade above HTL, but failed to close above it accordingly
H1 Timeframe:
There's confluence here as price crosses below ATL
Price is also below EMA20 and the EMA band is beginning to widen

AKE/USDT ( AKEDO) CAN SHOW WHALE DCA INCREASE TO $0,005 TARGET📊 Cycle Update – AKEDO/USDT
Current price is consolidating in the DCA Whales Zone (0.00137 – 0.00144), showing that accumulation is likely taking place.
This level acts as a cycle base, where strong hands are active in building positions.
As long as price holds above this zone, the cycle remains intact with upside potential.
The next major target sits around $0.005, which is over 3x from current levels and aligns with the open space on the chart.
✅ Outlook: With whale DCA activity confirmed, this cycle has the potential to expand upward, and reclaiming momentum above accumulation could trigger the next leg to $0.005.

AKE ON WAY TO MAIN TREND - UPDATE 30-10-2025📊 AKEDO/USDT Update
The coin is now trading above the low time frame zone (0.00129 – 0.00133), showing strength after the recent recovery.
If momentum continues, the next key area is the main trend zone (0.00170 – 0.00190).
Once price enters and holds this main trend, there’s open space above with potential continuation toward 0.00259.
As long as AKEDO stays above the low time frame, bias remains positive for a push toward the main trend.
✅ Outlook: Strong chance of continuation if main trend is reclaimed.

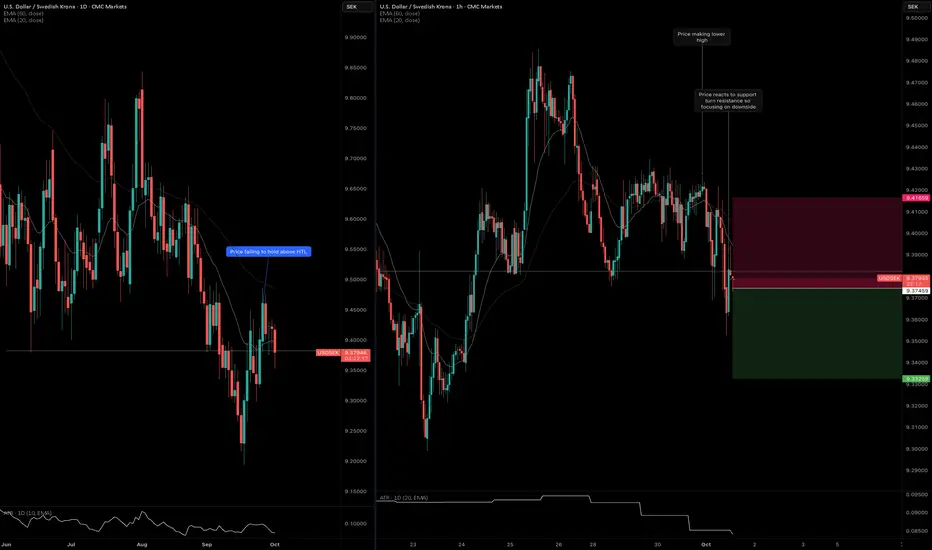
USDSEK: Price Crosses Below HTL AgainUSDSEK traded below the daily HTL, but there's weakness after price crossed back above.
On the other hand, the H1 timeframe is showing weakness. Price is failing to make higher high so I'm betting on downside momentum to pick up.
Reduced position size since we are nearing New York rollover.
BARD/USDT THE RETURN TO $1.50From now the $0,90 zone there is good chance in the coming time that BARD can return to $1.50

LIGHT VIEW HOW THE BREAKS CAN HAPPEN FROM BELOW $0,85 TO UP $2Licht is currently trading below $0.85. Based on trend data, once a low is confirmed, there is an 85% chance of a breakout. This analysis is supported by similar patterns observed in MYX and other coins that followed the same trajectory, as well as insights from the wallet DCA perspective.
The coin at this moment is below $0,85

ETH – Bulls Eyeing the Next Push!ETH has been showing strength after reclaiming the $4,000 psychological level and breaking back above structure. Price is now trading inside a rising channel, keeping the overall outlook bullish in the short term.
At the moment, ETH is hovering around the $4,040–$4,000 support area. This zone aligns with the lower red trendline of the channel, creating a strong confluence for potential bullish continuation.
As long as ETH holds above this zone, I’ll be looking for long opportunities with the next impulse higher in mind. If broken downward, however, we could see a deeper correction before the bulls step back in.
The key level to watch remains $4,000 . Stay above = bullish bias intact. Break below = caution for further downside.
Do you think ETH will maintain its momentum above $4,000, or will the bears step in for another retest lower? 🤔
⚠️ Disclaimer: This is not financial advice. Always do your own research and manage risk properly.
📚 Stick to your trading plan regarding entries, risk, and management.
Good luck! 🍀
All Strategies Are Good; If Managed Properly!
~Richard Nasr

FINALLY LIGHT CONFIRMS THE LOW TIME FRAME - BREAK UP $1.40Based on trend analysis, the chart shows a confirmed low-timeframe activation. This setup suggests that ALPINE could, with time, break above the $1.40 level and potentially move toward the main target around $2.
The trend is going in waves, we expect there will come a moment when this token will go out the normal trend of waves and against BTC to break up the $1.40

USDCAD: Uptrend ContinuationThis trade is not near a major daily level, but I think it does have potential.
Daily Timeframe
Price made a very clean break above the HTL
Bearish move only lasted two days, which is an indication of weak momentum
H1 Timeframe
Price crosses above EMA20 and continues accelerating away
EMA20 is accelerating away from EMA60
Price also crossed DTL, but caution that this was not a clean break

GBP/JPY - Breakdown 1H🔥 GBP/JPY – 1H Breakdown 🔥
Alright fam, let’s cook this chart 👇
📊 Structure Check
Price has been tanking hard from that 4H supply zone up top.
We formed a lower high (LP S) and then rolled over, continuing bearish structure.
Currently price is consolidating under a descending trendline → looks like it’s coiling for a move.
🎯 Key Zones
Upside liquidity grab: Price could squeeze into that 71% retrace + 15M/1H supply pocket.
🔼 That’s the “snack stop” zone before bigger players slam it.
Downside magnet: We’ve got strong support marked lower (blue zone). That’s the real draw if supply holds.
🛠️ Scenarios
Fakeout Pump → Dump
Price squeezes up into that 71% + supply zone.
Liquidity gets eaten → sellers step in.
Drop straight into strong support.
Direct Breakdown
If no pump happens, this wedge could just crack down.
Same target: strong support area below.
⚖️ Bias
Short-term bullish liquidity sweep possible 🚀
But overall still bearish until strong support proves otherwise.
📝 Game Plan
Watch the 71% + supply combo for rejection entries 🎯
Target the support zone below
Manage risk – don’t chase mid-range chop
⏳ Looks like GBP/JPY wants to bait longs before flushing again. Stay sharp, fam.

Bitcoin establishes early Uptober support baseToday was a positive sign as bitcoin rose $3236, or 2.9%, to $114,3500. That move potentially helped establish a potential floor for the Uptober rally.
From a technical perspective, Bitcoin is holding above the rising 100-day exponential moving average, which has acted as dynamic support at times since April. The price has broken this trendline multiple times over the past few months, and each time buyers have stepped in to defend it.
Upside levels to watch:
$116,500 – First resistance from late September intraday highs.
$120,000 – Key swing high from July, a strong psychological barrier.
$124,000 – Major resistance from August.
$128,000 – Year-to-date peak.
$140,000 – Round number resistance and measured move target if Bitcoin clears $128K. Also lines up with Fibonacci extensions of the April–August rally.
$150,000 – Big psychological milestone.

SPX500 – Bearish Below 6,662 as Shutdown Risks Cloud Fed OutlookSPX500 – Overview
SPX500 is trading cautiously as Wall Street weighs the risk of a potential U.S. government shutdown and the Fed’s next policy steps.
The lack of clarity over upcoming economic data—especially if NFP is delayed—adds to volatility and makes short-term moves highly data- and headline-driven.
Technical Outlook
The index has stabilized below the 6,662 pivot, which supports ongoing bearish momentum.
→ As long as price stays under 6,662, downside targets are 6,635 and 6,617, with a further extension toward 6,580 if momentum accelerates.
However, if price stabilizes above 6,673, the bullish trend could resume toward 6,699 and higher.
Pivot: 6,662
Support: 6,635 – 6,617 – 6,580
Resistance: 6,674 – 6,699 – 6,742

BTCUSD: Watching for the Dip and Bounce to the Trend LineHello everyone, here is my breakdown of the current Bitcoin setup.
Market Analysis
From a broader perspective, the price of Bitcoin is currently consolidating within a large Range, just below a major descending Trend Line. This indicates a period of balance and energy build-up after a significant prior move.
Currently, the price is in a corrective pullback within this Range. It is heading towards the lower support levels, a key area where buyers have previously shown strength and absorbed selling pressure.
My Scenario & Strategy
My scenario is built on the idea that this consolidation is a bullish accumulation phase. I think that before the main rally continues, the market will make a small corrective movement down to test the Support zone.
I'm looking for a confirmed bounce from this Support zone around the 109000 level. This would be the key signal that the pullback is over and that buyers are ready to take control for a move towards the upper boundary of the consolidation.
Therefore, the strategy is to watch for this bounce. A successful rebound would validate the long scenario. The primary target for the subsequent rally is the 115500 trend line at the top of the Range.
That's the setup I'm tracking. Thank you for your attention, and always manage your risk.

GBPAUD: Late EntryDaily Timeframe
Price is crossing HTL
Overall structure is ranging so it's possible that this will pull back quick
H1 Timeframe
Price crossed ATL
Entry is a bit late so stop loss need to be set wider to accommodate intraday pullback move

NZDCAD: HTL HoldDaily Timeframe
Price holds below HTL as it fails despite opening higher after last week's closing bar
H1 Timeframe
Price crosses below ATL to signal possible downside momentum
Price crosses below EMA20 and is moving away from the band
EMA20 hovers below EMA60 to indicate bearish sentiment

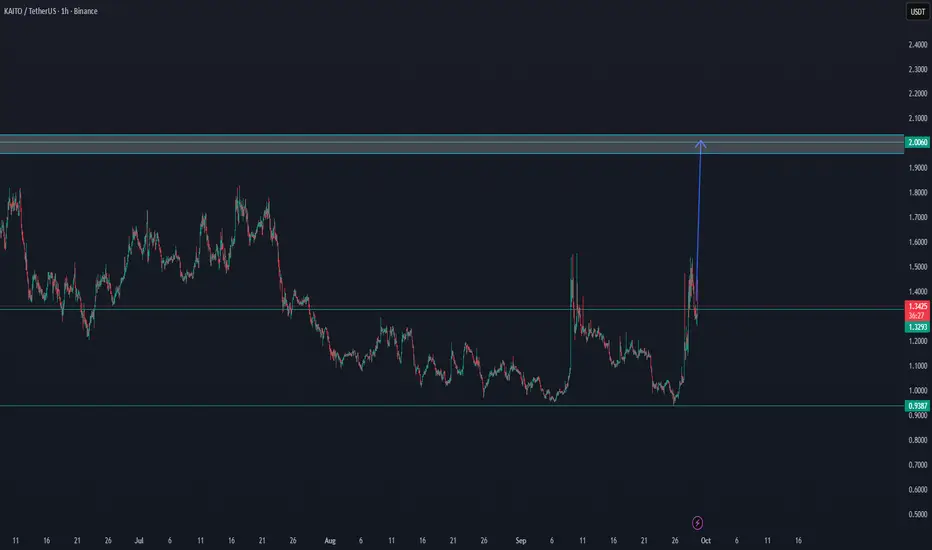
KAITO/USDT NEW INCREASE VOLUME - SOON $2 POSSIBLEdepending on confirmation from the lower time frames, Kaito may be showing early trend signals. Recent exchange data also indicates a rise in trading volume, which could increase the likelihood of a potential breakout.