Market Phases Explained: Accumulation, Expansion, Distribution🔵 Market Phases Explained: Accumulation, Expansion, Distribution, Reset
Difficulty: 🐳🐳🐳🐳🐋 (Advanced)
Markets do not move randomly. They rotate through repeatable phases driven by liquidity, psychology, and participation. Understanding market phases helps traders stop forcing strategies and start trading in alignment with the current environment.
🔵 WHY MARKET PHASES MATTER
Most traders struggle not because their strategy is bad, but because they apply it in the wrong market phase.
Breakout strategies fail in accumulation
Mean-reversion fails during expansion
Trend-following fails in distribution
Reversal trading fails before reset is complete
Market phases explain when a strategy works, not just how .
Price action, indicators, and volume behave differently in each phase.
🔵 THE FOUR MARKET PHASES
Markets move in a repeating cycle:
Accumulation
Expansion
Distribution
Reset
Each phase has unique characteristics, risks, and opportunities.
🔵 1. ACCUMULATION (QUIET POSITIONING)
Accumulation occurs after a decline or prolonged sideways movement.
This is where smart money builds positions quietly.
Key characteristics:
Price moves sideways in a range
Volatility is low
Breakouts frequently fail
Volume is stable or slightly rising
What is really happening:
Large players accumulate positions without moving price too much. Liquidity is absorbed.
Indicator behavior:
RSI oscillates between 40 and 60
MACD hovers near the zero line
Volume spikes are quickly absorbed
Best strategies:
Range trading
Mean reversion
Patience and preparation
🔵 2. EXPANSION (TREND DEVELOPMENT)
Expansion begins when price breaks out of accumulation with conviction.
This is where trends are born.
Key characteristics:
Strong directional movement
Increasing volatility
Pullbacks are shallow
Breakouts follow through
What is really happening:
Accumulated positions are now leveraged. Momentum attracts participation.
Indicator behavior:
RSI holds trend zones (40–80 or 20–60)
MACD expands away from zero
Volume increases during impulse moves
Best strategies:
Trend-following
Pullback entries
Breakout continuation
🔵 3. DISTRIBUTION (QUIET EXITING)
Distribution occurs after an extended trend.
Price may still rise, but momentum starts to weaken.
Key characteristics:
Higher highs with weaker follow-through
Increased wicks and failed breakouts
Volatility becomes unstable
Late buyers get trapped
What is really happening:
Smart money distributes positions to late participants while maintaining the illusion of strength.
Indicator behavior:
RSI diverges or fails to make new highs
MACD histogram shows lower highs above zero
Volume spikes near highs
Best strategies:
Profit protection
Reduced position size
Waiting for confirmation of weakness
🔵 4. RESET (LIQUIDITY CLEARING)
Reset is when the previous trend fully unwinds.
This phase clears excess leverage and weak hands.
Key characteristics:
Sharp moves against prior trend
Stop-loss cascades
Emotional price action
High volatility without clear direction
What is really happening:
Leverage is flushed. Weak positions are forced out.
Indicator behavior:
RSI reaches extreme levels
MACD crosses zero decisively
Volume spikes dramatically
Best strategies:
Capital preservation
Waiting for stabilization
Avoiding prediction
🔵 HOW TO IDENTIFY THE CURRENT PHASE
Ask these questions:
Is price trending or ranging?
Are breakouts succeeding or failing?
Is momentum expanding or contracting?
Are indicators confirming or diverging?
No indicator works in all phases. Phase identification is the real edge.
🔵 COMMON MISTAKES
Forcing trend strategies during accumulation
Chasing breakouts during distribution
Trading reversals before reset completes
Ignoring momentum deterioration
Most losses come from being right about direction but wrong about phase.
🔵 CONCLUSION
Markets move in cycles because human behavior and liquidity move in cycles.
Accumulation builds positions
Expansion rewards patience
Distribution traps late entries
Reset clears the board
When you learn to identify market phases, you stop fighting the market and start working with it.
Which market phase do you find hardest to trade? Accumulation, expansion, distribution, or reset? Share your thoughts below.
Trendanalyisis

USOIL UPDATE📊 USOIL UPDATE — Key Levels in Focus! 🔥
Price is testing an important zone, and traders are closely watching for the next move. Momentum around these levels could indicate short-term strength or weakness in the market.
🔓 Entry Level: 57.48
❌ Stop Loss: 56.91
🎯 Target: 58.03
Keep an eye on how price reacts here — structured levels like these help spot potential opportunities while managing risk effectively.
💬 What’s your outlook on USOIL?
Bullish or bearish? Share your thoughts below and join the discussion! ⬇️
Your engagement helps this post reach more traders and boosts visibility on feeds 👍
Disclaimer: This post is for educational and informational purposes only. It reflects personal chart observation and is not financial advice. Please do your own research before trading.

GOLD ANALYSIS What’s Moving the Market Today? December 03, 2025OANDA:XAUUSD GOLD ANALYSIS What’s Moving the Market Today? (December 03, 2025)
Welcome back to Trade with DECRYPTERS, where we decode smart-money footprints into clean, actionable buy & sell zones.
Keep it simple. Trust the levels. Follow the plan.
📰 Market Overview
Gold continues its steady climb after reacting perfectly from Smart Money Buy Orders earlier this week. Price is now rotating upward toward major liquidity pockets and premium sell zones, keeping bulls in command despite light USD stabilization.
The U.S. Dollar Index has cooled after post-election volatility, hovering near structural lows. Combined with ongoing geopolitical tensions and heavy central-bank accumulation, gold remains firmly inside a macro-bullish environment.
With key U.S. data releases (ADP, ISM Services, PCE) lined up this week and the December 9–10 FOMC meeting approaching, markets are moving cautiously. Gold remains well-positioned inside a premium–discount rotation, respecting structure cleanly.
🔍 Key Fundamentals Driving Today’s Move
📈 88% probability of a December rate cut → lower yield competition boosts gold
💵 USD stabilizing but not strengthening → limited downside pressure
🌍 Geopolitical tensions elevated → increased safe-haven premium
🏦 Central banks remain net buyers (634t YTD) → strong long-term demand
📊 Core PCE at 2.9% → keeps Fed leaning dovish
Gold’s strength is driven by a reliable cocktail of macro uncertainty + structural demand + institutional order flow.
📆 Key Events to Watch
🔸 Unemployment Data Today at 01:15 UK Time
Weak unemployment figures signal labor softness, boosting expectations of a December rate cut.
This typically drives gold into a bullish continuation toward upper sell zones.
Stronger data, however, reduces dovish pressure and strengthens the USD temporarily.
Expect a downward liquidity sweep into discount buy areas before any recovery.
First move is often manipulation the real direction comes after liquidity is taken.
🔸 Geopolitical Landscape
Geopolitical tensions remain a major volatility driver for gold’s intraday movement.
Any escalation triggers an immediate safe-haven spike, sending price rapidly toward premium zones.
Calm conditions allow mild USD recovery, creating controlled pullbacks into discount levels.
Structure stays bullish, but momentum slows as markets wait for the next catalyst.
Overall, geopolitics amplifies whichever trend smart money is already building
🟩 GOLD TECHNICAL LEVELS
Gold continues to respect rising structure, reacting precisely from discount zones and rotating toward your institutional premium blocks. Price now sits directly beneath major supply.
🟩 📌 SMART MONEY BUY ORDERS: 4147 – 4167
This is the primary institutional demand block, loaded with nearly $19 million in buy-side liquidity.
Expect:
✔️ Strong first-tap reactions
✔️ Accumulation + mitigation behavior
✔️ Discount long setups inside broader bullish channel
A clean breakdown below 4147 opens liquidity toward 4108 → 4075.
🟧 📌 SCALP SELL AREA: 4240 – 4252
Short-term liquidity zone used for:
✔️ Quick reaction scalps
✔️ Intraday reversals before the major premium zone
✔️ Stop hunts before the bigger move
Rejection here typically sends price back to 4200–4210 liquidity.
🔺 📌 SMART MONEY SELL AREA: 4264 – 4284
Your high-probability institutional distribution zone holding $29 million in sell-side orders.
Expect:
✔️ Manipulation wicks into premium
✔️ Stop-run behavior
✔️ Swing-reversal setups near the top of the range
A break & hold above 4284 = continuation toward 4310 → 4325.
📌 Conclusion
Gold remains firmly bullish as long as the 4147–4167 Smart Money Buy Zone holds, with price continuing to rotate cleanly between institutional premium and discount areas. With unemployment data set to trigger volatility, expect liquidity sweeps rather than major trend shifts. Stay patient, react only at key zones, and let smart-money footprints guide your next move.
🙌 Support the Analysis
If this breakdown brought clarity to your trading:
👍 Drop a like
💬 Comment your levels
📈 Share your charts with the community
Let’s grow together.
Best Regards,
M. MOIZ KHATTAK | Founder — TRADE WITH DECRYPTERS

GOLD ANALYSIS What’s Moving the Market Today? December 03, 2025OANDA:XAUUSD GOLD ANALYSIS What’s Moving the Market Today? (December 03, 2025)
Welcome back to Trade with DECRYPTERS, where we decode smart-money footprints into clean, actionable buy & sell zones.
Keep it simple. Trust the levels. Follow the plan.
📰 Market Overview
Gold continues its steady climb after reacting perfectly from Smart Money Buy Orders earlier this week. With price now rotating toward upper liquidity pockets, bulls remain firmly in control despite mild USD stabilization.
The U.S. Dollar Index has cooled after its post-election volatility, but ongoing geopolitical pressure and aggressive central-bank accumulation continue to support gold’s macro-bullish structure.
With key U.S. data (ADP, ISM Services, PCE) lined up this week and the FOMC approaching on December 9–10, markets are moving cautiously. Gold remains well-positioned inside a clean premium–discount rotation, respecting SMC structure consistently.
🔍 Key Fundamentals Driving Today’s Move
📈 88% probability of a December rate cut → lower yield competition boosts gold
💵 USD stabilizing but not strengthening → limits downside pressure
🌍 Global geopolitical tensions remain elevated → strong safe-haven premium
🏦 Central banks remain net buyers (634t YTD) → long-term structural demand
📊 Core PCE at 2.9% → keeps the Fed dovish-leaning but cautious
Gold’s strength continues to be driven by a clean mix of macro uncertainty, structural demand, and institutional order-flow behavior.
📆 Key Events to Watch
🔸 ADP Employment Data — Today at 01:15 UK Time
Weak ADP → bullish continuation toward sell zones
Strong ADP → liquidity sweep downward into buy areas
🔸 ISM Services PMI — Later Today
Contraction → strengthens rate-cut expectations
Expansion → stronger USD → intraday dip
🔸 PCE Inflation — December 5
The Fed’s preferred gauge
Soft PCE → pushes gold toward 4300+
Hot PCE → deeper retracement
🔸 FOMC Decision — December 9–10
Market expects 25 bp cut.
Hawkish → tests deeper discount zones
Dovish → breaks into new highs
🔸 Geopolitical Landscape
Any escalation = instant safe-haven spike
Calm USD strength = controlled pullback
🟩 GOLD TECHNICAL LEVELS
Gold continues to respect the rising structure, reacting precisely from discount zones and moving toward your institutional premium blocks. The impulsive bullish leg now positions price directly beneath the next major Smart Money Sell Area.
🟩 📌 SMART MONEY BUY ORDERS: 4147 – 4167
This is your primary institutional demand block, holding nearly $19 million in buy-side liquidity.
Expect:
✔️ First-tap reactions
✔️ Accumulation behavior
✔️ Discount long setups inside the broader bullish channel
A clean breakdown below 4147 opens liquidity toward 4108 → 4075.
🔺 📌 SMART MONEY SELL AREA: 4264 – 4284
This remains your high-probability distribution block, stacked with $29 million in sell-side orders.
Expect:
✔️ Manipulation wicks into premium
✔️ Stop-run behavior
✔️ Swing reversal setups
A break & hold above 4284 = continuation toward 4310 → 4325.
📌 Conclusion
Gold continues to rotate smoothly between institutional premium and discount zones, maintaining a strong bullish structure as long as 4147–4167 holds firm. With ADP data set to inject volatility, expect liquidity-driven movements rather than trend shifts. Stay patient, let the levels do the work, and execute only where smart money is active.
🙌 Support the Analysis
If this breakdown adds clarity to your trading, support with a like & comment it motivates deeper daily analysis.
Share your charts. Engage with the community.
Let’s grow together.
Best Regards,
M. MOIZ KHATTAK | Founder — TRADE WITH DECRYPTERS

USD/JPY Analysis : Potential Reversal & Supply From Target Zone 📈 USD/JPY 1H: Potential Reversal and Supply Retracement Play
🔑 Key Context: Bearish Trend with Demand Zone Reaction
The chart initially shows a strong downward trend or significant pullback, characterized by lower swing highs and lower swing lows on the 1-hour chart. This bearish movement breached a prior low established around November 27th.
Prior Structure: Price fell sharply, breaking below a level that was part of a previous consolidation or minor distribution phase (the area marked 'D-R Supply' boundary).
Current Action: The price has recently made a strong low and is now showing signs of an aggressive move back up (a recovery rally).
🎯 Identifying Key Zones
The analysis highlights three critical zones based on supply/demand and technical structure:
1. Reversal Zone (Demand) 🟢
This is the lowest green box, around 154.650 - 154.800.
Significance: This zone acted as a strong Demand area, causing the significant bullish reversal/bounce we are currently seeing. It's the point where buyers stepped in aggressively, stopping the immediate bearish momentum. The low of the move touched the upper boundary of this zone before the strong rally began.
2. D-R Supply (Drop-Base-Drop/Rally-Base-Drop Supply) 🔴
This is the overall consolidation area that was previously broken, roughly between 155.600 and 156.400.
Significance: This large area represents where a significant amount of selling pressure entered the market, leading to the large drop. The current move upward is likely a retracement back into this supply structure.
3. Target and Volume Burst Zone 🔵 & 🟢
Target (Blue Box): This level, around 156.350 - 156.450, appears to be the immediate objective for the current bullish move. It lines up with the bottom of the old consolidation area (the D-R Supply).
Volume Burst (Top Green Box): This zone, from approximately 156.450 to 156.650, represents the upper part of the broken supply zone. This is a potential high-probability area where the initial sellers are likely to defend their positions, leading to a strong reaction (a "Volume Burst" of selling/distribution).
💡 Trading Hypothesis: Retracement to Supply
The current price action suggests the following trade setup:
Scenario : The bounce from the Reversal Zone (Demand) is expected to continue as a retracement to test the broken D-R Supply zone above.
Entry: Traders who entered at the Demand Reversal Zone would be looking to hold the position. New entries might look for continuation patterns to join the current rally.
Take Profit: The Target (blue box) and the lower part of the Volume Burst zone are key areas for taking profit on long positions, as price is expected to encounter significant resistance there.
Continuation/New Trade: Once the price reaches the Volume Burst area, a new short trade setup could be considered, anticipating a rejection and resumption of the overall bearish bias or a continuation of the downtrend from that high-resistance level.
⚠️ Caveats and Confirmation
The current rally needs to maintain momentum and successfully break above the CZ (Confirmation Zone) level marked around 156.000 to confirm the target is achievable.
Failure to sustain the rally above the 156.000 area could indicate a shallower retracement or a potential double-bottom/range setup.
Risk Management: Any long trade should place a stop-loss below the Reversal Zone low.

GOLD ANALYSIS What’s Moving the Market Today? (December 1, 2025)EIGHTCAP:XAUUSD GOLD ANALYSIS What’s Moving the Market Today? (December 1, 2025)
Welcome back to Trade with DECRYPTERS, where we decode smart-money footprints into clean, actionable buy & sell zones.
Keep it simple. Trust the levels. Follow the plan.
📰 Market Overview
Gold continues its aggressive climb after reclaiming momentum from the recent Smart Money Buy Orders, with price now pushing toward upper liquidity pockets. Despite a mildly firmer U.S. dollar, the metal remains firmly bid as the market leans into dovish Federal Reserve expectations and post-shutdown uncertainty.
The Dollar Index has stabilized after its post-election rally, but lingering geopolitical risks and strong central-bank accumulation continue supporting gold’s higher-timeframe bullish trend.
With major U.S. data releases delayed due to the government shutdown, markets are moving cautiously ahead of the December 9–10 FOMC, keeping gold rotating neatly inside premium–discount structure.
🔍 Key Fundamentals Driving Today’s Move
📈 87% probability of a December rate cut → boosts gold by lowering yield competition
💵 USD stabilizing → temporary cap on bullish extension but no reversal signal
🌍 Geopolitical tensions elevated → safe-haven premium remains strong
🏦 Central banks added 64 tones in September → long-term bullish structural support
📊 Inflation at 2.9% (Core PCE) → keeps Fed cautious but not aggressive
Gold’s strength is being driven by a blend of macro uncertainty, structural demand, and clean technical rotations inside your SMC framework.
📆 Key Events to Watch
🔸 November CPI — December 18
The biggest wildcard.
Soft CPI → Fed turns dovish → gold targets upper resistance zones
Hot CPI → USD lifts → gold dips into buy areas
🔸 ADP Jobs + ISM Manufacturing (This Week)
Weak labor or manufacturing → boosts rate-cut odds → bullish continuation
Strong data → pullback into buy zones
🔸 FOMC Meeting — December 9–10
Market expects a 25 bp cut.
Hawkish tone → tests 4125 → 4070 → deeper sweeps
Dovish tone → drives 4257 → 4282 and possibly beyond
🔸 Geopolitics
Any escalation = instant safe-haven spike
Calm + stronger USD = controlled retracement
🟩 GOLD TECHNICAL LEVELS
Gold continues respecting the rising structure, reacting strongly from discount zones and pushing into institutional premium blocks.
The impulsive move from the lower support has now carried price directly into your next major smart-money liquidity zone.
🟩 📌 SMART MONEY BUY ORDERS: 4017 – 4032
Primary institutional demand block.
Expect:
✔️ First-tap reactions
✔️ Swing accumulation
✔️ Discount long setups inside the broader bullish channel
A clean break below opens liquidity toward 3960–3950.
🔺 📌 SMART MONEY SELL AREA: 4257 – 4282
Your primary institutional distribution block.
Expect:
✔️ Manipulation wicks
✔️ Stop-hunts
✔️ Swing reversals
A break & hold above 4282 = continuation toward 4310–4325.
📌 Conclusion
Gold remains in a controlled, high-probability rotation between institutional premium and discount zones, with 4238–4245 acting as the decisive intraday pivot. As long as buyers defend structure and macro sentiment leans dovish, the path of least resistance continues to favor upside toward the 4257–4282 distribution block. Stay disciplined, let liquidity guide execution, and trade only where smart money is active.
🙌 Support the Analysis
If this breakdown improves your trading, support with a like & comment — it motivates deeper daily analysis.
Share your charts and setups. Let’s grow together.
Best Regards,
M. MOIZ KHATTAK | Founder — TRADE WITH DECRYPTERS

GOLD ANALYSIS What’s Moving the Market Today? November 28, 2025OANDA:XAUUSD GOLD ANALYSIS What’s Moving the Market Today? (November 28, 2025)
Welcome back to Trade with DECRYPTERS, where we decode smart-money footprints into clean, actionable buy & sell zones.
Keep it simple trust the levels, follow the plan.
*📰 Market Overview*
Gold continues to hold strong inside the rising channel after reacting beautifully from the Smart Money Buy Orders (4086–4099) the exact zone that ignited the latest impulsive push. Despite a firmer USD rotation earlier in the week, buyers have returned aggressively as volatility compresses near equilibrium.
The Dollar Index remains anchored near the 100.20 region, limiting aggressive upside continuation but still allowing steady bullish rotation fueled by geopolitical uncertainty and consistent central-bank demand.
With high-impact macro data delayed due to the recent U.S. government shutdown, markets are positioning cautiously ahead of the December FOMC, keeping gold in a structured premium discount cycle.
*🔍 Key Fundamentals Driving Today’s Move*
📈 DXY steady near 100.20 → caps bullish momentum temporarily
🏦 Fed divided on rate cuts → softer expectations for December
🌍 Geopolitical tensions remain elevated → Middle East & Ukraine risk premium
🏛 Central banks continue accumulating → long-term bullish foundation
📊 ETF inflows cool → controlled month-end profit-taking
The push-and-pull between a cautious Federal Reserve and persistent global uncertainty keeps gold rotating cleanly between your smart-money levels.
*📆 What’s Ahead Key Events to Watch*
🔸 Flash PMIs — This Week
Manufacturing expected near 49
Services around 51
Weak PMI → boosts cut expectations → gold bullish
Strong PMI → DXY lift → gold retests demand zones
🔸 US Q3 GDP & Jobless Claims
First major releases after the data backlog.
Strong GDP = delays cuts → pullback into buy zones
Weak data = safe-haven flows → bullish continuation
🔸 FOMC Meeting — December 16
Market sees a pause, but weak labor prints could revive hopes for a 25bp cut.
Hawkish tone → tests 4146 EQ → 4099 → 4086
Dovish tone → pushes 4165 → 4219 → 4244
🔸 Geopolitical Premium
Any escalation = instant safe-haven spike
Calm + strong USD = controlled retracements
*🟩 GOLD TECHNICAL LEVELS*
Gold continues to respect the rising channel, tapping premium zones for sells and discount zones for accumulation.
The latest impulsive move from 4086–4099 has lifted price into the next liquidity zone around 4146–4165, matching your structural breakout.
*🎯 EQUILIBRIUM (EQ): 4144 – 4148*
This is today’s directional pivot.
✔️ Hold Above EQ
Momentum strengthens toward:
➡️ 4165 → 4184 → 4219
✔️ Drop Below EQ
Weakens flow toward:
➡️ 4099 → 4086
Deep sweep possible if macro data disappoints.
*🟩 📌SMART MONEY BUY ORDERS: 4086 – 4099*
Your primary institutional demand zone.
Perfect for:
✔️ Intraday dip-buys
✔️ First-tap reactions
✔️ Discount rotations inside the channel
A clean break below opens liquidity toward 3955–3964.
*🟩 📌 SCALP BUY AREA: 4147 – 4137*
Your micro-discount reaction area.
Expect:
✔️ Fast scalps
✔️ Partial liquidation
✔️ High-volatility wicks
Deep sweeps toward here usually appear only during macro-driven flushes.
*🟥 📌 SCALP SELL AREA: 4184 – 4196*
Consistent intraday rejection zone.
Ideal for:
✔️ Low-risk scalping shorts
✔️ Liquidity grabs
✔️ Wick-heavy reactions
A clean break above 4196 opens path into major distribution.
*🔺 📌 SMART MONEY SELL AREA: 4219 – 4244*
Your main institutional distribution block.
Expect:
✔️ Manipulation wicks
✔️ Stop-hunt behavior
✔️ Swing-level reversals
A break & hold above 4244 = continuation into 4279–4293.
*📌 Conclusion*
Gold continues to rotate smoothly between premium and discount zones, with 4144–4148 EQ acting as the decisive intraday pivot. A sustained hold above this level favors continuation into 4184–4196 and the 4219–4244 distribution block, while rejection brings price back toward 4099–4086 for fresh accumulation. With delayed macro data and elevated geopolitical tensions shaping sentiment, expect controlled, level-to-level movement driven by smart-money flow. Stay disciplined and trade only where liquidity is building.
Stay patient.
Execute only where smart money is active.
Let the levels do the work.
*🙌 Support the Analysis*
If this helps your trading, show some support with likes & comments it motivates deeper daily breakdowns.
Share your charts, levels, and predictions. Let’s grow together.
Best Regards,
M. MOIZ KHATTAK | Founder TRADE WITH DECRYPTERS

What are your thoughts on GOLD?Hello Traders! 👋
Currently, GOLD has reached the upper resistance of the range and is showing signs of weakening — forming lower highs, suggesting buyers are losing strength and selling pressure may return.
🔍 Key Technical Highlights
Price reacted strongly at the 4120–4140 resistance zone.
Emerging pattern of lower highs, signaling bearish pressure.
Main support to watch: 4040–4060.
Short-term trend: bearish correction within the range.
Medium-term trend: neutral / sideways.
Current Expectation
If GOLD continues to fail at the 4140 zone, it’s likely that price will:
👉 Decline back toward 4060,
and potentially further to 4040, the bottom of the range.
📌 Trade Signal (Technical Setup)
Sell Setup:
Sell zone: 4120–4140
Stop Loss: above 4160
Take Profit 1: 4080
Take Profit 2: 4060
Take Profit 3 (extended target): 4040
Conclusion
GOLD remains in consolidation. Price is now at a key resistance zone and showing signs of exhaustion, so selling from 4120–4140 remains the preferred strategy. The overall structure is still sideways until the market breaks above 4140 or below 4040 with conviction.
Don’t forget to like and share your thoughts in the comments! ❤️

GOLD Analysis (Nov 19, 2025) - Key Levels for BreakoutOANDA:XAUUSD GOLD ANALYSIS What’s Moving the Market Today? (November 19, 2025)
Welcome back to Trade with DECRYPTERS, where we turn complex charts into clean buy & sell zones.
Keep it simple. Let levels drive your decisions.
*📰 Market Overview*
Gold dipped after failing to hold above $4,100, sliding toward the mid-range as the U.S. Dollar Index (DXY) climbs toward 99.55. Expectations for a December rate cut weaken (now ~47%), adding pressure on metals.
*Key fundamentals driving today’s volatility:*
📈 DXY rebound → reduces short-term gold momentum
🏦 Fed hawkish tone after October’s cut; policymakers want “pause & observe”
📉 Shutdown-related data blackout = mixed signals + unpredictable volatility
🌍 Geopolitical tensions (US–China tariffs, Mideast, Ukraine-Russia) continue to anchor safe-haven flows
🏛 Central banks still buying: Q3 +220t, Poland +67t YTD
*📊 ETF flows:*
ETF flows hit a record +222t in Q3, but November is seeing mild outflows even as AUM holds near $472B. It’s like investors took a big bite earlier, but are now nibbling less while still keeping most of their gold on the table.
*📆 What’s Ahead Key Events to Watch*
🔸 FOMC Meeting – Dec 10
Odds remain mixed with a slight hawkish tilt; any surprise tough tone could pressure gold short-term.
🔸 Data Blackout Continues
With CPI/NFP still imputed, November data may drop in clusters, triggering sudden volatility spikes.
🔸 Geopolitical Risk Premium
Escalation brings instant safe-haven demand, while de-escalation boosts DXY and pushes gold lower.
🟩 *GOLD TECHNICAL LEVELS*
By analyzing the #Gold chart on the 4H timeframe, we can see that after dropping to 3998 dollars, price found strong demand and has now climbed back up to around 4050 dollars.
*Whats NEXT ON GOLD ?* 👀👀
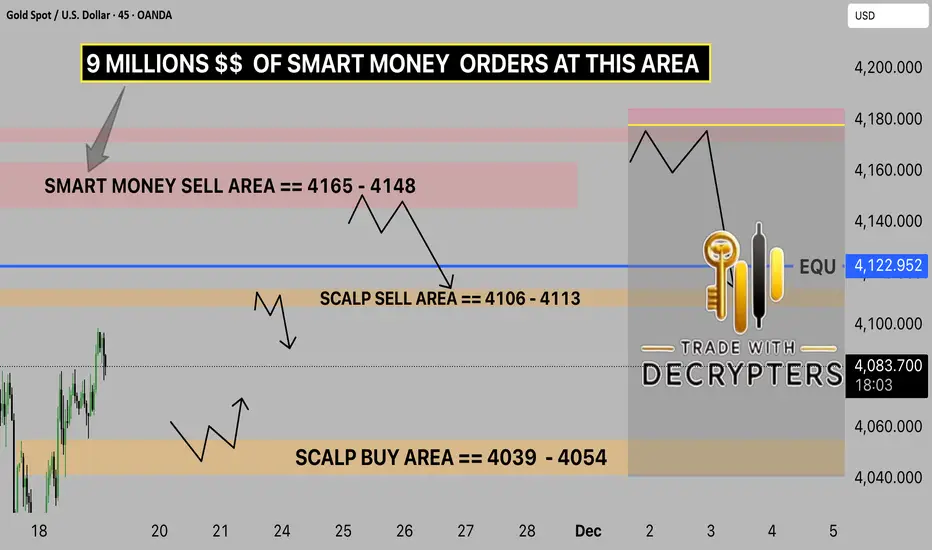
🎯 EQUILIBRIUM: 4122.95
Hold above = bullish momentum toward 4148
Stay below = re-test 4054 & possibly sweep 4039
🟩 📌 SCALP BUY AREA: 4039 – 4054
Strong intraday support + previous demand footprint.
🟥 📌 SCALP SELL AREA: 4106 – 4113
Expected rejection zone first reaction area.
🚨 📌 SMART MONEY SELL AREA: 4165 – 4148
CONCLUSION:-
Gold remains in a tight battle between demand at 4039–4054 and rejection zones near 4106–4113, with EQ at 4122.95 acting as the true directional trigger. Holding below EQ favors a pullback toward 4054/4039, while a clean break above opens momentum toward 4148–4165. Overall, range-bound with a slight downside bias until EQ is reclaimed.
*Please support me with your likes and comments to motivate me to share more analysis with you and share your opinion & chart with me !*
*Best Regards , M.MOIZ KHATTAK | FOUNDER OF TRADEWITHDECRYPTERS*
USD/JPY Has a Bearish Trading BiasThe USD/JPY pair is currently stable, with the Japanese Yen (JPY) strengthening slightly against the weaker US Dollar (USD). This JPY strengthening halted the previous day's sharp decline, but the overall movement of USD/JPY is limited by conflicting fundamental factors.
1. Market Fundamental Factors
A. Support for the Japanese Yen (JPY)
BoJ Hawkish: The minutes of the Bank of Japan's (BoJ) September meeting released on Wednesday maintained market expectations for an imminent interest rate hike.
Intervention: Speculation that Japanese authorities might intervene to prevent further JPY weakness also offered support.
B. Limits to JPY Strength and Support for USD/JPY
BoJ Uncertainty: Investors remain uncertain about the exact timing of the BoJ's next interest rate hike. This uncertainty is fueled by expectations that the new Prime Minister, Sanae Takaichi, will pursue an aggressive fiscal spending plan and resist policy tightening.
Global Risk Sentiment: A moderate recovery in global risk sentiment tends to weaken the safe-haven JPY.
Strong USD: The US dollar (USD) held steady near its highest level since late May on the back of the US Federal Reserve's hawkish stance, which helped limit USD/JPY's decline.
2. USD/JPY Technical Analysis
USD/JPY has been struggling below the key resistance level of 154.40-154.45 for over a week. This zone serves as a pivot point that determines the direction of price movement.
A. Bullish Scenario ⬆️
Trigger for a Rise: A sustained breakout and acceptance above 154.40-154.45 will be a signal for bulls.
Next Target: Spot prices will aim to reclaim the psychological 155.00 level.
Continued Target: Continued buying will open the way to the 155.60-155.65 resistance level, before rising further towards the 156.00 level.
B. Bearish Scenario ⬇️
Initial Support: The 153.65 area is expected to offer support, followed by the overnight low around 153.00 - 152.95.
Selling Trigger: Acceptance below 153.00 could trigger technical selling.
Downside Target: The corrective decline will accelerate towards the intermediate support level of 152.55 - 152.50, and extend towards the 152.00 round number and last week's low at 151.55.
USDJPY remains bearish below the pivot zone, with the next directional move to be confirmed by a breakout from the current consolidation range.

XAUUSD Smart Money Zones & Trade Plan — Nov 06, 2025🟡 GOLD ANALYSIS - Updated Nov 06, 2025
OANDA:XAUUSD Gold is consolidating between the $3,950–$4,020 range as the U.S. government shutdown delays key data releases.
DXY is weaker near ~100.15, while the Fed’s recent 25bps cut (3.75–4%) keeps markets uncertain about the next move.
Central Banks remain net buyers (+19t in August, +220t in Q3), led by Poland.
ETF inflows are supporting price while geopolitical tensions continue to fuel safe-haven demand.
🧭 SMART MONEY LEVELS (Valid Today)
🔻 SELL ZONES
• $4,025 – $4,037 → Smart Money Sell Area
• $4,015 – $4,005 → Scalp Sell Area
🔺 BUY ZONES
• $3,938 – $3,915 → Smart Money Buy Accumulation Range
Current Price: ~$3,990
📊 TECHNICAL OUTLOOK
• Holding above $3,950 maintains a mild bullish structure
• Break above $4,020 can retest $4,100
• Break below $3,915 may extend correction toward $3,900
🔮 Timing Insight
Between 22:00–23:00 UK Time, expect a potential bullish liquidity spike near buy zones.
📌 Conclusion
Gold remains in controlled consolidation with a bullish tilt.
Trade reaction to levels, not prediction.
Let liquidity guide entries.

Gold Market Update, Smart Money Levels & Macro Insight (29 Oct)OANDA:XAUUSD GOLD ANALYSIS – What’s Moving the Market Today?
Trade with DECRYPTERS | Let Levels Guide Your Moves
🚀 Market Pulse
Gold remains steady near $4,015, consolidating as the U.S. Dollar Index (DXY ~99.25) limits upside momentum amid renewed optimism over trade talks.
The Federal Reserve’s 25bps rate cut, combined with Powell’s cautious tone on future pauses, lifted yields temporarily, pressuring short-term gold sentiment.
Meanwhile, central banks continue strong accumulation, adding roughly 710 tonnes per quarter, led by China (11th consecutive month of buying).
These consistent inflows act as a price floor, keeping gold resilient even during intraday volatility.
🌍 Geopolitics & Safe-Haven Demand
Rising geopolitical risks and tariff concerns have revived gold’s safe-haven appeal.
During uncertainty, gold’s negative correlation to risk assets strengthens, when fear rises, gold shines.
Investors maintain exposure through ETFs and physical holdings, expecting volatility to persist ahead of key macro data.
📊 What to Watch Next
* Nov 1: U.S. Jobs Report (~150K expected)
→ A weaker print may revive rate-cut expectations.
* Nov 13: U.S. CPI Report
→ If core inflation holds near 3.0%, the Fed may pause rate cuts.
* Any flare-up in Middle East tensions or trade issues could trigger sharp rallies from key support zones.
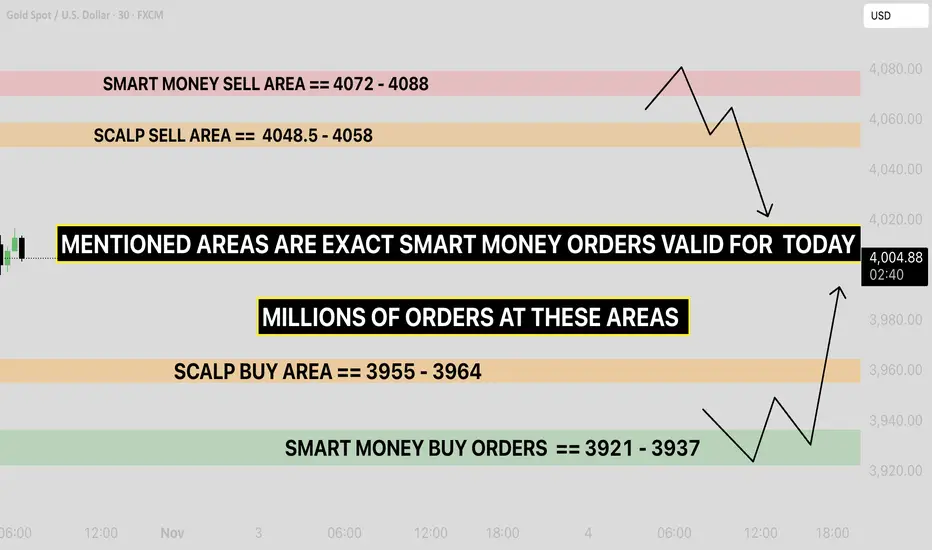
💹 Technical Framework (Smart Money Map)
📈 Current Price: ~$4,015/oz (+0.06%)
📊 Volatility Range: $3,980 – $4,050
* 🟥 Smart Money Sell Area: $4,072 – $4,088
→ Heavy institutional orders, short-term reversal zone.
* 🟧 Scalp Sell Area: $4,048.5 – $4,058
→ Ideal intraday reaction zone.
* 🟨 Scalp Buy Area: $3,955 – $3,964
→ Expect quick liquidity sweeps and bounces.
* 🟩 Smart Money Buy Orders: $3,921 – $3,937
→ Deep liquidity zone, institutional accumulation likely.
🧠 Conclusion – Mild Bullish Bias Within Consolidation
Gold is holding steady between central bank demand and Fed caution.
Bias remains mildly bullish within consolidation — supported by institutional inflows and geopolitical uncertainty.
📌 Above $4,000 → opens room to $4,200.
📌 Below $3,950 → exposes $3,921–$3,937 buy zone.
Stay patient. Let levels confirm direction — trade reaction, not prediction.
BTCUSD Breakout: Daily Neckline Close Targets 122,000–124,500Hello, traders—BTCUSD is coiling inside a broad 1D range after topping near 126,000. Buyers defended the demand zone at 104,000–108,000 and price has since pushed back toward a clear neckline around 116,000 formed by a developing double-bottom (lows from early September and mid-October). The structure is neutral-to-bullish, with momentum improving as price rebounds from the lower boundary.
Primary path: a daily close above 116,000 confirms the neckline break and opens room toward 122,000 first, then the 124,500–125,000 resistance where supply repeatedly capped rallies. If strength persists, watch for a break-and-hold above 125,000 to transition the range into continuation. Trade-wise, the cleaner confirmation is a daily close ≥116,000/116,500 with targets at 122,000 and 124,500 while using the prior breakout area to trail risk.
Alternative: a firm rejection at 116,000 would keep the range intact and invite a pullback toward 111,500. A decisive daily close below 111,500 puts 108,000 back in play; a loss of 108,000 risks a deeper sweep toward the 104,000 floor.
Invalidation for the bullish idea is a daily close back below 111,500 after breakout, or any decisive failure of 108,000 that negates the base. This is a study, not financial advice. Manage risk and invalidations

F Bullish Flag: Breakout Toward 14.50Ford (F) on the 1D chart is trending higher after an early-October surge from ~12.50 to ~13.97 on heavy volume. Price has since eased into a tight consolidation that reads like a bullish flag, with momentum still constructive above the rising 20/60/120-day MAs. Bollinger Bands that exploded on the breakout are now contracting, hinting at energy building for the next move.
The primary path is continuation: a daily close above ~13.50 (flag resistance) with an uptick in volume opens a run back to the October high near 13.90–14.00, with 14.50 as a measured-move objective. On pullbacks, the 12.55–12.70 area—former resistance and now a Demand zone—is the first spot buyers are likely to defend. If bulls control the breakout, trailing into strength and trimming near 13.90–14.00 makes sense before aiming for 14.50.
If price cannot clear 13.50 and instead closes below ~12.50, expect the flag to fail and momentum to cool toward 12.60, with risk of a deeper check toward the mid-term trend support. The bullish thesis is invalidated on a decisive daily close below ~12.20 (beneath the 20-day MA), which is the clean line in the sand for risk.
This is a study, not financial advice. Manage risk and invalidations

Bitcoin Analysis - Bulls vs ResistanceBitcoin triggers have been activated just as expected. Personally, I don’t think it’s a bad idea to hold current positions — we’ve got some solid entry points already.
📈 Bitcoin is showing a bullish trend, and as we approach the upcoming interest rate decision, momentum could build even more.
Above the $116,000 zone, we could see a long trigger, but personally, since I already have two open entries from lower levels, I won’t be adding new ones for now.
💡 If the interest rate is lowered, there’s a chance we’ll see a few red candles initially, but overall, it should be positive for the crypto market.
Right now, Bitcoin is facing a key resistance zone — breaking above it could confirm a bullish continuation on higher timeframes. 🚀
Disclaimer:
This content is for informational purposes only and does not constitute financial or investment advice. © DIBAPRISM
Larry D.Kohn

GOLD Actual Bullish Trend Analysis WAVE ANALYSIS / Gold reached the final zone of the substructure in the 4.23 projection, with this the wave 3 (W3) is completed and we should see a correction in the price when the bearish breakout is confirmed.

Swing trade opportunity in INOX WINDSwing trade opportunity in INOX WIND.
Entry - 150
Targets - 175 & 190
DISCLAIMER: I am not SEBI registered and the ideas posted are only for educational purpose. Always trade with proper STOP LOSS.

USDCHF higher bullish expecting
OANDA:USDCHF after today's and yesterday's events and SNB from week before, having bullish expectations. Trend based analysis.
SUP zone: 0.79550
RES zone: 0.80800, 0.81200

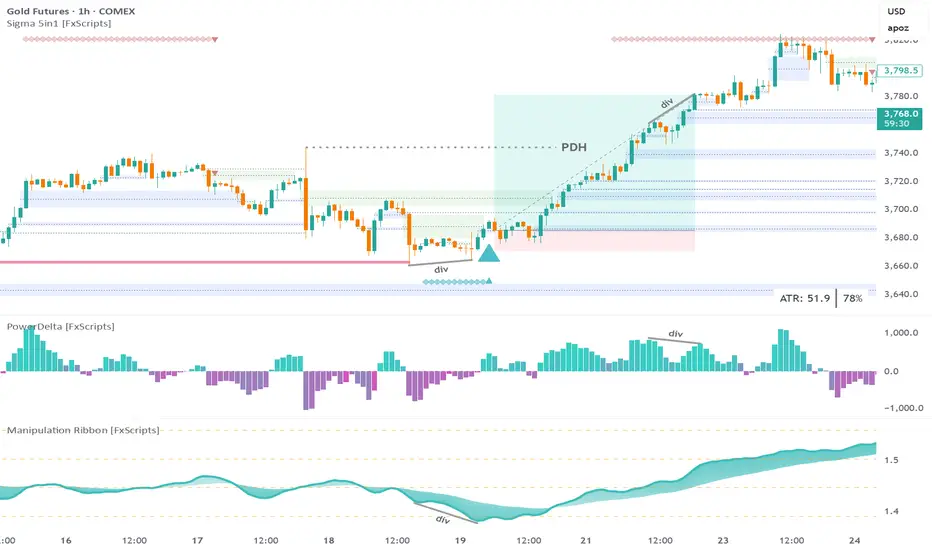
GC Futures 15m: 6.6:1 trade executed using Sigma Trading SystemStep 1: wait for a sweep of daily liquidity
Note: the sweep must be confirmed for any of the other confluences to be valid
Step 2: wait for a bullish marker to be drawn by the Reversal Print indicator
Tip: set an alert if you don’t want to spend all day staring at the chart
Step 3: look for a divergence with either the PowerDelta Oscillator or, in this case, the Manipulation Ribbon
Info: the Manipulation Ribbon detects areas of price manipulation by Market Makers vs areas where it is trading in a natural, price-driven state
Step 4: the entry is a tap of the most recent confirmed FVG
FYI: all the drawings on the main chart are created by the Sigma 5-in-1 indicator
SL: low of first candle that forms the entry FVG
Tip: for a more conservative approach the recent swing low could also be used
TP: bearish divergence with the PowerDelta Oscillator
Note: gold was at an all-time high so anything beyond the Previous Day High (PDH) posed a risk however for a more conservative approach you could exit half your position at the PDH
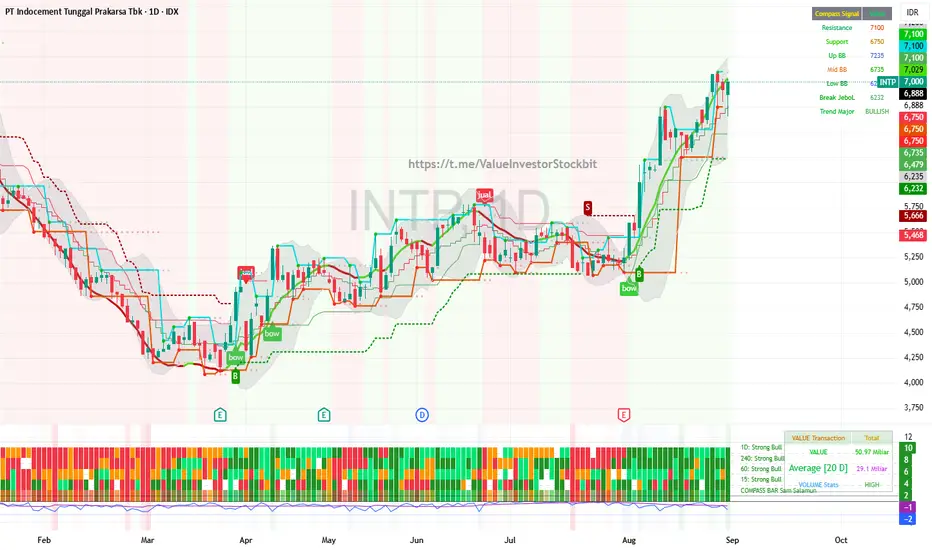
INTP masih strong bullish, stay HOLD sampai muncul signal sellINTP is still strongly bullish, stay HOLD until a sell signal appears.
For those who don't have one yet, consider an automatic buy in installments of 6650-6800
GOLD - Long📊 XAUUSD – 4H Setup
Gold finally broke out of the descending trendline 📈 after days of bearish movement.
Price tapped into the 3325 demand zone and pushed higher, showing fresh bullish intent.
Right now a clean retest of support could open the door for continuation into key resistance.
📍 Key Levels
Buy zone: 3350 demand retest level
First target: 3400 short-term resistance
Extended target: 3439 supply zone
Invalidation: Close below 3310 ⚠️
💡 Risks
False breakout above trendline trapping longs
Weak follow-through volume could send price back into the range
Macro pressure from USD strength keeping gold capped under 3380
✨ Big Picture
Gold has been coiling for weeks. If buyers defend 3325, we could see this breakout develop into a bigger bullish leg 🚀
👇 What’s your take traders? Breakout or fakeout?
🟢 Education only 🟢
❤️ Like + Follow for consistent swing ideas.

XAUUSD - Next Big Move. Expecting ATHBIAS
LTCC(Last two Candle Close)
As we can clearly see that the market is struggling to close below the previous day lows and only the previous day low liquidity being taken, Expecting buyers to pitch in. Clear Sign of BULLISH BIAS
LTCD(Last two Candle Divergence)
Present day shows a Bullish divergence with XAGUSD creating a Lower Low in it and XAGUSD Failing to do so.(Sign of Smart Money)
IRL to ERL(Internal Range Liquidity)
Momentum in Daily TF is Speed Up + Slow Down which is a clear sign of Strong Buyer and Weak Seller in the Market. In the current trading range of daily time frame XAUUSD has now reached to its discount level approaching a daily imbalance with LTCC and LTCD indicating Buyers in the Market.
Confirmation
In the H1 time frame we have a Strong Close above the OF(Order Flow), which is confirmation for our entry.
Disclaimer: The Above Analysis is for Educational Purpose Only and is not indented as investment purposes.
___________________________________
Thanks for your support!
If you found this idea helpful or learned something new, drop a like 👍 and leave a comment, I’d love to hear your thoughts! 🚀

Elliott Wave Analysis of Kirloskar Brothers KIRLOSBROSThe script is currently in 4th wave of hourly chart. The 4th wave seems to be ending, which means a 5th wave will start from here. The wave patters and patterns, retracements and analysis have been highlighted on the chart. Will update this as it progresses.
