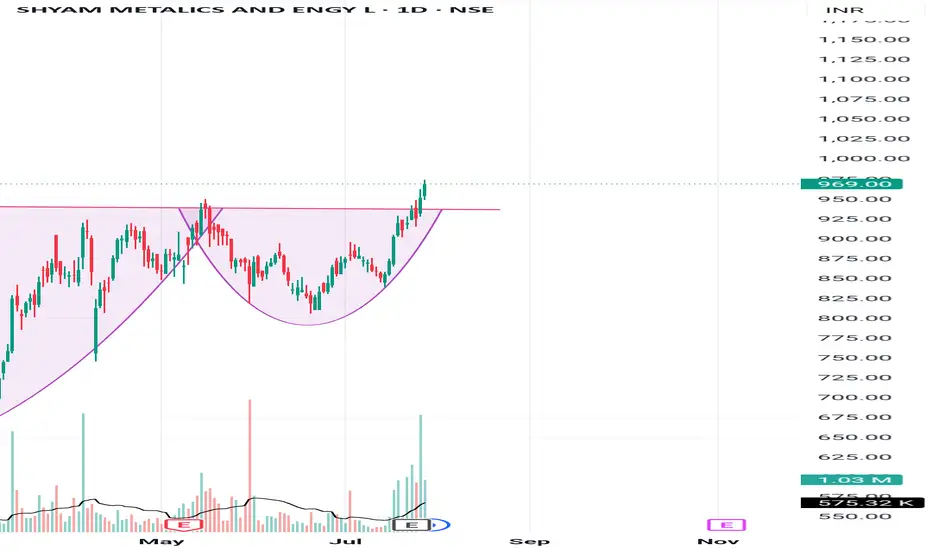
Cup and handle patternBreaks cup and handle pattern and going up. Looks bullish. Make sure to do your own analysis and maintain your risk management. This is only for educational purposes
Trend Analysis

Just like #AKRM, #SOL can also pump 100%Just like #AKRM, #SOL can also pump 100%..
SOL will also have this kind of exit rally. Whether there is a war between the US, Iran, and Israel or not, the market will crash very badly.

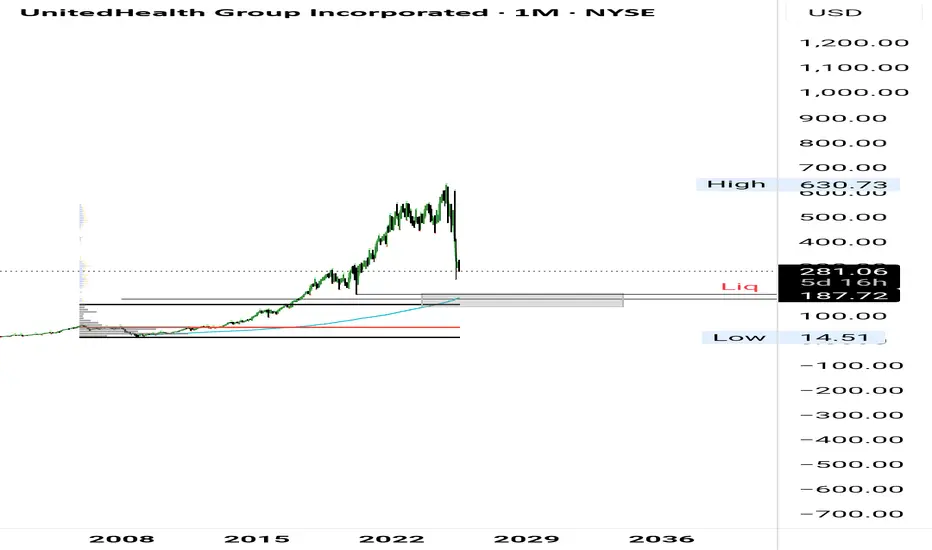
UNH Long Setup BuildingStill expecting more downside. Area of interest isn't far—anchored VWAP, VAH, 0.75 fib, and a possible liquidity sweep all line up there.
Gold (XAU/USD): Supply Zone Rejection & Bearish Breakdown Chart Breakdown:
Supply zone rejection: Gold revisited the “supply zone” (light green/grey area) and failed to break above — a classic signal of seller dominance.
Uptrend invalidated: A sharp rise (steep black trendline) ended with a peak marked by the green arrow, followed by a decisive breakdown.
Ichimoku Cloud test: Prices slipped through the Ichimoku components, reinforcing the shift to bearish sentiment.
Potential targets: The red/green risk‑reward box highlights a short position, targeting ~3,347 then ~3,318 levels (blue labels) as initial support zones.
Strong supply base: The extensive grey zone below marks a "stronger supply zone" — this could cap any modest bounce and keep the downtrend intact.
🔍 Interpretation:
Bias: Bearish — sellers have taken control after a failed breakout.
Strategy: Short on rallies toward the mid‑green/red box (~3,373–3,380), targeting ~3,347 first and then ~3,319. Watch for support at the strong supply region (~3,292) for potential reversal or consolidation.
Risk management: Keep stop above the red zone—above recent highs (~3,380+) to limit risk.
🚀 In a nutshell: After failing to break supply and losing its short‑term uptrend, gold appears poised for a pullback. The next key levels to watch are ~3,347 and ~3,319—where buyers might step back in, or the downtrend continues toward the deeper supply base.

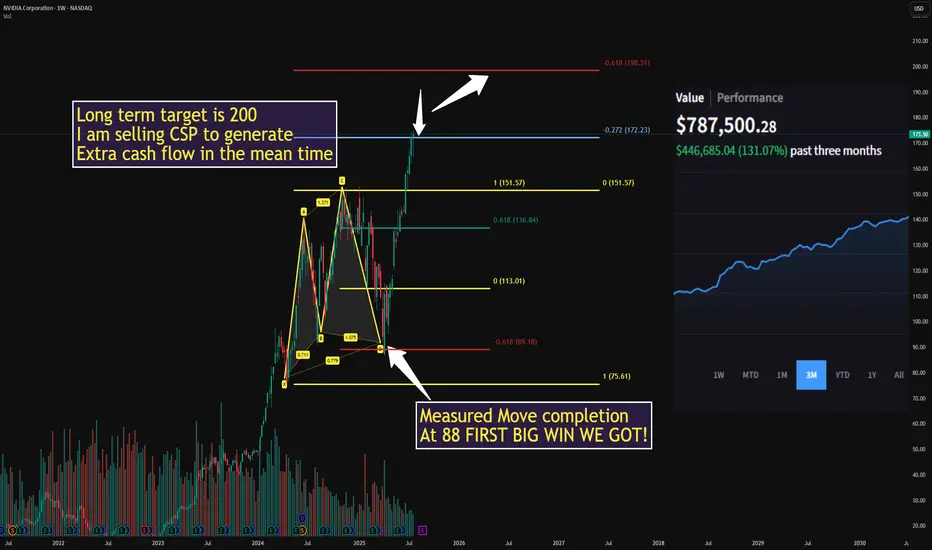
$NVDA ONCE IN A LIFETIME from 88 to 174 BOOM!WE crushed it using the 618 measured move from 88 to 174 in April
Next target is 200 and I am waiting for a decent pull back
In the mean time I will sell puts to generate cash flow, I will alert my next buy here
NO CHARGE all I ask is drop a LIKE
CHECK USDJPY SIGNAL UPDATE GO AND READ THE CAPTAINEntry Point: Around 147.750 TO 147.650
Take Profit 1: 147.200
Take Profit 2: 146.650
Last Target: 146.050
Stop Loss: 148.250

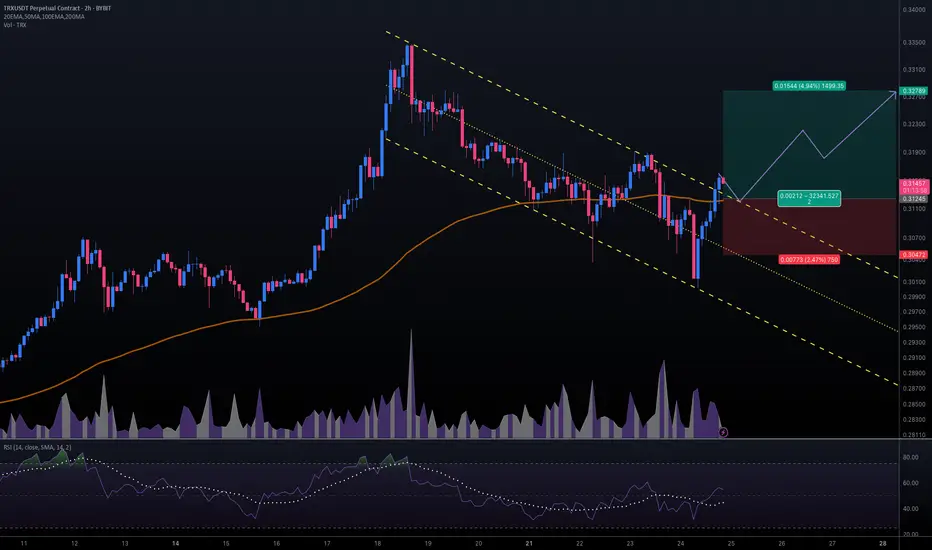
#TRXUSDT #2h (ByBit) Descending channel breakout and retestTron just regained 100EMA support and seems ready for bullish continuation after a pullback to it.
⚡️⚡️ #TRX/USDT ⚡️⚡️
Exchanges: ByBit USDT
Signal Type: Regular (Long)
Leverage: Isolated (16.0X)
Amount: 5.1%
Entry Targets:
1) 0.31245
Take-Profit Targets:
1) 0.32789
Stop Targets:
1) 0.30472
Published By: @Zblaba
CRYPTOCAP:TRX BYBIT:TRXUSDT.P #2h #TRON #DPoS #L1 #Web3 trondao.org tron.network
Risk/Reward= 1:2.0
Expected Profit= +79.1%
Possible Loss= -39.6%
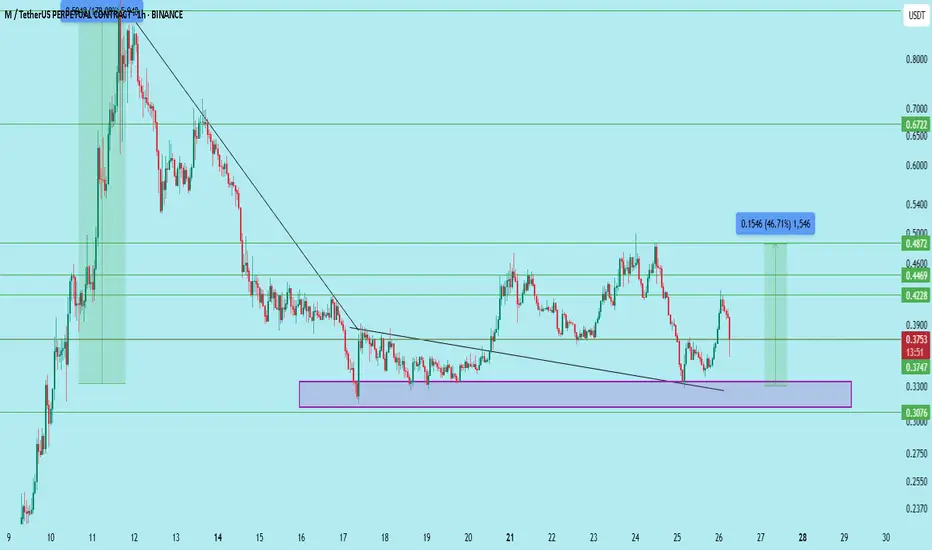
M/USDT — Demand Zone Retest with Strong Risk-Reward$M/USDT is retesting a significant demand zone (0.3210–0.3352) after a breakout and prior rally. This level previously sparked a major impulse move, and price has respected it again on the recent pullback.
Trade Setup
Entry: 0.330–0.345 (highlighted rectangle)
Stop Loss: Below 0.3076
Targets: 0.3747, 0.4228, 0.4469, 0.4872
Long-term Target: 0.6772
Structure
The setup offers nearly 46% upside to the first target and 100%+ to the long-term level. Retest and hold of the demand zone confirms bullish strength with a clean invalidation below 0.3076.
DYOR | Not Financial Advice
Litecoin is Lagging.Company held Litecoin is emerging, we're only getting started. Arriba.
P.S. ETF deadline on August 4th, 2025.
CRYPTOCAP:LTC $113.80

Cup & HANDLE + Mini Double Bottom: $TSLA to $610 ScenarioI maintain a bullish stance on Tesla ( NASDAQ:TSLA ), supported by a compelling combination of technical patterns and strong fundamental drivers. The current chart setup reveals a Cup and Handle formation complemented by a Mini Double Bottom, both of which are classic bullish continuation patterns. These suggest a potential breakout scenario that could drive NASDAQ:TSLA to $610 by year-end.
Technical Roadmap:
Gap Fill to $408: Anticipated earnings momentum, particularly from the Robotaxi segment, is likely to propel the stock to fill the previous gap at $408.
Consolidation at $450: Following the gap fill, I expect a consolidation phase forming a “box” around the $450 level.
Breakout to $610: A decisive breakout above $450 could trigger a strong rally toward the $610 target.
***Current Key Catalysts Supporting the Bullish Thesis:
Robotaxi Expansion: Tesla’s autonomous driving initiative is gaining traction, with Robotaxi developments expected to significantly boost revenue and margins.
India Market Entry: Tesla’s upcoming launch in India opens access to one of the world’s largest and fastest-growing EV markets.
In-House Chip Development & Dojo 2 Expansion: Continued investment in AI infrastructure and custom silicon enhances Tesla’s competitive edge in autonomy and robotics.
Tesla Diner Launch: The near-completion of Tesla’s themed diner adds to brand visibility and customer engagement.
Global EV Adoption: Tesla continues to benefit from rising EV demand across multiple international markets.
Optimus Robot Hype: Growing interest in Tesla’s humanoid robot project could unlock new revenue streams and investor enthusiasm.
Favorable Macro Trends: A declining interest rate environment supports higher valuations for growth stocks like Tesla.
Institutional Accumulation: Recent trading activity suggests that institutional investors are accumulating shares within the current range.
Grok AI Integration: The integration of Grok AI into Tesla vehicles could enhance user experience and differentiate Tesla’s infotainment ecosystem.
Investment Strategy:
I recommend initiating or increasing exposure to NASDAQ:TSLL (leveraged Tesla ETF) ahead of the upcoming earnings report. This could offer amplified returns if the bullish scenario plays out. Consider accumulating further on any dips, particularly during the consolidation phase around $450.
BUY NOW NASDAQ:TSLA NASDAQ:TSLL

LTC vs ETH : Bottom ? Hello:
Good ? me no or yes.
ETH vs LTC.
Eth is good but LTC ? LTC is a giant which sleep.
The chart show us a possible H&S pattern inverted.
My view is something like it.
If you want be safe, enter when red line is break.
GL

Ethereum is likely to retrace before continuing its bullish moveEthereum's technicals are highly bullish, supported by strong fundamentals. According to the market structure, it may retrace to the level shown in the chart above to collect liquidity and fill orders before moving forward to All time high near 4800.

Bitcoin’s Battle at Resistance Watch These Critical Levels.Bitcoin is currently forming an AMD (Accumulation–Manipulation–Distribution) pattern.
The market recently dipped due to manipulation, only to push back up and break through a key resistance level, moving toward the inversion zone. However, it now faces additional resistance from a descending trendline.
If the market decisively breaks above this trendline and successfully retests it, there is potential for further upward movement.
Keep a close watch on these critical levels for confirmation.
Do Your Own Research (DYOR)

SAHARA/USDT - 2nd buy setup has already delivered a strong +100% move from the initial buy setup. Currently, the price is retesting the previous resistance level, which is now flipping into a strong base support — a classic bullish retest. This zone also acted as the breakout point for the recent parabolic leg, indicating strong interest from buyers. A green box has been marked for the next potential entry, anticipating the continuation of the bullish trend. If the support holds, the next leg could lead to another explosive move upward.

2025 BTC.D to %44 then retrace to %56 - 2026 real Altseasonthe drop in bitcoin dominance from now till end on August to %44 will send some Alts 5 to 10 X then all the market will dump till the end of the year and the dump will be brutal
Brutal means : bitcoin down %65 and altcoins %90 from the upcoming August mini Altseason run. which actually Alts prices will be cheaper than now ( today )
eventually BTC.D going down to %20
Not a financial advice

Bitcoin on the edge – Is a sharp drop coming?Bitcoin is keeping investors on edge as price action remains volatile and primed for an explosive move once news or capital flows ignite the market.
🌍 Latest market updates:
– Whales are back in accumulation mode, with on-chain data showing large wallets growing rapidly.
– The U.S. government has just transferred a significant amount of BTC to exchanges — is a dump coming?
– U.S. spot Bitcoin ETFs are witnessing record inflows after CPI came in lower than expected, fueling hopes that the Fed will pause further rate hikes this year.
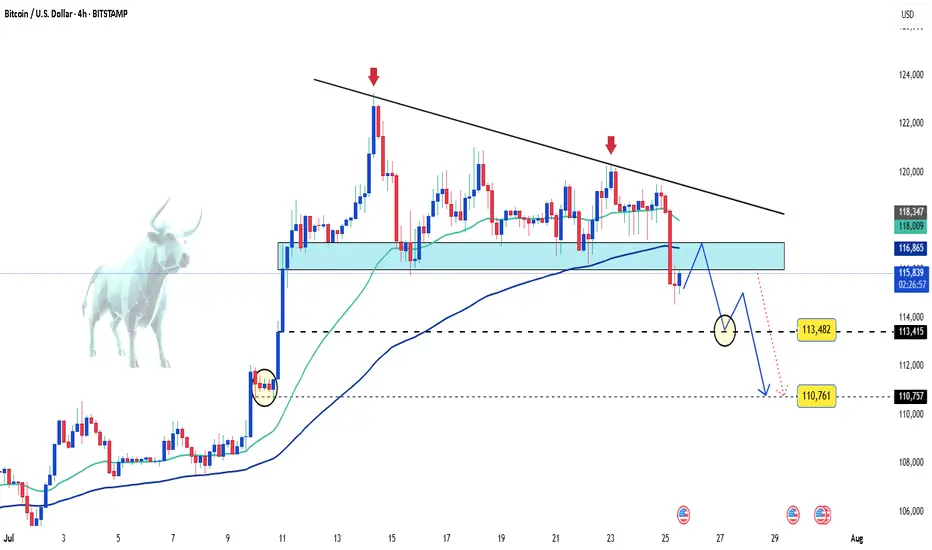
📉 Technical outlook:
– On the H4 chart, BTC formed a tightening wedge pattern, which has now broken to the downside.
– A steep drop toward the 113,000 to 110,000 USD zone is entirely possible.
This looks like a classic break-retest setup — a golden window for strategic entries. If sell volume surges, it could be the perfect moment for bears to strike.
Stay sharp — and good luck!
BTCUSDT: Trend in daily time frameThe color levels are very accurate levels of support and resistance in different time frames.
A strong move requires a correction to major support and we have to wait for their reaction in these areas.
So, Please pay special attention to the very accurate trend, colored levels, and you must know that SETUP is very sensitive.
BEST,
MT

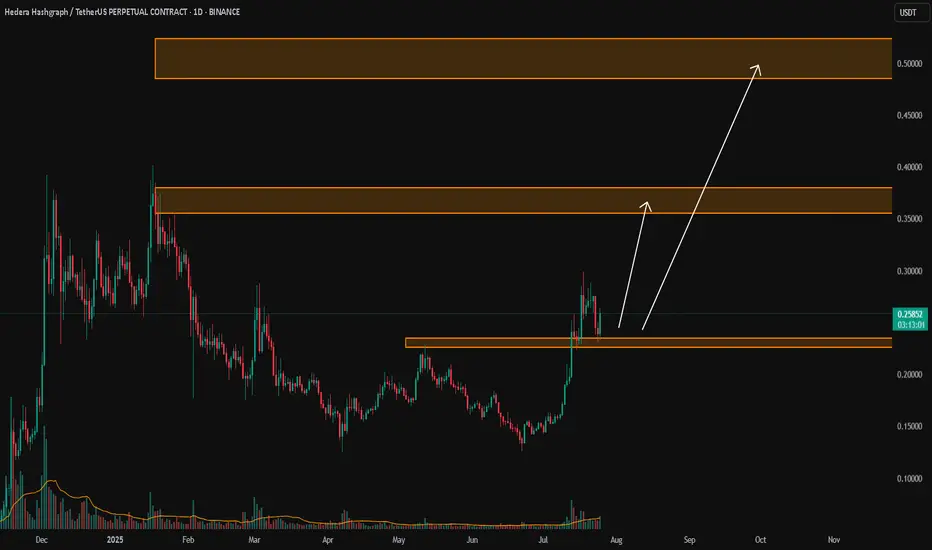
HBAR/USDTKey Level Zone: 0.22600 - 0.23500
LMT v2.0 detected.
The setup looks promising—price previously trended upward with rising volume and momentum, then retested this zone cleanly. This presents an excellent reward-to-risk opportunity if momentum continues to align.
Introducing LMT (Levels & Momentum Trading)
- Over the past 3 years, I’ve refined my approach to focus more sharply on the single most important element in any trade: the KEY LEVEL.
- While HMT (High Momentum Trading) served me well—combining trend, momentum, volume, and structure across multiple timeframes—I realized that consistently identifying and respecting these critical price zones is what truly separates good trades from great ones.
- That insight led to the evolution of HMT into LMT – Levels & Momentum Trading.
Why the Change? (From HMT to LMT)
Switching from High Momentum Trading (HMT) to Levels & Momentum Trading (LMT) improves precision, risk control, and confidence by:
- Clearer Entries & Stops: Defined key levels make it easier to plan entries, stop-losses, and position sizing—no more guesswork.
- Better Signal Quality: Momentum is now always checked against a support or resistance zone—if it aligns, it's a stronger setup.
- Improved Reward-to-Risk: All trades are anchored to key levels, making it easier to calculate and manage risk effectively.
- Stronger Confidence: With clear invalidation points beyond key levels, it's easier to trust the plan and stay disciplined—even in tough markets.
Whenever I share a signal, it’s because:
- A high‐probability key level has been identified on a higher timeframe.
- Lower‐timeframe momentum, market structure and volume suggest continuation or reversal is imminent.
- The reward‐to‐risk (based on that key level) meets my criteria for a disciplined entry.
***Please note that conducting a comprehensive analysis on a single timeframe chart can be quite challenging and sometimes confusing. I appreciate your understanding of the effort involved.
Important Note: The Role of Key Levels
- Holding a key level zone: If price respects the key level zone, momentum often carries the trend in the expected direction. That’s when we look to enter, with stop-loss placed just beyond the zone with some buffer.
- Breaking a key level zone: A definitive break signals a potential stop‐out for trend traders. For reversal traders, it’s a cue to consider switching direction—price often retests broken zones as new support or resistance.
My Trading Rules (Unchanged)
Risk Management
- Maximum risk per trade: 2.5%
- Leverage: 5x
Exit Strategy / Profit Taking
- Sell at least 70% on the 3rd wave up (LTF Wave 5).
- Typically sell 50% during a high‐volume spike.
- Move stop‐loss to breakeven once the trade achieves a 1.5:1 R:R.
- Exit at breakeven if momentum fades or divergence appears.
The market is highly dynamic and constantly changing. LMT signals and target profit (TP) levels are based on the current price and movement, but market conditions can shift instantly, so it is crucial to remain adaptable and follow the market's movement.
If you find this signal/analysis meaningful, kindly like and share it.
Thank you for your support~
Sharing this with love!
From HMT to LMT: A Brief Version History
HM Signal :
Date: 17/08/2023
- Early concept identifying high momentum pullbacks within strong uptrends
- Triggered after a prior wave up with rising volume and momentum
- Focused on healthy retracements into support for optimal reward-to-risk setups
HMT v1.0:
Date: 18/10/2024
- Initial release of the High Momentum Trading framework
- Combined multi-timeframe trend, volume, and momentum analysis.
- Focused on identifying strong trending moves high momentum
HMT v2.0:
Date: 17/12/2024
- Major update to the Momentum indicator
- Reduced false signals from inaccurate momentum detection
- New screener with improved accuracy and fewer signals
HMT v3.0:
Date: 23/12/2024
- Added liquidity factor to enhance trend continuation
- Improved potential for momentum-based plays
- Increased winning probability by reducing entries during peaks
HMT v3.1:
Date: 31/12/2024
- Enhanced entry confirmation for improved reward-to-risk ratios
HMT v4.0:
Date: 05/01/2025
- Incorporated buying and selling pressure in lower timeframes to enhance the probability of trending moves while optimizing entry timing and scaling
HMT v4.1:
Date: 06/01/2025
- Enhanced take-profit (TP) target by incorporating market structure analysis
HMT v5 :
Date: 23/01/2025
- Refined wave analysis for trending conditions
- Incorporated lower timeframe (LTF) momentum to strengthen trend reliability
- Re-aligned and re-balanced entry conditions for improved accuracy
HMT v6 :
Date : 15/02/2025
- Integrated strong accumulation activity into in-depth wave analysis
HMT v7 :
Date : 20/03/2025
- Refined wave analysis along with accumulation and market sentiment
HMT v8 :
Date : 16/04/2025
- Fully restructured strategy logic
HMT v8.1 :
Date : 18/04/2025
- Refined Take Profit (TP) logic to be more conservative for improved win consistency
LMT v1.0 :
Date : 06/06/2025
- Rebranded to emphasize key levels + momentum as the core framework
LMT v2.0
Date: 11/06/2025
- Fully restructured lower timeframe (LTF) momentum logic
Nasdaq Short: Completion of 5 waves with wave 5=wave 1Over here, I present a short case for Nasdaq (and S&P500 by default since their correlations are high). The main reasons are:
1. Completion of 5 waves structure both on the high degree and on low degree, as shown in the chart.
2. Fibonacci measurement where wave 1 = wave 5.
The stop of this idea is to be placed slightly above the high, in this case, I placed it at around 23320. The take profit target is at the bottom of primary wave 4, around 20685.
Take note that this is a positional short, meaning the strategy is to short and hold and periodically adjust your stop loss based on unfolding on wave structure. Sizing is based on your risk tolerance.
Good luck!

BITCOIN Ready to Pump - 1H Buy Setup Active!💚 BTC/USDT Bullish Breakout Setup ! Entry Activated!
👨💻 Dear traders,
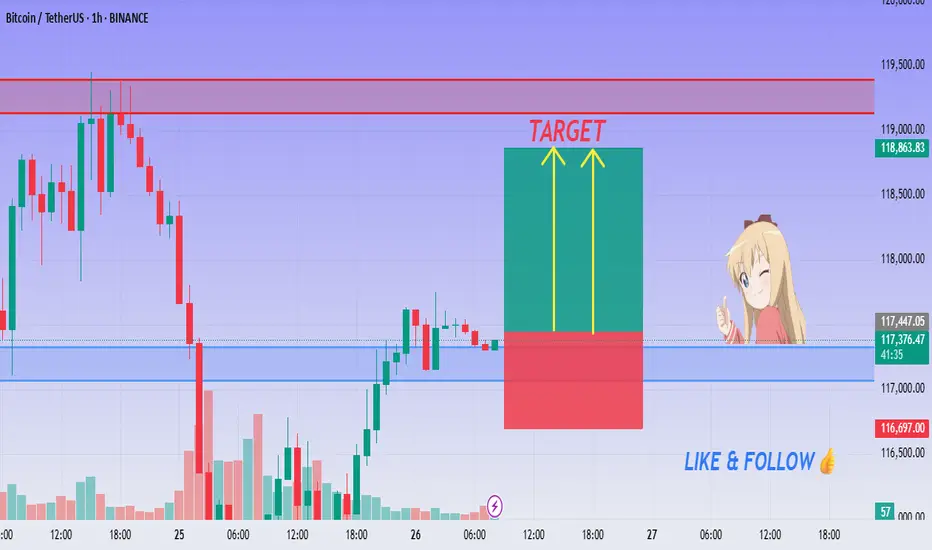
BTC/USDT is showing a sharp rebound from a temporary base structure near $116,500, forming strong bullish momentum on the 1H timeframe. The breakout above local resistance signals the possibility of an impulsive move toward higher levels.
Bias – Bullish (Intraday)
🎯 Target 1 – $118,800
🎯 Target 2 – $119,200
🎯 Final Target – $119,500
🛑 Stop Loss – $116,500
📊 Reasoning:
– Clean bounce from previous structure support
– Bullish engulfing confirms short-term reversal
– Green zone = reward area, red = safe SL zone
– Two yellow arrows project upside momentum
– Strong volume spike during reversal
– R:R favors long scalpers and intraday swing
⚡ Stay disciplined. Let price confirm the zone and follow the momentum!
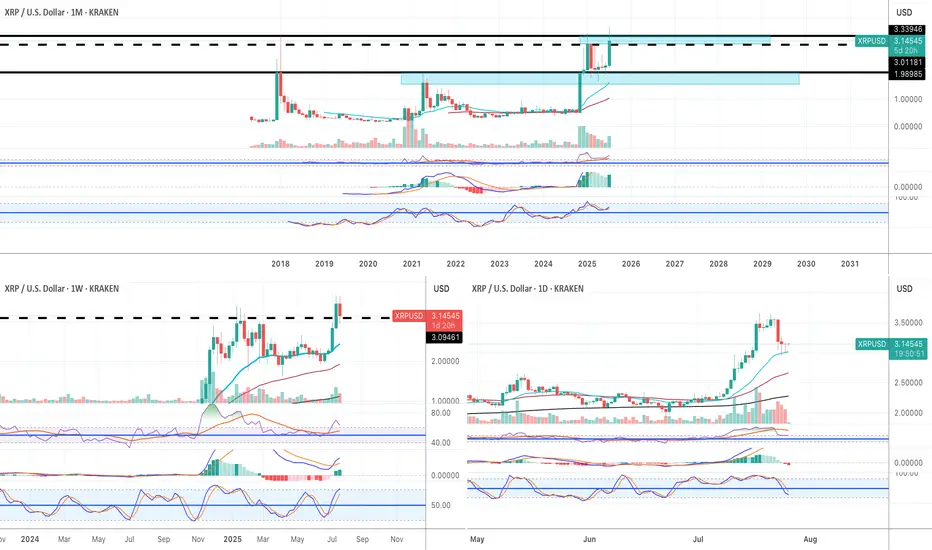
Super bullish!! (I am not a XRP fan, but still) XRP is one of those cryptocurrencies that attract cult-like followers. I am not one of them.
Fundamentally I have no idea about the long term potential of XRP. HOWEVER, purely based on technicaly analysis, it looks very bullish to me.
Monthly:
1) the price finally broke above the 2018 historical ATH.
2) All momentum indicators in the bull zone.
3) Both RSI and MACD are in the overbought territory but they can remain in the OB territory for weeks and weeks when the macro bull trend begins.
4) Stochastic lines have crossed to the upside in the bull zone.
Weekly:
1) all momentum indicators are in the bull zone.
2) The price broke above the historical ATH. It is going through pull back now, but, there is a strong buying pressure around $3.15.
Daily:
1) all momentum indicators have reached the overbought territory. The lines are now rolled to the downside, however, it is likely to be a corrective move.
2) the price is hovering above EMA21 where the recent price breakout happened on Thurs 17th July. I have been monitoring price action in lower time frames such as 5 and 15 minutes, and it looks like the price does not want to go below the previous historical high at this stage.
I am not very familiar with XRP, but purely based on the current price action, it looks very bullish. For the very first time as a trader/investor, I deployed my capital to buy XRP last Wed (just under $3.00).
I have already took some profit when it hit $3.60. But I am planning to sell 90% of my XRP when it reaches $4.50 and $5.00, and let the rest run just in case it goes to the moon😅.
Heiken Ashi CandlesThis week Heiken Ashi candle gave a bullish close above the DOJI Heiken Ashi candle from last week. RSI is above 50. MACD (Chris Moody) look like it may have a bullish cross over soon. Stochastic RSI is getting ready to curl up. What do you think team? do you think the bulls maybe entering their season? Next few days are going to be interesting. If the buyers and investors can maintain the parallel structure the asset will go bullish however if it breaks it, the bears will celebrate. Keep your eyes on the Fibonacci levels, bulls want to see movement toward 14.54 and out of the Fibonacci golden zone.
