BTC Consolidates Below 119,300 Over the Weekend💎 BTC WEEKEND PLAN UPDATE (26/07)
NOTABLE BTC NEWS
The cryptocurrency market is attempting to stabilize after a wave of sell-offs during Friday’s Asian session, when Bitcoin (BTC) dropped to an intraday low of $114,723. A recovery trend is gradually strengthening, with BTC trading at $115,868 at the time of writing, indicating that buying interest at lower levels may increase in upcoming sessions.
TECHNICAL ANALYSIS PERSPECTIVE
Symmetrical Triangle Pattern
BTC is currently fluctuating within a symmetrical triangle pattern, with converging upper and lower trendlines. This pattern typically signals a strong consolidation phase before a decisive breakout.
Scenario unfolded as planned:
• The price failed to break the resistance zone around $120,000 (previously forecasted as a likely failed breakout zone).
• BTC then dropped sharply to the support zone around $115,000, touching the lower trendline and the potential breakout zone.
• At this level, the price rebounded as expected, indicating strong buying pressure at support.
MA lines supporting the trend:
• The price is currently moving around the 200-day MA (red line), showing that the dynamic support is working effectively.
• The 50-day MA (yellow line) is acting as short-term resistance. If broken, it could support the recovery momentum.
Two potential upcoming scenarios:
🔼 If BTC breaks above the $119,500 – $120,000 zone with strong volume, it may continue to test higher levels around $123,000 – $125,000.
🔽 Conversely, if it faces strong rejection around $119K and turns downward, BTC may retest the support zone at $114,000 – $115,000 once again.
Stay tuned to the channel for the latest and continuous updates on XAUUSD, CURRENCIES, and BTC.
Trend Analysis

NEWT/USDT -Wave 3 NEWT/USDT is displaying a super bullish structure with a textbook wave formation. After completing its first impulsive leg (Wave 1) the price entered a healthy correction phase lasting over 25 days retracing approximately 50% a classic Wave 2 retracement.
The recent strong up move marks the beginning of Sub-Wave 1 of the larger Wave 3, which is often the most explosive part of the cycle. Currently, price is stabilizing and holding key levels that NEWT is preparing to complete the full Wave 3 expansion with strong bullish momentum ahead.

USOIL My Opinion! BUY!
My dear friends,
Please, find my technical outlook for USOIL below:
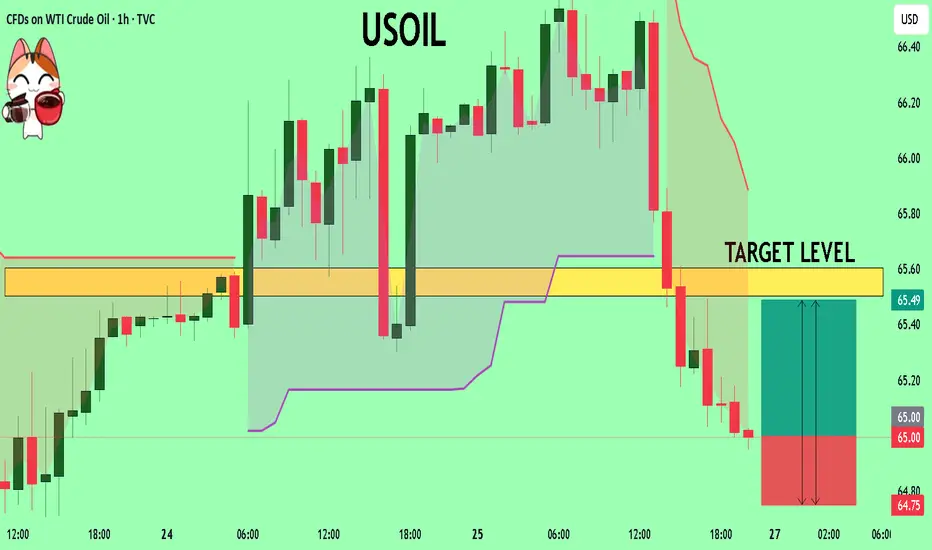
The instrument tests an important psychological level 65.00
Bias - Bullish
Technical Indicators: Supper Trend gives a precise Bullish signal, while Pivot Point HL predicts price changes and potential reversals in the market.
Target - 65.50
Recommended Stop Loss - 64.75
About Used Indicators:
Super-trend indicator is more useful in trending markets where there are clear uptrends and downtrends in price.
Disclosure: I am part of Trade Nation's Influencer program and receive a monthly fee for using their TradingView charts in my analysis.
———————————
WISH YOU ALL LUCK
BTCUSD BUBBLE ABOUT TO BURST LOL ??? SELL SELL SELLLong term BTCUSD looks like BIG PLAYERS ARE TAKING PROFIT (about to dump this to retailers lol)
I see 15m signal sell with very good risk reward
BTCUSD its ready for correction i dont beleave we will see any NEW HIGHS from here
Let see how will pay out, only time will tell
Thanks

American Exceptionalism - The End of an Era "The Eagle and the Fall"
O say can you see, from the towers so high,
A gleam in the steel and a spark in the sky?
The factories roared and the railways sang,
And liberty’s bell through the cities rang.
We rose from the soil, rough-handed and proud,
With faith forged in steel and heads unbowed.
The eagle soared on ambition's flame,
Each man in his dream, each street with a name.
From sea unto sea, we built and we bought,
In ticker tape winds, prosperity caught.
The market climbed like a hymn on the air—
A temple of glass, reflecting a prayer.
But greed wore a mask and danced in disguise,
A siren’s whisper in financier’s eyes.
And credit, like wine, flowed too freely at last,
While whispers of worry were buried in glass.
October arrived like a thief in the mist,
And struck with a silence too brutal to miss.
A breath, then a cry, then a plunge in the floor—
The numbers all bleeding, the dream no more.
Yet still in the ruins, beneath ash and flame,
Burned a stubborn belief in America’s name.
For even when mountains of fortune did crash,
The stars and the stripes held fast through the ash.
O nation of daring, of promise and pain,
You rise not once, but again and again.
Through boom and through bust, your story is spun—
A land still unfinished, still chasing the sun.

Ethereum (ETH) AnalysisEthereum (ETH), the second-largest cryptocurrency by market capitalization, continues to be a pivotal asset in the digital economy, driving the decentralized finance (DeFi), NFT, and Web3 ecosystems. Its price action is influenced by a combination of its own fundamental developments, the broader cryptocurrency market sentiment (primarily Bitcoin's movements), and macroeconomic factors.
1. Fundamental Strengths & Developments:
Ecosystem Growth: Ethereum boasts the largest and most vibrant ecosystem of decentralized applications (dApps). The majority of DeFi protocols, NFT marketplaces, and Web3 infrastructure are built on or heavily integrated with Ethereum. This network effect provides strong underlying demand for ETH as gas fees and collateral.
Scalability Progress (Ethereum 2.0 / Serenity): The ongoing transition to Ethereum 2.0 (now largely referred to as "Serenity" or simply "The Merge" and subsequent upgrades) is a critical long-term bullish factor.
The Merge (completed): The successful transition to Proof-of-Stake (PoS) in September 2022 drastically reduced Ethereum's energy consumption and introduced ETH staking rewards, making it a more environmentally friendly and yield-generating asset.
Shanghai/Capella Upgrade (completed): This enabled staked ETH withdrawals, reducing a major liquidity concern for stakers and attracting more participation in the staking mechanism.
Upcoming Upgrades (e.g., Danksharding, Proto-Danksharding): Future upgrades are focused on increasing scalability and throughput through sharding, which is crucial for lowering transaction costs (gas fees) and enhancing network capacity. Progress on these fronts generally bodes well for ETH's long-term value.
Deflationary Mechanism: EIP-1559, implemented in August 2021, introduced a mechanism to burn a portion of transaction fees. Coupled with staking, this can lead to a net deflationary supply of ETH during periods of high network activity, reducing circulating supply and potentially increasing value.
2. Price Action and Technical Considerations (General Outlook):
Correlation with Bitcoin (BTC): ETH's price often highly correlates with Bitcoin. A strong bullish trend in BTC typically pulls ETH higher, while a significant BTC correction usually leads to ETH declines. Observing BTC's technical structure (support, resistance, momentum) is crucial for predicting ETH's near-term movements.
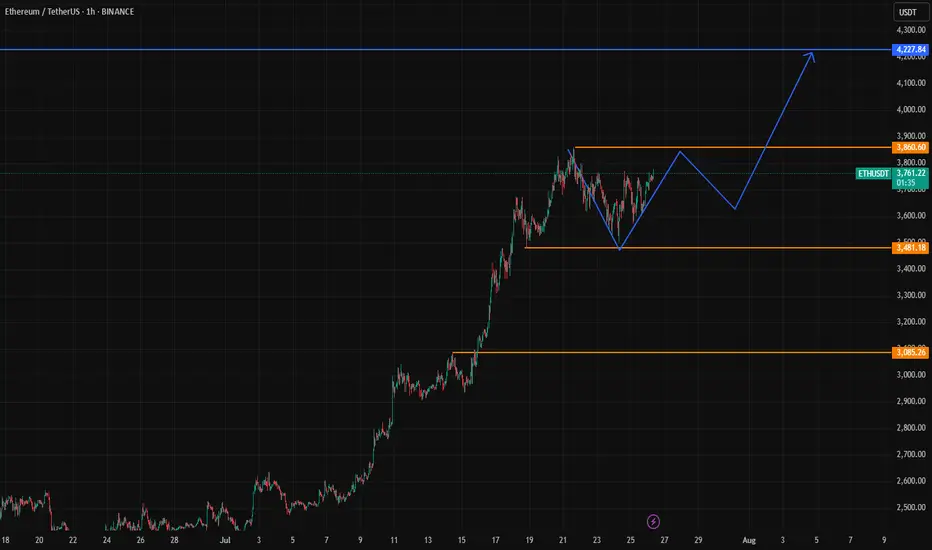
Key Price Levels:
Support: Historically significant support levels often exist around previous highs or strong accumulation zones. These levels act as price floors where buying interest tends to emerge.
Resistance: Previous all-time highs or significant resistance zones (where selling pressure has historically been strong) act as ceilings. A decisive break above these levels, especially with high volume, can signal a continuation of an uptrend.
Market Cycles: Cryptocurrencies are highly cyclical. After periods of rapid price appreciation, consolidation or correction phases are common. These periods allow the market to digest gains, reset funding rates, and build new bases for future moves.
3. Macroeconomic and Regulatory Factors:
Interest Rates and Inflation: Higher interest rates and tighter monetary policies from central banks can reduce liquidity in financial markets, impacting risk assets like cryptocurrencies. Conversely, a more dovish stance can be supportive.
Regulatory Environment: Clarity or uncertainty from regulators (e.g., SEC in the US, MiCA in Europe) can significantly influence institutional adoption and overall market sentiment. Positive regulatory developments can instill confidence, while restrictive measures can cause FUD (Fear, Uncertainty, Doubt).
Global Economic Health: A robust global economy generally fosters a risk-on environment, which is favorable for crypto. Economic slowdowns or recessions can lead to risk aversion.
Outlook:
Ethereum remains a strong long-term investment given its foundational role in the decentralized web and its continuous technological advancements. The successful transition to PoS and ongoing scalability efforts are critical drivers.
Bullish Scenario: If the broader crypto market remains strong, Bitcoin maintains its uptrend, and Ethereum continues to deliver on its roadmap (e.g., successful sharding implementations), ETH could target new all-time highs. Increased institutional interest, ETF approvals (for ETH directly or indirectly), and sustained DeFi/NFT activity would further fuel this.
Bearish Scenario: Significant macroeconomic headwinds, a prolonged downturn in Bitcoin's price, major regulatory crackdowns, or unforeseen technical issues with Ethereum's upgrades could lead to a correction.
Conclusion:
Ethereum's value proposition is robust due to its vibrant ecosystem and relentless development. While short-term price movements will be influenced by market sentiment and macroeconomic factors, its long-term trajectory appears promising as it continues to solidify its position as the backbone of the decentralized future. Investors should closely monitor Bitcoin's price action, Ethereum's development milestones, and broader economic indicators.

GBPUSD Will Go Higher! Long!
Take a look at our analysis for GBPUSD.
Time Frame: 4h
Current Trend: Bullish
Sentiment: Oversold (based on 7-period RSI)
Forecast: Bullish
The market is approaching a key horizontal level 1.344.
Considering the today's price action, probabilities will be high to see a movement to 1.351.
P.S
Please, note that an oversold/overbought condition can last for a long time, and therefore being oversold/overbought doesn't mean a price rally will come soon, or at all.
Disclosure: I am part of Trade Nation's Influencer program and receive a monthly fee for using their TradingView charts in my analysis.
Like and subscribe and comment my ideas if you enjoy them!

AB Capital - Closed above all time high and consolidationAB Capital
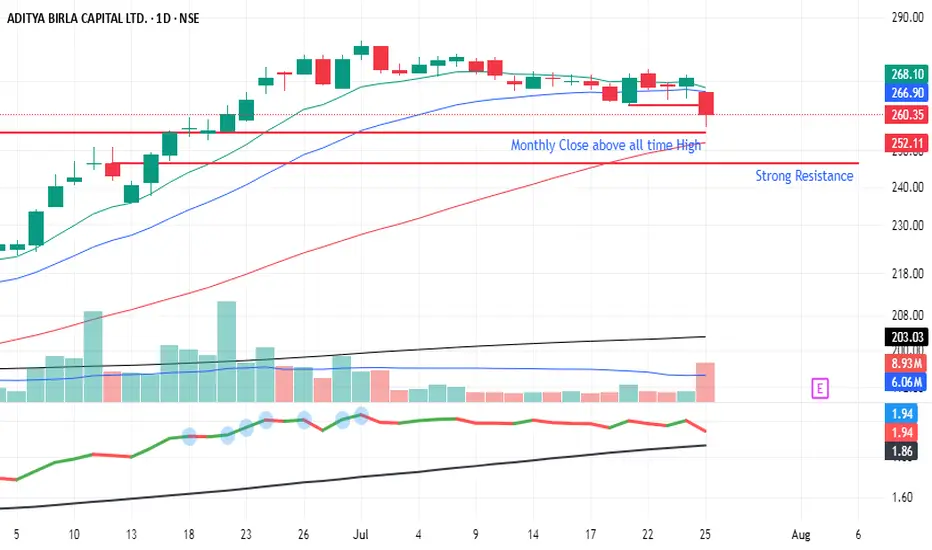
After closing above-time high of Rs. 255 in June 2025, the stock has entered a consolidation phase over the past month.
Key observations:
Support Zone: The 246-255 range is expected to provide strong support.
Trading Plan: Look for buying opportunities near the support zone (246-250) with a target of 280 and above.
A sustained move above 260 could lead to further upside.
This analysis is based on technical indicators and chart patterns. Always use proper risk management techniques and consider multiple perspectives before making trading decisions.
Trend Exhaustion Detected – Bearish Structure AheadUS100 (NASDAQ) 30-minute chart as of July 26, 2025, with technical insights based on the visible elements.
🔍 1. Trend Analysis
Primary Trend: Uptrend (bullish structure)
The price has been respecting a rising parallel channel, marked by:
Ascending support (lower boundary)
Ascending resistance (upper boundary)
Market structure shows:
Higher Highs (HH)
Higher Lows (HL)
✅ This indicates continuation of bullish momentum until structure breaks.
📐 2. Market Structure Elements
Structure Type Label on Chart Price Zone (approx.)
Break of Structure (BOS) BOS (center-left) ~22,950
Higher Low (HL) HL (2x) ~22,700 (1st), ~23,050 (2nd)
Higher High (HH) HH (2x) ~23,150 and ~23,300
Resistance Labelled ~23,300–23,320
Demand Zones Labelled ~22,450–22,700
🔁 Break of Structure (BOS)
The BOS occurred after a prior swing low was broken, followed by a new higher high, confirming a bullish shift.
🧱 3. Support / Resistance Analysis
🔼 Resistance Zone
The price is testing strong resistance around 23,300–23,320
Multiple rejections in this area
Trendline resistance also aligns here
A rejection arrow is drawn, indicating potential bearish reaction
🔽 Support Zone (Immediate)
23,180–23,220: highlighted green box is a local support block
If broken, likely to revisit 23,000–23,050, or even down to 22,900 range
🟩 4. Demand Zones
Zone 1:
22,450–22,600: Strong bullish reaction historically — likely to act as a key demand if a deeper pullback occurs
Zone 2:
22,850–22,950: Validated with prior accumulation & BOS event
🧠 5. Key Observations
Price is at a critical inflection zone:
Testing a resistance zone
At the upper trendline of an ascending channel
A bearish reaction is projected (black arrow)
Possibly targeting the green support zone around 23,180–23,220
If that fails, demand at ~23,000 will likely be tested
Ichimoku Cloud:
Currently price is above the cloud → still bullish
Cloud is thin → potential weakness or upcoming consolidation
⚠️ 6. Trading Bias & Setup Ideas
✅ Bullish Bias (if price holds above ~23,180)
Long entries can be considered on bullish reaction from support
Target: retest of 23,300–23,350 or even breakout continuation
❌ Bearish Bias (if breakdown below support)
Short entry valid below 23,180 with:
TP1: 23,050
TP2: 22,900
A breakdown from the ascending channel would signal trend exhaustion
🔚 Conclusion
Current Price: 23,298.4
Trend: Bullish, but at resistance
Next move: Watch for reaction at resistance and support box below
Bias: Neutral-to-bullish unless the structure breaks below ~23,180

SUI/USDT Massive Cup and Handle Pattern Unfolding Is a Breakout?🧠 Technical Overview:
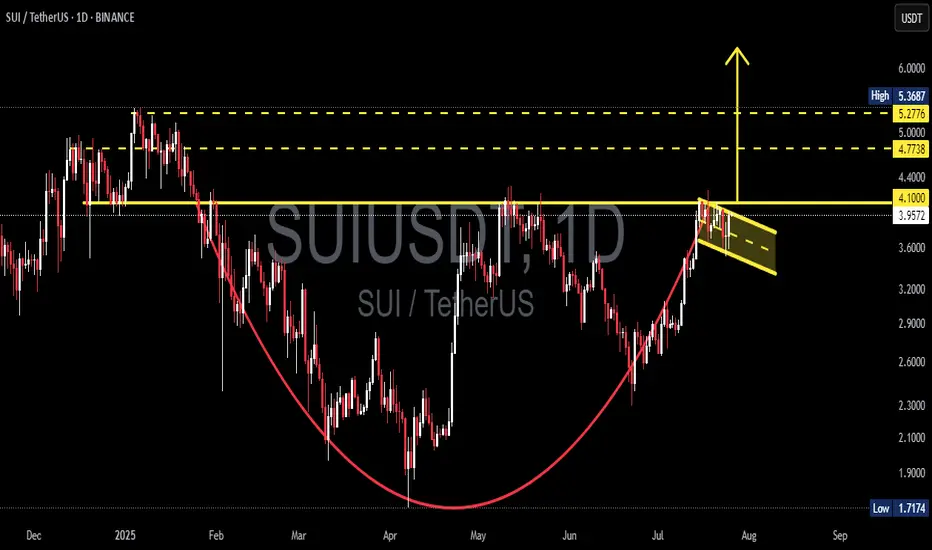
The daily chart of SUI/USDT showcases a textbook formation of the Cup and Handle pattern — a powerful bullish continuation signal that often precedes explosive upside moves.
The “Cup” took shape between January and July 2025, reflecting a deep rounding bottom. This indicates a long-term accumulation phase where bears gradually lose control.
The “Handle” is currently forming as a downward-sloping consolidation channel, often known as a bullish flag, which is typically the final pause before a breakout.
🔍 Key Technical Levels:
Current Price: $3.9661
Support Zone: $3.96
Major Resistance Levels to Watch:
$4.10 (handle resistance & breakout trigger)
$4.40 (local structural high)
$4.77 (previous high & fib extension zone)
$5.00 (psychological level)
$5.36 (measured move target from cup breakout)
---
🟢 Bullish Scenario: Breakout Incoming
If price breaks and closes above the handle resistance around $4.10, backed by increasing volume:
This confirms the Cup and Handle breakout.
Expect a rapid move toward $4.77 – $5.36 in the short to mid term.
The height of the cup projected upward gives a target of approximately +35% gain from breakout point.
🔔 Watch for:
Bullish engulfing candles
Volume spike during breakout
Break of upper trendline from the handle
---
🔴 Bearish Scenario: Breakdown Risk
If the price fails to hold the $3.96 support and breaks down from the handle channel:
Price may retest lower support zones near $3.60 or even $3.20
However, as long as the cup’s base at ~$2.50 holds, the macro bullish structure remains valid.
⚠️ Invalidation: A daily close below $3.60 would invalidate the short-term bullish setup.
---
📊 Pattern Psychology:
The Cup and Handle pattern reflects investor accumulation, shakeout, and renewed confidence. This is often seen in strong uptrending markets — and the current structure suggests that bulls are quietly preparing for a potential breakout.
---
📅 Timing Outlook:
Handle formations typically last between 1–3 weeks. If this timeline holds, a breakout could occur before mid-August 2025.
---
✅ Conclusion:
The technical setup for SUI/USDT is extremely compelling. With a strong Cup and Handle pattern nearing completion, and key resistance just overhead, traders should prepare for potential breakout conditions. A confirmed move above $4.10 could trigger a bullish wave toward $5.00+.
📌 Set alerts. Manage risk. And don’t ignore the volume.
#SUI #SUIUSDT #CryptoBreakout #CupAndHandle #BullishSetup #CryptoChartPatterns #AltcoinAnalysis #TechnicalAnalysis #BreakoutTrade
BTCUSD has boken up Trendline and SupportBTCUSD has boken up Trendline and Support, It may retrace futhur before regaining bullishness.

Xrp - The final bullish breakout!💰Xrp ( CRYPTO:XRPUSD ) will create new all time highs:
🔎Analysis summary:
After a consolidation of an incredible seven years, Xrp is finally about to create new all time highs. With this monthly candle of +40%, bulls are totally taking over control, which means that an altcoin season is likely to happen. And the major winner will simply be our lovely coin of Xrp.
📝Levels to watch:
$3.0
🙏🏻#LONGTERMVISION
SwingTraderPhil

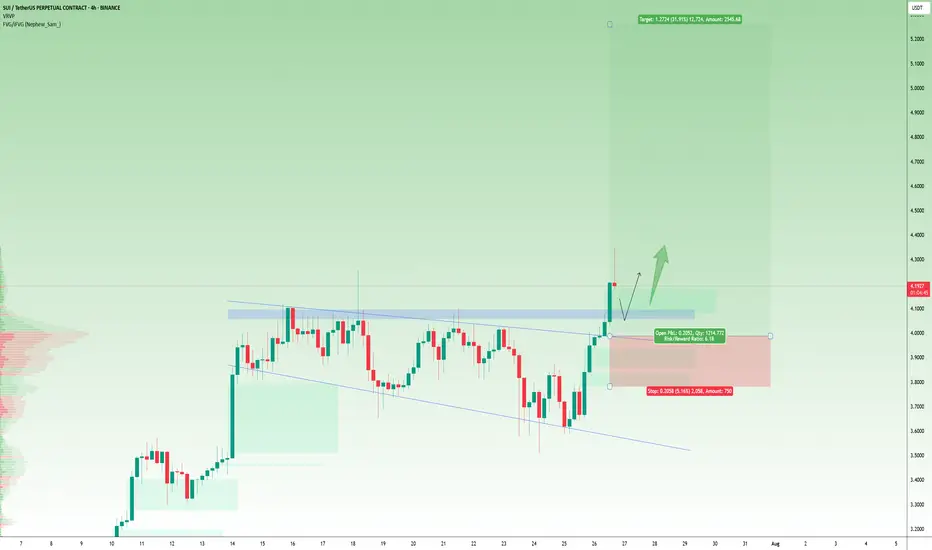
$SUI breaks out with strength!CRYPTOCAP:SUI breaks out with strength, now watching for retest!
SUI has broken above its consolidation range and key resistance zone.
Price is now pulling back slightly, and a retest of the breakout area around $4.00–$4.10 could offer a good continuation setup.
If this level holds, the next leg up toward $5.20–$5.30 is likely.
Breakdown below $3.95 would invalidate the breakout structure.
DYOR, NFA
#SUI #Altseason2025
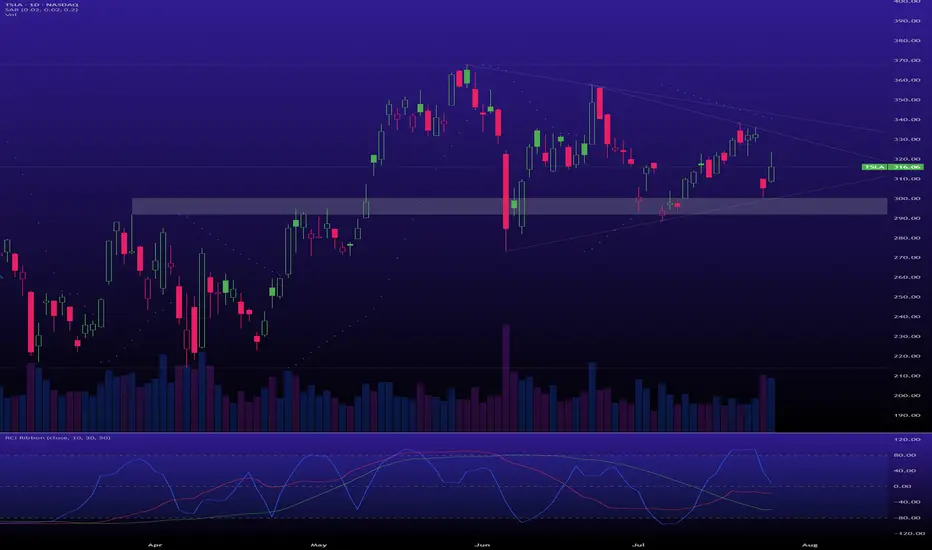
$TSLA is in an accumulation phase.A classic Wyckoff scenario is playing out, offering a prime opportunity if you have the nerve for it.
Support: The key support zone is $300 - $305. As long as this holds, the bullish thesis is intact.
Resistance: The primary target is the top of the multi-month accumulation range, around $370 - $380. A breakout above this would signal the start of a major new markup phase.
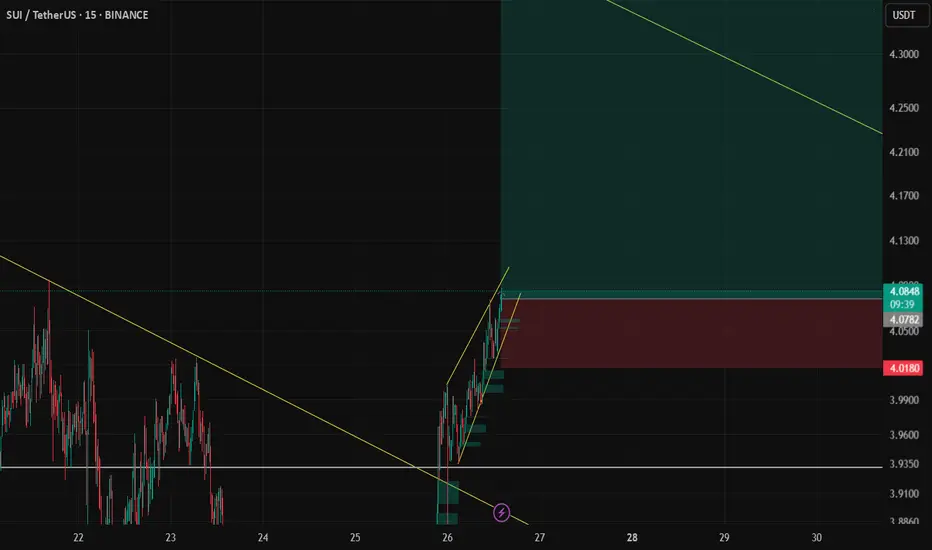
SUI 99 RR COULD IT BE???SUI 99 RR COULD IT BE??? - massive multiplier. Relative strength. Big time frame HVF. SUI Could be ready to pop.
XRP | Full AnalysisHere is the full analysis for CRYPTOCAP:XRP as requested 🫡
Let’s start with the weekly timeframe:
With the recent breakout above the $3.40 high, we’ve activated a new, larger bullish sequence on the weekly chart. This sequence has its target region between $6.57 and $7.84, which I believe we will reach at minimum during this bull run.
From now on, every pullback into the B-C correction area (turquoise) can be considered a legitimate re-entry opportunity.
Daily chart:
We successfully broke the all-time high with another breakout sequence (orange), which has already completed its target region.
Now, we’re trading the overall correction level — this is the same area as the B-C correction area from the weekly timeframe. It’s the Fibonacci retracement drawn from the start of the move to point C.
Local Price Action:
After reaching the target zone (orange), we activated a new bearish sequence in the upper region, which has just completed its target zone.
Now we expect a move back into the overall correction level (blue), and after that, according to the rulebook, the next legitimate U-turn could follow.
It gets really interesting if we enter the overall correction level and then start forming a bearish structure on the lower timeframes — this is where we can apply a multi-timeframe approach, which significantly increases the probability of a successful trade.
-----
Thats the my full Analysis for CRYPTOCAP:XRP , hope it was helpful if you want me to do another analysis for any other pair just comment down below.
Also, if anyone is interested in how my trading system works, let me know and I’ll post some educational content about it.
Thanks for reading❤️

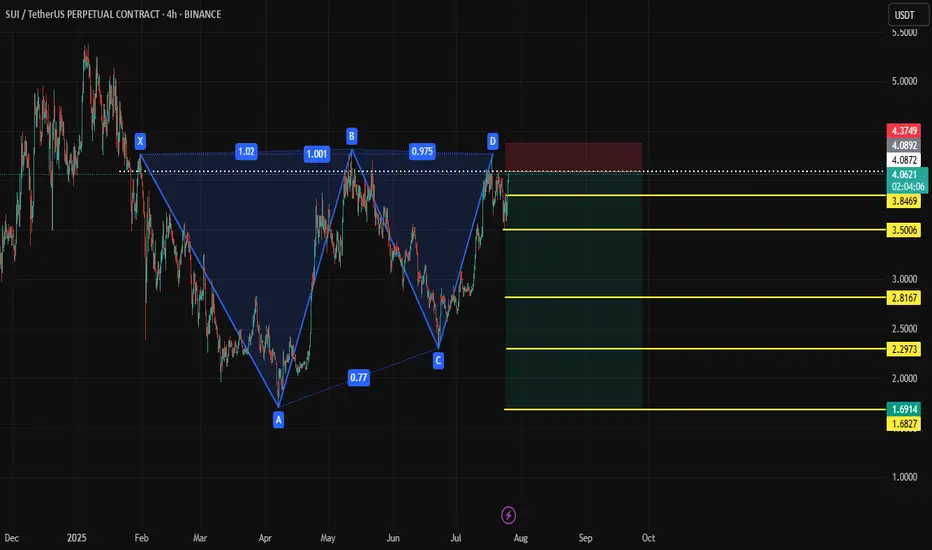
SUI Shortanalysis for sui bearish pattern
Short Entry: $4.10 – $4.20
Stop-Loss: $4.35+
Target 1: $3.60
Target 2: $3.10
Target 3 (Full XA move): ~$1.75 (aggressive)

6month log chart on xrpusd suggests crazy potential targetsThe bull pennant we are in shown here on the 6month time frame seems to have a symmetrical triangle for its flag. The breakout target for just the symmetrical triangle is in the $33 range. Factor in the pole of the flag and the potential target skyrockets to 1.2k. Definitely not financial advice and certainly no guarantee it will hit either target as it’s still up in the air if log chart targets reach their full target as reliably as linear chart patterns do. Even if it does hit these targets you can see the apex of the pennant in its current trendline trajectories doesn’t occur until 2026. The only way I see price remaining inside this triangle for that long is indeed if the SEC ripple case is extended through appeal and taken to the Supreme Court. Hopefully not but it isnt impossible. If this were to occur I would simply keep dollar cost average accumulating until it was to break out from the triangle which would give me more opportunity to take some profit at the first target but then also hold onto some of the asset in case it does indeed reach the full bullflag breakout somehow all the way up at 1.2k. Simply posting this hear so I can see how well price action chooses to follow this pattern over the next year or few. Once again *not financial advice*


$BANANA – Gift Below $30, Trend Reversal Confirmed
BINANCE:BANANAUSDT under $30 feels like a gift.
Starting to build here, and if price dips back into the purple zone, I’ll keep adding.
Monthly trend is active off the lows—this looks like a clear reversal. If it holds, I expect new highs over the next 5 months.
Not sure if $22 gets retested, but if it does, that’ll be a major area of interest.
Strong coin. Strong setup. Time to act.

Xvgusdt buy opportunity you don't want to miss!!!!Xvgusdt is currently trading within a potential ascending setup following a 5-leg drop, signaling a potential upward breakout.
We have identified a clear setup for potential accumulation and recommend establishing a stop loss level to manage risk in the event of a reversal.
Your engagement is valuable, so if you find this setup helpful, please consider liking the post and sharing your comments.
Thank you for your support.
