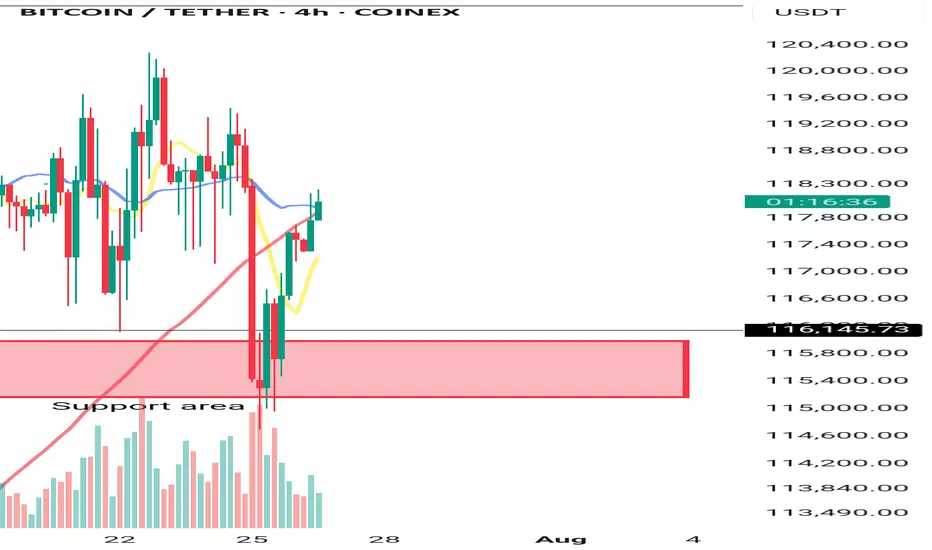
BTCUSD Breakdown Below 116,500 – Watching 61.8% Fib Retracement BTCUSD has broken down below the 116,500 level on the 4-hour timeframe. It’s best to wait for a potential sell entry near the 61.8% Fibonacci retracement of the last bullish wave. Stop-loss and take-profit levels are shown on the chart
Trend Analysis

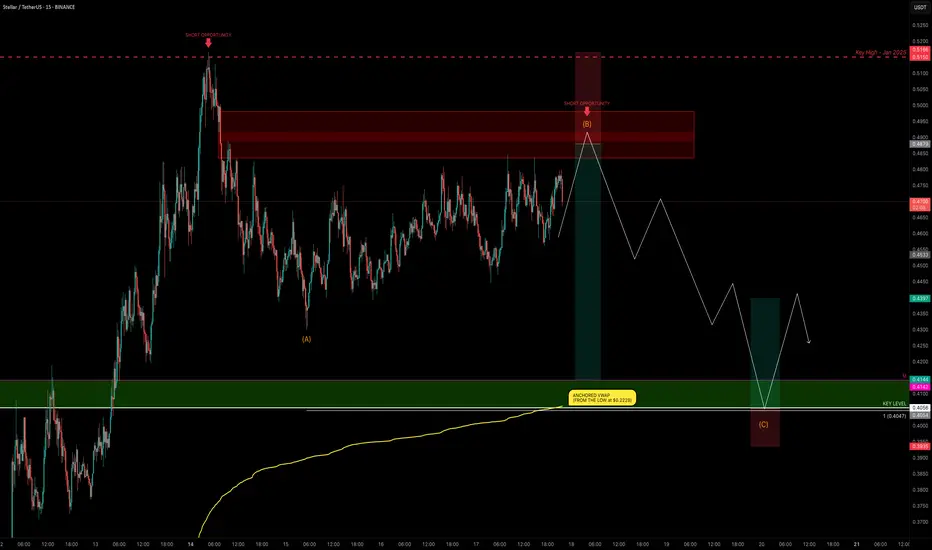
XLM Explodes +132% — Is the Party Over or Just Starting?XLM has been one of the top movers, sweeping the January 2025 swing high at $0.515 before stalling and moving sideways for the past 4 days.
Is XLM gearing up for another push toward the highs, or is a correction imminent?
Let’s dive into the details.
🧩 Market Structure & Fractal Pattern
XLM skyrocketed +132% in just 13 days, mirroring the explosive move seen back in November 2024.
If we apply the November fractal, the current price action suggests we could be setting up for an ABC corrective move.
📉 Key Levels & Confluences
FVG Zone: ~$0.49–$0.50 — likely to be swept before any major move down.
Monthly Support: $0.4142
Key Level / Liquidity Pool: $0.4056 — likely cluster of stop-losses.
Anchored VWAP (from $0.2228 start of trend): currently near $0.4056, adding strong confluence.
1.0 Trend-Based Fib Extension (ABC projection): If price pushes to ~$0.49 to complete wave B, the projected 1.0 TBFE for wave C lands right on the $0.4056 key level + VWAP, creating a perfect confluence zone.
➡️ Conclusion: The $0.4142–$0.4056 zone is a critical support and liquidity area with multiple confluences lining up.
Trade Setups
🔴 Short Setup:
Entry zone: $0.48–$0.50 (ladder in)
Stop-loss: Above $0.5166 (prior high)
Take-profit: $0.4142–$0.4056 zone
R:R ≈ 1:3
🟢 Long Setup:
Entry zone: $0.4142–$0.4056 (preferably near VWAP)
Stop-loss: Below $0.395
Take-profit: $0.44
⚡ Final Thoughts
Watch for a potential final push toward $0.49–$0.50 before a corrective wave unfolds.
The confluence at the $0.4142–$0.4056 zone — including monthly/weekly levels, VWAP, liquidity pool, and the 1.0 TBFE target — makes it a key area for decision-making.
Stay patient and wait for confirmation at these levels. Will post an update as things unfold!
_________________________________
💬 If you found this helpful, drop a like and comment!
Want breakdowns of other charts? Leave your requests below.
going lower or bouncing on resistance? market is respecting key support/resistance or channel boundaries. These points often become decision zones where big moves occur.
Signs this could be a fakeout:
BTC wicks above a resistance or below a support with little follow-through
Volume spikes only on the wick, then dies quickly
Price reverses back into the range soon after breaking it
If BTC recently broke a trendline with low volume, it smells like a trap move — a liquidity grab.
If it’s testing support again after failing to rally, and volume is increasing on red candles, a leg down is possible.
However, macro trend is still up unless we lose a major higher low (say, sub-$60k or sub-$56k depending on your chart).

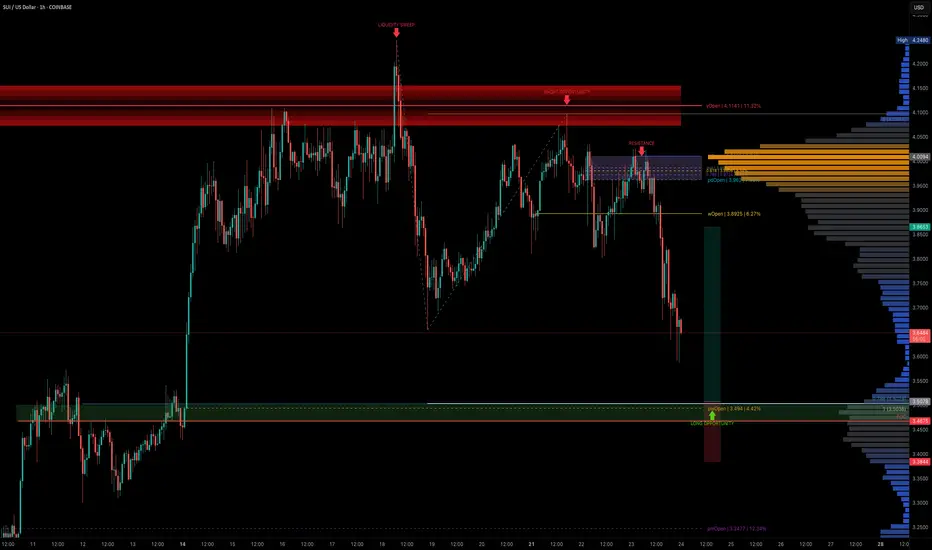
SUI — Structured Dip Buy Zone You Shouldn't IgnoreSUI has been technically clean, with well-respected Elliott Wave counts and fib levels.
As the broader market dips, it's time to look for sniper long entries and SUI is setting up beautifully for one around the $3.50 zone.
🧩 Key Confluence Zone: $3.50
This level offers a high-probability buy zone, backed by multiple layers of technical confluence:
0.786 Fib Retracement: $3.5029
1.0 Trend-Based Fib Extension: $3.5036
Previous Trading Range POC: $3.4675
Previous Weekly Open (pwOpen): $3.494
🟢 Long Trade Setup
Entry: ~$3.500
Stop-loss: $3.4675
Target (TP): $3.85+
R:R: ~1:3
🛠 Indicator Note
In this analysis I'm using my own indicator:
➡️ DriftLine — Pivot Open Zones
It helps identify key market opens (daily, weekly, prior), which often act as magnet levels and reaction zones.
➡️ You can use it for free — just check out my profile under “Scripts” and apply it to your charts.
💡 Pro Insight: Build Trades Where Tools Agree
A single level is just noise. But when fib retracements, extensions, POCs, opens, and price structure all line up — that’s where conviction trades are made.
The more overlap, the more likely the market reacts — this setup shows just that.
Final Thoughts
SUI is approaching a technically rich zone around $3.50, and this could be one of those low-risk, high-reward long entries if confirmed by price action.
With a clean invalidation and 1:3 R:R, this is the kind of setup you want to plan — not chase.
Set your alerts, stay patient, and trade with structure. 🚀✍️
_________________________________
💬 If you found this helpful, drop a like and comment!
Want breakdowns of other charts? Leave your requests below.
A GOOD SELL OPPORTUNITY FINALLY EMERGE ON EURGBPA good sell opportunity is what’s envisaged on EURGBP. Price has reached a high of 0.87387 therefore I expect some form of sell off as it’s already at the resistance level.

$INTC Got Smacked. Relief Bounce or Trap?Yikes. NASDAQ:INTC just faceplanted from $23.50 straight down to $20.50. It’s peeking its head up now. If you’re playing the bounce, be nimble — this thing’s still bleeding on the higher timeframes. Don't get in unless you see more pickup and buy signal.
UltraAlgo caught the drop early. If it crosses $20 could go down deeper.

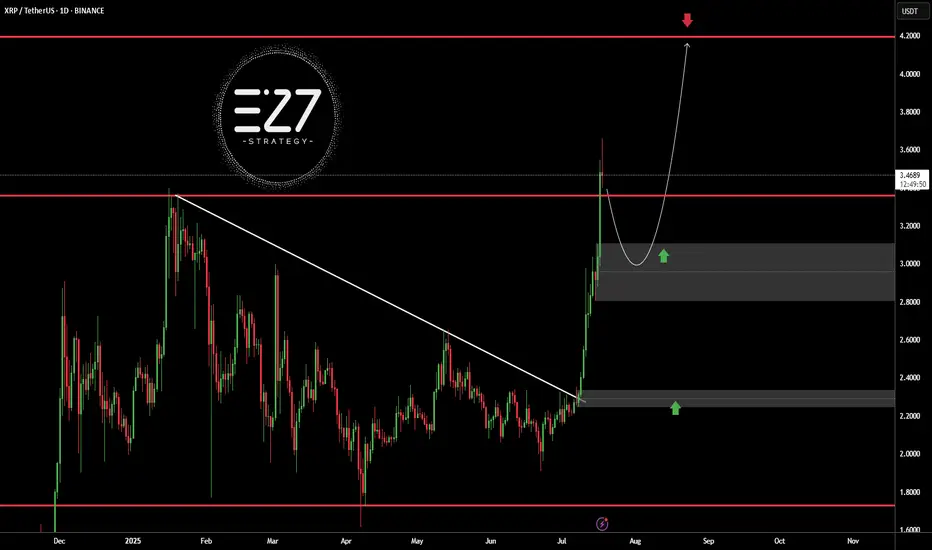
XRPUSDTBINANCE:XRPUSDT broke above its long-term downtrend line and surged to the $3.5000 resistance area, but is now undergoing a correction. The current bullish structure, with a higher high and higher low, suggests the trend remains upward. A pullback toward the $3.0000 demand zone is likely and would be a healthy retracement. Holding this area could trigger a continuation toward the key resistance at $4.2000.
Key Level Price
Main Support $2.2000
Main Resistance $4.2000
Best Buy Range $2.9500 – $3.1500
Best Sell Range $4.1000 – $4.2000
Investment Risk (Buying) Medium
⚠️Please control RISK management
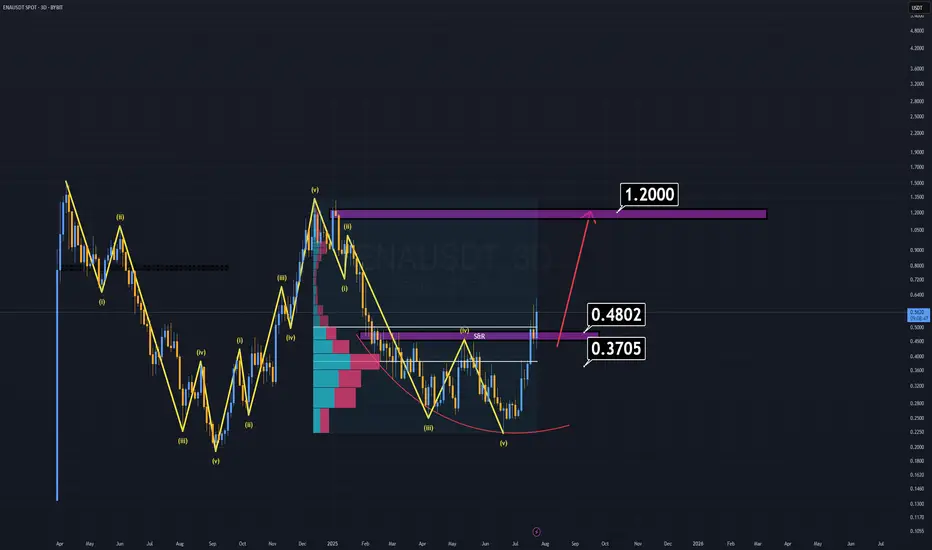
ENA Analysis (3D)ENA has been outperforming many altcoins for weeks, yet it still appears undervalued based on its fundamentals and recent investor interest.
Where to buy?
Right now, buying at current levels is extremely risky, as the ideal buy-back zones are significantly below the market price.
First major support: $0.48 — considered a "cheap" entry.
Dream entry (low probability): $0.37–$0.38 — at that point, ENA would feel almost free.
Notably, BlackRock and its partners are actively investing in ENA, which speaks volumes about its long-term credibility. That alone justifies keeping it on your radar.
Minimum target: $1.00–$1.20
Remember, that’s just the beginning. We may see even more once momentum kicks in.
Sometimes, the best trade is the one you're waiting for.
Good luck.
Structural and Technical Analysis of Crypto + BTC + Altcoins + TStructural and Technical Analysis of Crypto + BTC + Altcoins + Totals + Dominance
🔔 Follow me & smash that rocket 🚀 if you find this useful! Let's ride the next wave together!
🕒 Timeframe: 4H
🧠 Strategy: Customized Dow Theory + Structural
---
🟡 A critical moment for the market:
Many coins, including top 10 alts, are currently sitting on major key levels. Yes, you can go long — but only IF volume supports the move.
📈 That means we must keep an eye on:
TOTAL, TOTAL2, TOTAL3
BTC.D, USDT.D
---
💎 Bullish Trigger Conditions:
✅ BTC.D must show strong red candles (dominance falling)
✅ USDT.D must break below 4.22-4.23 (money flowing out of stablecoins)
✅ TOTAL must break 3.85T
✅ TOTAL2 must break 1.48T
✅ TOTAL3 must break 1.05T
🔴 If all these confirm, it could be a great trigger to enter alt positions.
---
🔍 BTC Outlook
As previously mentioned:
🟥 If sellers want BTC below $115K, they need to break it fast and sharp — slow breakdowns won’t work due to buyer activity.
🟨 Bullish trend requires a break above $120K.
📊 Most likely scenario? Ranging between $115K - $120K
⚠️ BTC Dominance plays a key role here. If dominance drops while BTC ranges, alts could explode.
---
💸 USDT.D Critical Level:
A clean breakdown of 4.23 on USDT.D = 🚀 Funds rotating into alts
---
✅ Coins To Watch (Long Setup Only IF Above Conditions Hold):
♦️BNB
enter:741.00
Sl: 786.13
♦️ETH
enter:3750
Sl: 3480
♦️SUI
enter:4.10
Sl:3.40
♦️XRP
enter:3.25
Sl:2.92
♦️LINK
enter: 18.60
Sl: 17.4
♦️AAVE
enter:295
Sl:276
♦️ADA
enter:0.8405
Sl: 0.7628
♦️SOL
enter: 192.40
Sl:177
♦️DOGE
enter:0.249
Sl:0.220
🔁 Note: First SUI trigger was 3.80 — next key level is 4.10.
---
⚠️ Important Notes:
Today is Saturday, expect low volume
Manage risk ⚠️ and avoid aggressive Martingale strategies
High chance of fake breakouts
Levels being tested might just be lower highs in a bearish structure
❗️Even for bearish continuation, volume increase is key
---
🟢 If you liked this post, don’t forget to Follow & Hit the 🚀 Rocket to stay updated on live setups and strategic insights!
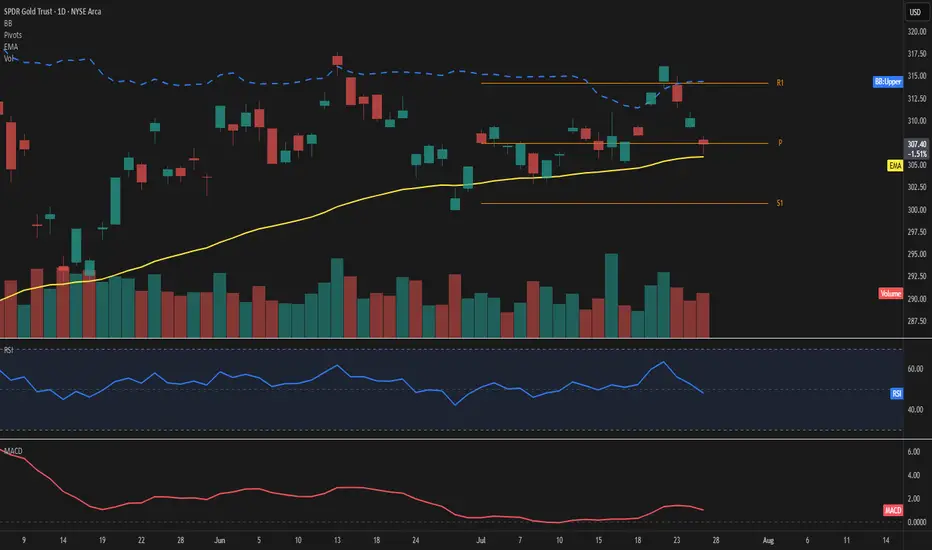
GLD – Price consolidates at highsPrice is hovering just above the 50-day EMA at 307, showing signs of short-term hesitation near the Fibonacci pivot. The upper Bollinger Band sits at 314, leaving moderate room for expansion if momentum picks up.
The RSI reads 48, reflecting a balanced setup without clear directional bias. MACD remains slightly positive, suggesting a still-constructive but soft momentum.
Key levels to watch include the pivot at 307 and the support at 301. On the upside, the 314 area aligns with both R1 and the upper band, acting as the next challenge.
Volume is up sharply (+22%) despite a mild -0.9% price pullback, indicating possible accumulation beneath the surface.
As long as price holds above the 50-day EMA, the structure remains intact.
A move away from the pivot zone will likely define the next directional wave.
ETHUSD Will Go Down From Resistance! Sell!
Here is our detailed technical review for ETHUSD.
Time Frame: 1D
Current Trend: Bearish
Sentiment: Overbought (based on 7-period RSI)
Forecast: Bearish
The market is testing a major horizontal structure 3,641.87.
Taking into consideration the structure & trend analysis, I believe that the market will reach 2,871.15 level soon.
P.S
Overbought describes a period of time where there has been a significant and consistent upward move in price over a period of time without much pullback.
Disclosure: I am part of Trade Nation's Influencer program and receive a monthly fee for using their TradingView charts in my analysis.
Like and subscribe and comment my ideas if you enjoy them!

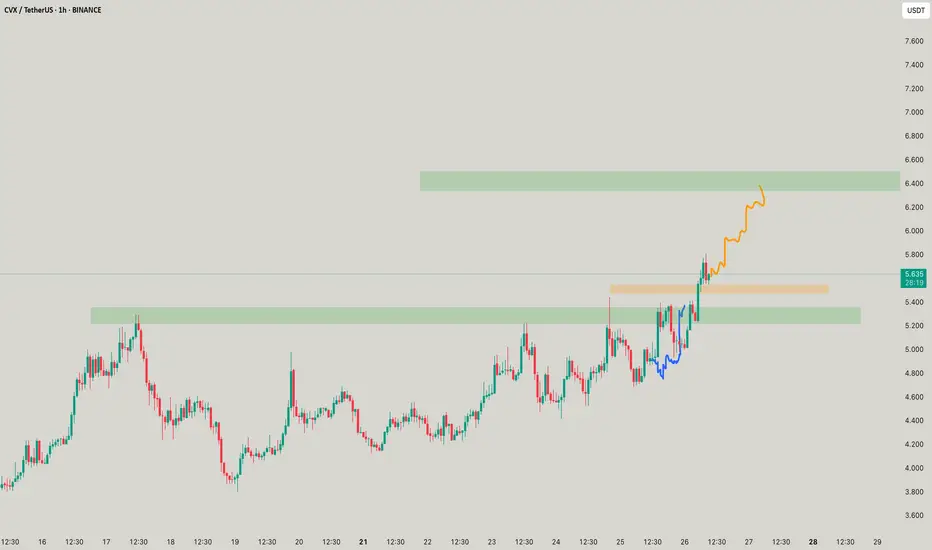
CVX - It asks for you to be civic!SO 6.5 ! when? soon? soon when? if it doesnt breaks the orange, though looks ripe to get the orange one

S&P 500 Index Wave Analysis – 25 July 2025
- S&P 500 Index broke key resistance level 6300.00
- Likely to rise to resistance level 6500.00
S&P 500 Index recently broke the key resistance level 6300.00 (which stopped the previous waves 5 and (B), as can be seen below).
The breakout of the resistance level 6300.00 continues the active intermediate impulse wave (5) from the middle of this month.
Given the strong daily uptrend, S&P 500 Index can be expected to rise to the next resistance level 6500.00 (coinciding with the daily up channel from May).

Newtusdt.pIt might get pump back to the top.
We need to see some bullish momentum before entering to the trade..
Always take 50% profit when price starts to move.
Rest DYOR

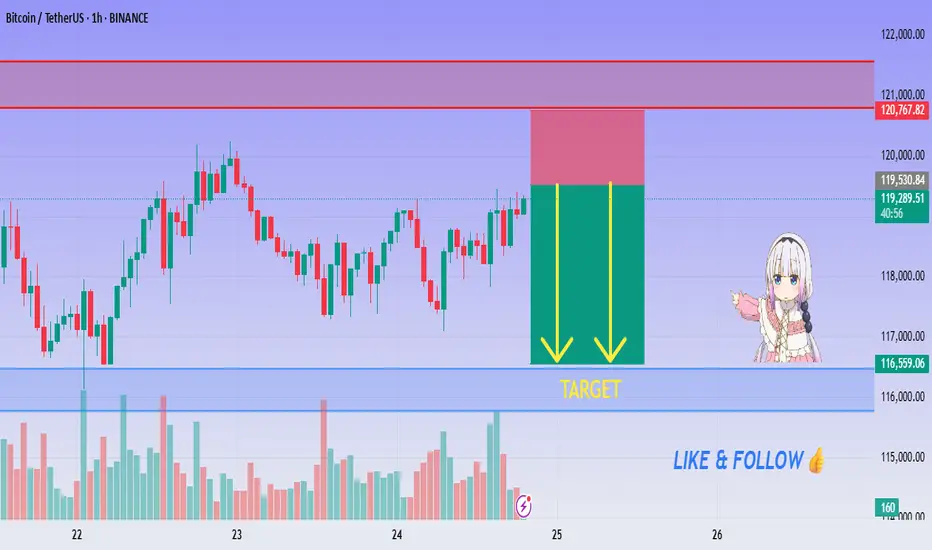
BTC SELL Setup - Big Drop Loading Below Resistance!💙 BTC/USDT Rejection Confirmed ! SELL!
👨💻 Dear traders,
After careful analysis of the recent price action on BTC/USDT (1H timeframe), here is the conclusion:
Price has entered a strong supply zone between $120,000 – $121,000, where clear signs of rejection have appeared.
Bias – Bearish
🎯 Target – $118,000
🎯 Target – $117,000
🎯 Final Target – $115,000
🛑 Safe Stop Loss – $121,200
📊 Reasoning:
– Price touched key resistance and is showing double rejection wicks
– Bearish momentum building below the red zone
– Two yellow arrows highlight expected move range (target box)
– Clear risk-to-reward with defined SL above zone
– Volume confirming slowing bullish pressure
🌟 Stay patient, follow risk management & trade safe!
🍀 WISHING YOU GREEN PIPS! 💰
Is $PENGU Cooling Off?CSECY:PENGU continues to deliver, respecting structure and printing some clean price action. After breaking out of consolidation beneath the LOI at 0.032, price extended sharply, reaching as high as 0.0469—where we just saw a firm rejection, previously identified in the last update.
That level wasn’t random. It aligned with a Most Likely Target (MLT) for a wave 5 at a lesser degree and a wave 3 at a higher degree. That kind of confluence usually draws in some heat—and it did.
So what now?
The conservative bull outlook is that we may be entering a wave 4. How this pullback unfolds could tell us a lot. The last retrace was shallow, and if this one digs a bit deeper or breaks certain levels with pattern clarity, that might signal a higher degree wave 4 is underway. The key level here is the 0.0325 level we were watching before.
The raging bull scenario is that we’re still in a lesser degree impulse up. A hold and bounce off the key level could be enough to continue the move higher. But I’m watching the conservative outlook here until we get more print.
Here’s what I’m watching:
• Wave 4 Behavior
Is this a pause or a pivot? The next leg depends on how corrective this gets.
• 0.027
A break here would raise eyebrows. That’s a deeper level of interest and could hint at something more than a minor pullback.
• Pattern Depth & Structure
Each retrace tells a story. More complex wave 4s tend to show themselves through drawn-out corrections or deeper fib targets.
I’m still holding partial from the original 0.012 entry, having taken some profit on the way up. If we get a clean W4 print, I’ll be scouting for the next add.
Trade what’s printed. Stay flexible. Let the wave show its hand.
Trade Safe.
Trade Clarity.

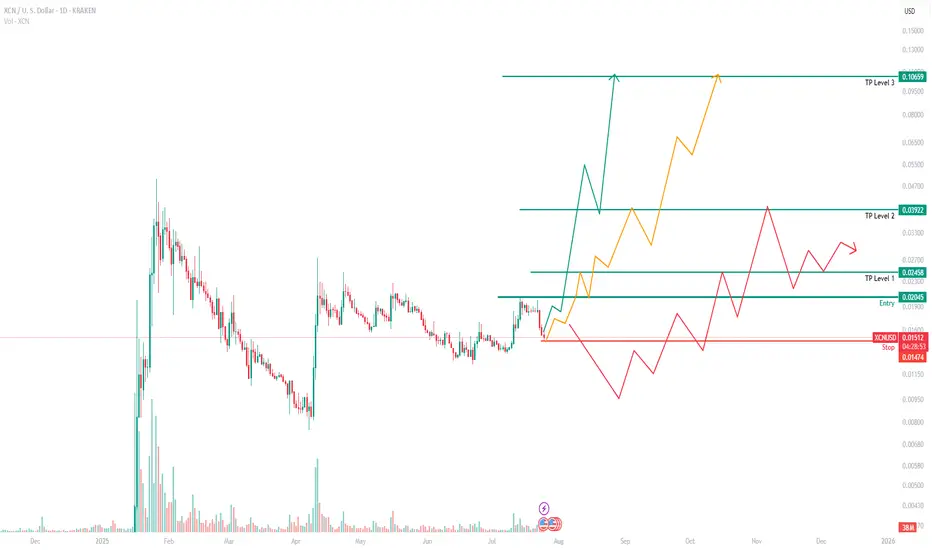
XCN: A potential 4x returnAt Ralfetto, we see so many charts daily, but few remind us of XRP. XCN is just that. XCN reminds us of XRP in its early days when you could purchase 1 XRP for under 1c.
As a project, we are unaware of the fundamentals, only what the chart is telling us, and its showing bullishness against BTC, XRP, XLM and other currencies we feel have a long strong future forward.
In short:
Buying range, between 0.012 and 0.019
Latest entry - 0.02
Target Price 1 = 0.024
Target Price 2 = 0.038
Target Price 3 = 0.10
There could be overperformance given how small the market cap and cost is, but XCN has all the ingredients to give traders some healthy returns.
DOGE/USDT Technical Analysis – Breakout AnticipationDOGE/USDT Technical Analysis – Breakout Anticipation
As of the current market structure, DOGE/USDT is showing signs of a potential bullish reversal from the demand zone (support), aiming toward the projected target at 0.27253 USDT.
🔍 Chart Structure & Price Action
Support Zone (0.21873 – 0.22568): The price has previously respected this area, making it a strong demand zone where buyers stepped in.
Resistance Zone (0.27756 – 0.29000): A key supply zone where previous rallies halted. This is the ultimate test for bulls after the breakout.
Current Price (0.23743) is showing consolidation above the support, suggesting accumulation before a move.
🧠 Technical Indicators
Supertrend Indicator: Currently flipping to bullish (10,3 settings), indicating potential upside continuation.
Volume Profile (VRVP): Shows high volume nodes around the support level, confirming strong interest from institutional players or large orders.
Market Structure: A higher-low is forming, indicating early signs of a bullish market shift.
🎯 Target
The projected move towards 0.27253 USDT aligns with previous price action and supply zone interaction. A clean breakout from the current consolidation could fuel momentum toward this level.
🎓 Educational Insight
This setup reflects the principles of Smart Money Concepts (SMC):
Price tapping into demand before impulse moves.
Liquidity grab at lows.
Break of structure (BOS) to the upside could trigger continuation.
Traders can learn the value of combining structure-based trading with volume analysis to improve entry precision and confidence.

ERAUSDT Forming Bullish FlagERAUSDT has caught the attention of traders after a strong impulsive move that has laid the foundation for a possible continuation of its bullish trend. The current structure appears to be forming a classic bullish flag/pennant formation, a pattern often observed in strong uptrends, where price consolidates in a narrow range before breaking out higher. With volume supporting the recent breakout and price action showing resilience near consolidation support, this setup presents an exciting upside potential.
The projected gain of 90% to 100%+ aligns well with the technical structure seen on the chart, especially considering the momentum-driven environment ERAUSDT is trading in. As price continues to coil within a tight range, it builds the energy necessary for a decisive breakout. The bullish sentiment surrounding the ERA ecosystem, coupled with increasing interest from speculative and long-term investors, could be the fuel needed to push this pair into a significant rally.
Fundamentally, ERA is beginning to draw more eyes from across the crypto community, possibly due to developments or partnerships that are elevating its profile. This blend of technical readiness and rising investor interest makes it a coin to watch in the short to mid-term. If bullish confirmation holds, the next leg could be sharp and aggressive, potentially achieving or even exceeding the projected 100% target.
This is a moment where traders who rely on high-reward momentum setups could benefit by monitoring this pair closely. With risk well-defined below recent lows and the structure signaling strength, ERAUSDT deserves a spot on every active trader's radar.
✅ Show your support by hitting the like button and
✅ Leaving a comment below! (What is You opinion about this Coin)
Your feedback and engagement keep me inspired to share more insightful market analysis with you!

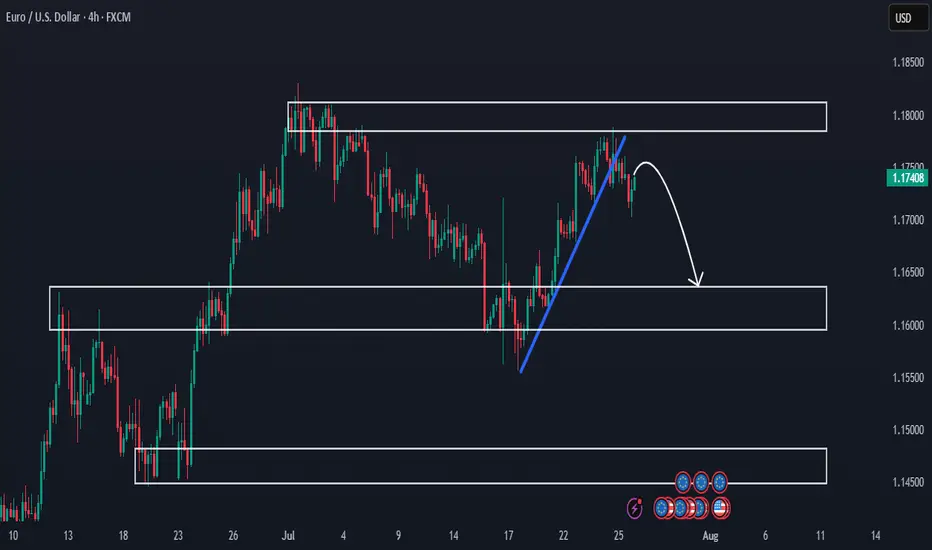
Premarket Analysis - Will Price Head Lower?Hello everybody!
We’re looking at three key areas on the chart.
Price has been rejected from a supply zone.
The clean upward trendline has been broken, and we expect the price to move lower this week.
If the drop continues, we’ll look to sell and aim for the more likely target around 1.16400.
Then we’ll see whether this first demand/support area holds or not.
Have a good trading week ahead!
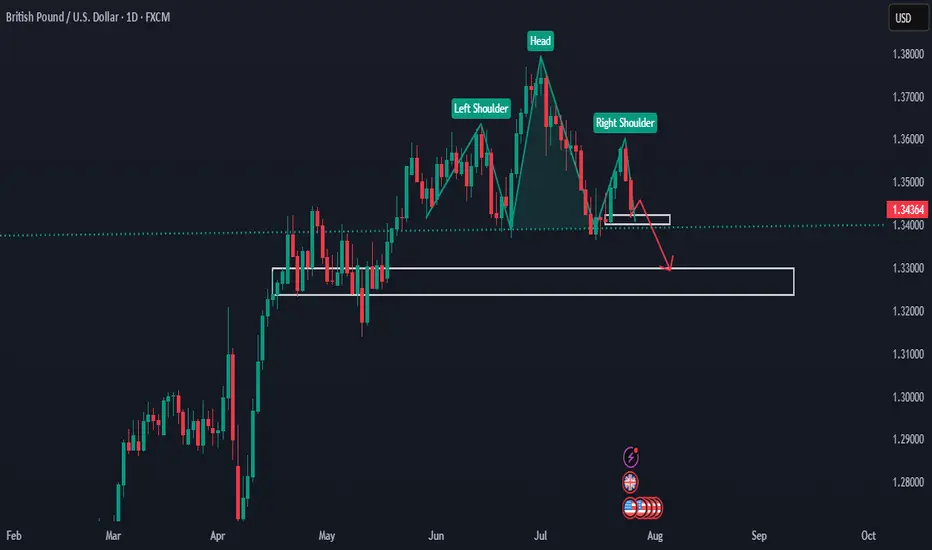
GBP Forming Head & Shoulders - Possible Bearish Scenario AheadHello traders!
As you can see, price has formed a Head and Shoulders pattern on the daily chart.
If it breaks below the current support/demand area, it could move lower toward the 1.32000 – 1.33000 zone.
We’ll be watching closely to see what it does in the coming weeks.
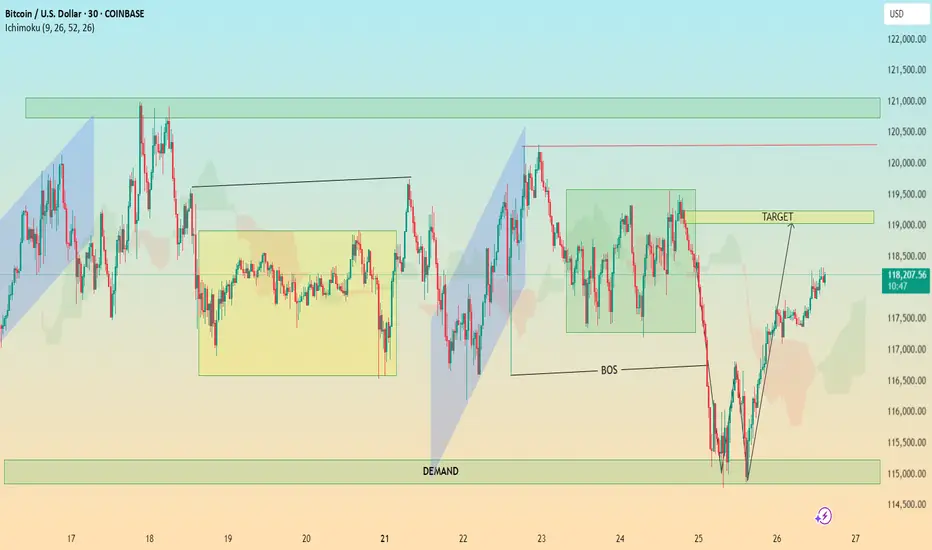
BTC In-Depth Technical Analysis: BTC/USD (30-Min Chart)🔍 In-Depth Technical Analysis: BTC/USD (30-Min Chart)
🟩 1. Demand Zone Reaction
Location: ~$114,500 – $115,500
Significance:
Price sharply reversed after a strong move into this demand zone.
This zone coincides with a liquidity grab below previous lows — textbook Smart Money trap.
Volume (if checked) would likely spike here, indicating institutional interest.
✅ Interpretation: Institutional demand stepped in, absorbing sell orders and triggering a reversal.
📉 2. Break of Structure (BOS)
Zone: Around July 24–25
Price broke below a key higher low, signaling temporary bearish structure.
However, this was quickly reclaimed after demand zone reaction — suggesting a fakeout BOS or a liquidity sweep.
✅ Interpretation: BOS caused shorts to enter, but reversal suggests a bear trap and continuation higher. The BOS served to fuel a more aggressive bullish rally.
🎯 3. Target Zone
Marked Target: ~$118,900–$119,200
Why This Area?
It aligns with a previous consolidation zone / supply before the sharp drop.
Also overlaps with Ichimoku cloud resistance and previous highs — strong confluence.
✅ Interpretation: Price is likely to face resistance here. If broken with strong momentum, bullish continuation to the next supply zone (~$121K) is possible.
⛓️ 4. Market Structure Analysis
Higher Lows Forming after demand reaction.
Price is forming a bullish market structure with an ascending wave pattern.
A break and retest of the $119K zone could lead to a mid-term rally.
Failure to break could result in:
A pullback to the $117,000 area
Or a deeper retest of the demand zone
✅ Trading Plan Options:
Bullish Bias: Buy pullbacks above $117,000 with $119,000 as target
Bearish Bias: Wait for strong rejection at $119,000 to short back to $115K
☁️ 5. Ichimoku Cloud Insight
Price has moved above the cloud, suggesting momentum shift to the upside.
The cloud is twisting bullish, supporting short-term bullish trend.
However, flat Kumo tops around $119K = likely rejection zone.
✅ Interpretation: Ichimoku confirms bullish potential, but price must close above the cloud + $119K zone to sustain trend.
📌 Key Takeaways for Publishing
Chart Idea Title:
“BTC/USD Demand Zone Reversal | Break of Structure & $119K Target in Sight”
Summary Description:
Bitcoin has reclaimed bullish momentum after a sweep into the $115K demand zone. A break of structure triggered shorts, but demand absorption led to a sharp reversal. Now, price is approaching the key $119K supply zone — a critical level that could determine if this is a short-term rally or the beginning of a new trend. Watch for either a clean breakout or a rejection for a possible retest of $117K or lower. Confluence from Ichimoku, BOS, and market structure support the analysis.