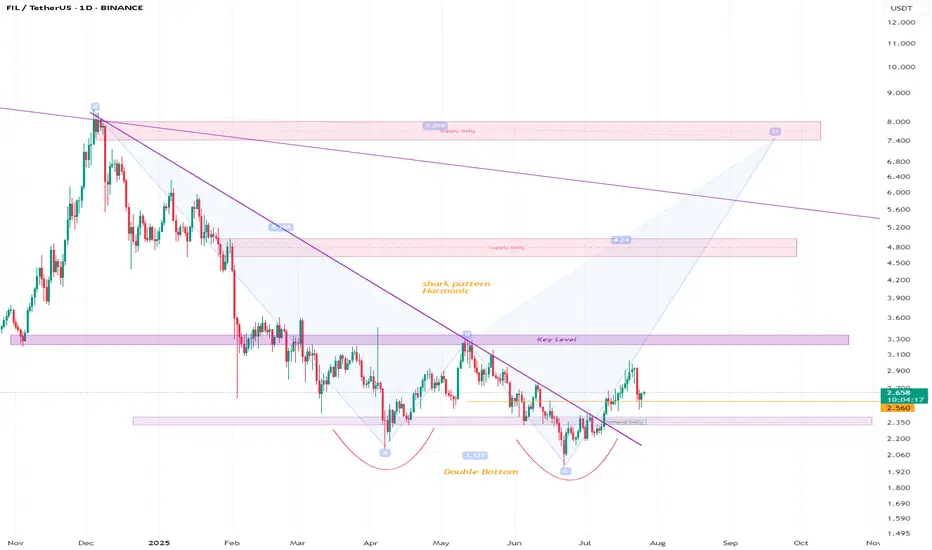
filusdtHello friends, I think Filecoin has a shark pattern and a classic twin bottom. I think it can grow well if important resistance levels are broken (good luck). Check it out for yourself.
Trend Analysis
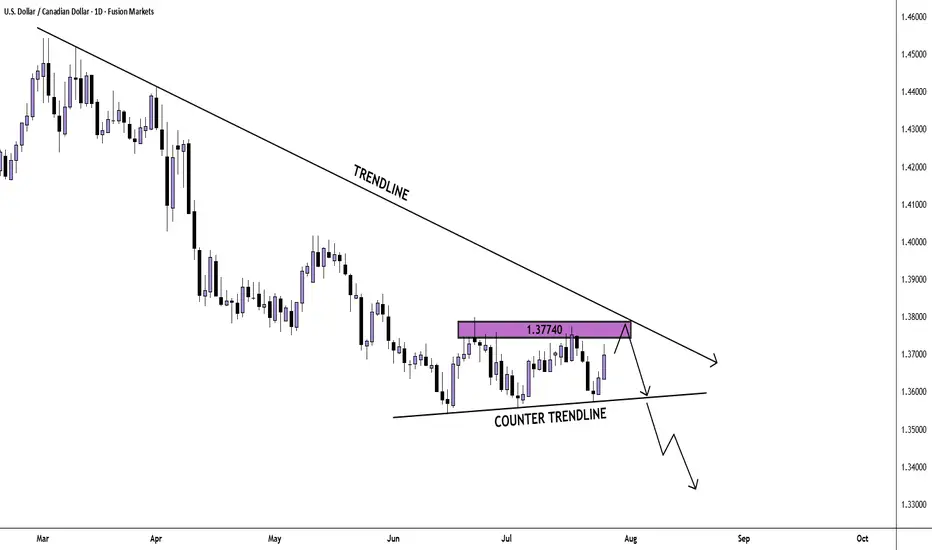
USD/CAD Daily Chart AnalysisFrom the bigger picture we see that sellers are dominating the market. Currently, price looks to be in a correction phase and twice has found resistance at the 1.37740 price point.
If price finds resistance there again, we may see a breakout and another bearish impulse.
If you agree with this analysis, look for a trade that meets your strategy rules.
Ethereum Bitcoin pair bottom confirmed!As confirmed by CRYPTOCAP:ETH \ CRYPTOCAP:BTC momentum, we can say that a local bottom was seen at 2019 accumulation levels. With a major reversal from the current region, we can see major movements across Altcoins, with Ethereum being an undeniable leading force and leader for altcoins.

USOIL LONG FROM SUPPORT
USOIL SIGNAL
Trade Direction: long
Entry Level: 65.00
Target Level: 66.37
Stop Loss: 64.09
RISK PROFILE
Risk level: medium
Suggested risk: 1%
Timeframe: 2h
Disclosure: I am part of Trade Nation's Influencer program and receive a monthly fee for using their TradingView charts in my analysis.
✅LIKE AND COMMENT MY IDEAS✅

PENGU.usd eyes on $0.0437: Golden Genesis to END run or BREAK? PENGU has been running for many days now.
Currently testing a Golden Genesis at $0.0437
Could mark lower high of TOP, or Break-n-Run.


XAUUSD clean to dropXAUSD CLEAN TO DROP for the next 3 weeks
I will bee waiting for this set up and now all that we need is patience

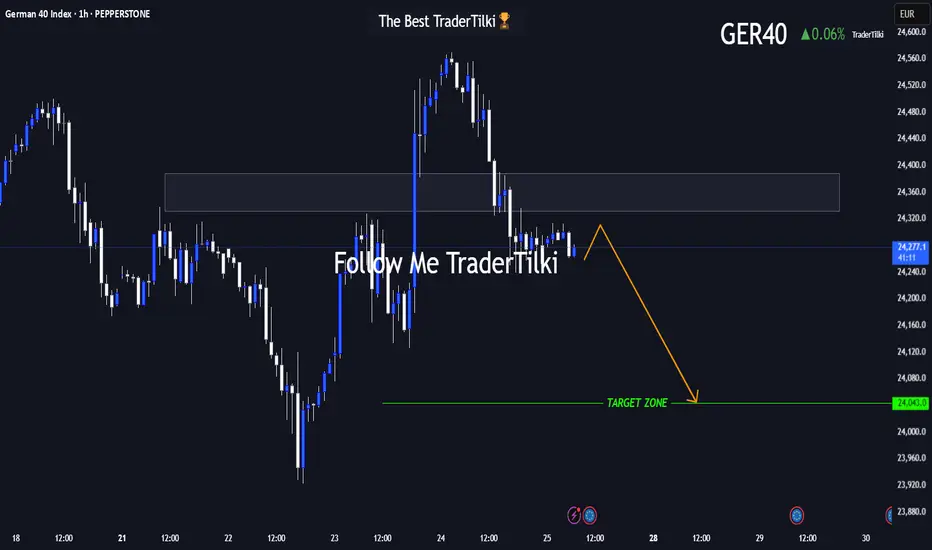
GER40 in Motion: This Setup Speaks Volumes 🌅 Good morning, my friends,
I’ve put together a fresh GER40 analysis just for you. Even if the 1-hour timeframe shows some upward momentum, I fully expect the price to reach my target level of **24,050**.
I'm holding firm until that level is hit.
Every single like from you is a massive source of motivation for me to keep sharing analysis. Huge thanks to everyone supporting with a tap!
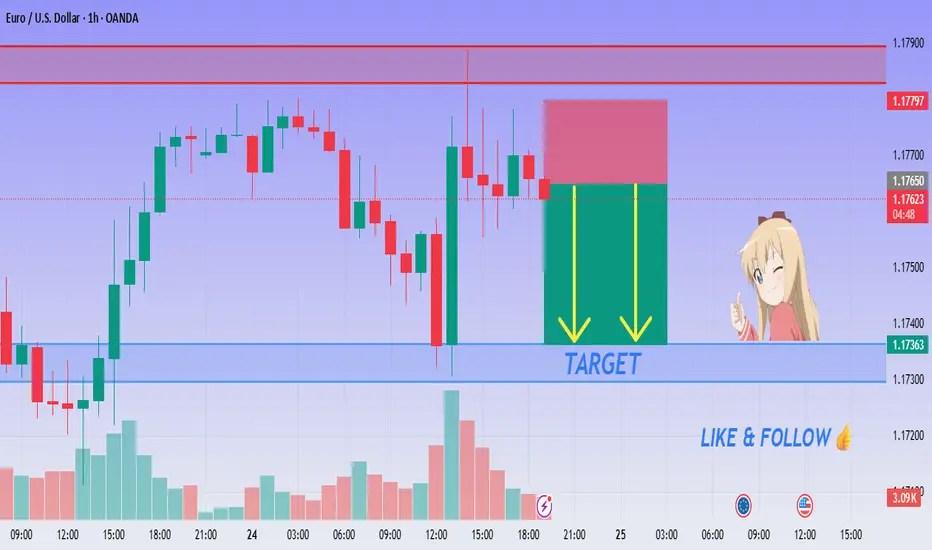
EUR/USD SELL SETUP - Rejection at Resistance!💙 EUR/USD Rejection Confirmed! SELL!
👩💻 Dear traders,
After reviewing the price action on EUR/USD (1H), I’ve concluded the following:
Price is reacting to a clear supply zone around 1.17680 – 1.17780, and signs of rejection have started appearing.
Bias – Bearish
🎯 Target – 1.17450
🎯 Target – 1.17320
🎯 Final Target – 1.17200
🛑 Safe Stop Loss – 1.17820
📊 Reasoning:
– Price touched key resistance and began stalling
– Red zone marks a clean rejection range
– Two yellow arrows show expected short move
– Trend is turning bearish near resistance
– Ideal intraday short setup with clear R:R
🍀 Stay sharp & follow the setup! Good luck!
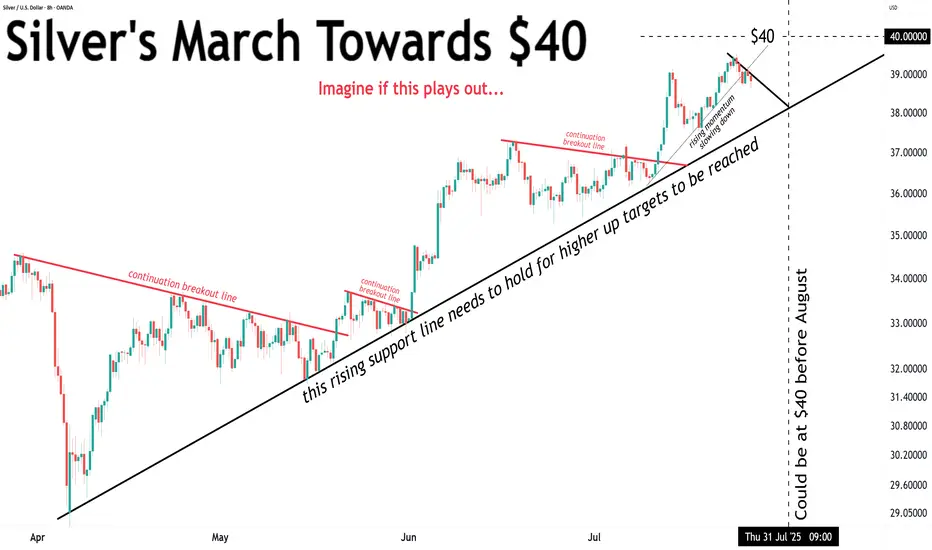
Silver’s short-term momentum is slowing down...Silver’s short-term momentum is slowing down...
Will it have enough juice to crack $40 before August?
🍿🍿🍿
Stellar (XLM): Bearish CME + Potential Buy Entries | Bullish!Stellar is building up for the major resistance zone near $0.60, which is also our target currently.
We have set 2 entry zones for buy trades, where the upper one will be activated once we form the proper BOS, but due to the fact that we have bearish CME, we also set a second entry in case we go and fill that CME.
Swallow Academy

CHECK GBPUSD SIGNAL UPDATE GO AND READ CAPTAINEntry Point: Around 1.34000 TO 1.33900
Take Profit 1: 1.34600
Take Profit 2: 1.35100
Last Target: 1.35700
Stop Loss: 1.33450

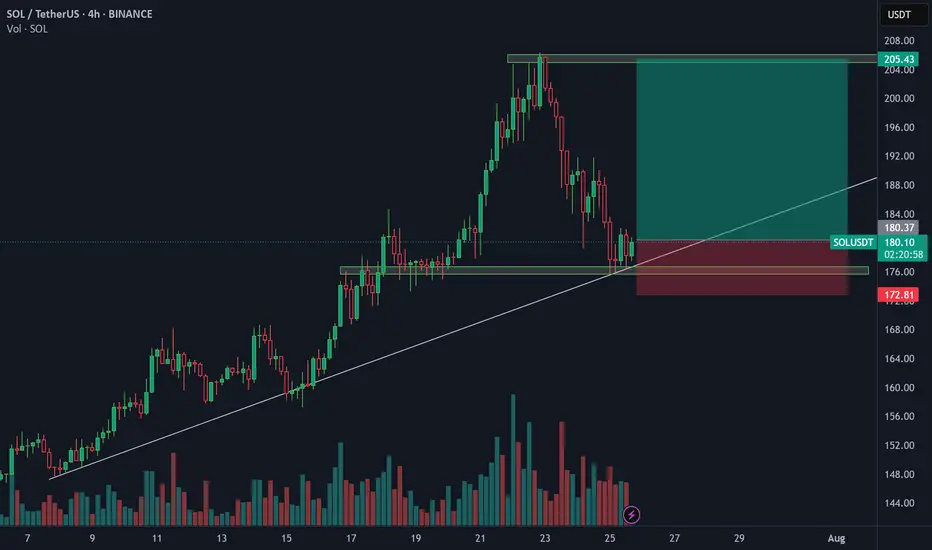
SOL LONGSolana is bouncing off the support level and the ascending trendline. Bullish movement is expected to continue and reach $205
CHECK EURUSD SIGNAL UPDATE GO AND READ CAPTAINEntry Point: Around 1.17350 TO 1.17250
Take Profit 1: 1.16900
Take Profit 2: 1.16450
Last Target: 1.16050
Stop Loss: 1.17800

EURUSD - Next Buy Zone? This one has some nice potential
We will see how it plays out if we get tagged in

REI/USDT-God Candle REI has consistently defended the $0.015 zone for the past 40 days, signaling early signs of a potential reversal point in alignment with the broader market cycle. This base-building behavior suggests strong underlying demand, making it a high-potential setup. A breakout with a "god candle" could be the first major sign of trend reversal. The green box marks a prime entry zone, offering an excellent risk-reward opportunity for early positioning ahead of the next bullish leg.

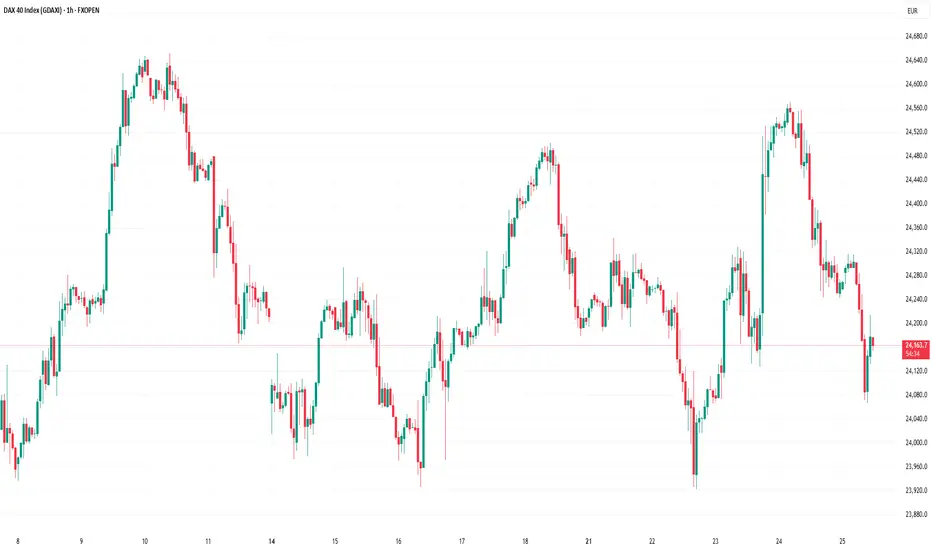
The DAX Index Is Losing Its Bullish MomentumThe DAX Index Is Losing Its Bullish Momentum
At the end of May, we noted that the German stock index DAX 40 was exhibiting significantly stronger performance compared to other global equity indices. However, we also highlighted the 24,100 level as a strong resistance zone.
Two months have passed, and the chart now suggests that bearish signals are intensifying.
From a technical analysis perspective, the DAX 40 formed an ascending channel in July (outlined in blue). However, each time the bulls attempted to push the price above the 24,460 level (which corresponds to the May high), they encountered resistance.
It is worth noting the nature of the bearish reversals (indicated by arrows) – the price declined sharply, often without intermediate recoveries, signalling strong selling pressure. It is likely that major market participants used the proximity to the all-time high to reduce their long positions.
From a fundamental standpoint, several factors are weighing on the DAX 40:
→ Ongoing uncertainty surrounding the US–EU trade agreement, which has yet to be finalised (with the deadline approaching next week);
→ Corporate news, including disappointing earnings reports from Puma, Volkswagen, and several other German companies.
Given the above, it is reasonable to assume that bearish activity could result in an attempt to break below the lower boundary of the ascending blue channel.
This article represents the opinion of the Companies operating under the FXOpen brand only. It is not to be construed as an offer, solicitation, or recommendation with respect to products and services provided by the Companies operating under the FXOpen brand, nor is it to be considered financial advice.
A Legends Continuation. BTCHello I am the Cafe Trader.
Today we are going to look at a trade inspired by the Legendary Trader and Scalper Al Brooks.
If you are not familiar with him I recommend having a strong foundation with price action before giving him a look.
It's no secret that BTC is at levels many thought it would never reach, and yet many others are convinced of 5 - 10x more from this run alone. It can be crushing to feel like you missed out on the move, so instead of getting FOMO, I've detailed a guide to help you in the short or the long term.
Long Term
As of right now you are looking at 4 different levels of demand. It is up to you to measure your conviction, understanding why you want to invest, and how much you are willing to risk. Recognize that Many Big hedge funds have been hesitant with accumulating hoards of Crypto do to its volatile nature, considering it too risky.
So with this in mind, I have given you 4 levels to add BTC to your long term depending on your personal conviction.
Hyper Aggressive = Top of Demand $115,500 (willing to risk 50%)
Aggressive = Demand $99,500-101,250 (willing to risk 40%)
Fair Price = Strong Demand $74,000 - 78,000 (willing to risk 25%)
Steal = Extreme Demand $42,000 - 50,800 (willing to risk 10%)
Thinking about how much you are willing to risk will help you level out your Fear of missing this move, and get pricing that meets your personal demand.
Short Term
My fellow traders, this is a nugget (inspired) from Al Brooks. The "Two Bar Trend Break" .
In a strong trend (not in a range), When you get a trend break (I like to go top of wick to top of wick for this trade), if the second bar doesn't have a huge topping tail, but closes near the top, you can enter this trade.
Here is a trade that happened this month That hasn't filled yet (it got close).
Entry At the close of the second green candle $116,000.
Measure the bottom of the First candle that broke (called the Signal candle) to the top of the second bar that broke (called the Entery Candle). If you take that measurement, and add it to your take profit, you will have a 1R Scalp (1 measure of risk to 1 measure of reward).
This isn't a true scalp, typically they should be in the same bar or next bar, but this follows similar principles.
That's all for BTC, stay tuned for more analysis as we go over Ethereum, XRP, and one more of your choosing.
Happy Trading!
@thecafetrader

USDCHF Short ProjectHi guys...😎
My custom indicator says it's time to do a Short Project on USDCHF with 3 key reasons:
1. Price Drivers: institutional shorting
2. Trend: down
3. Momentum: bearish
Action: waiting for entry on the intraday timeframe (entry will be published further)
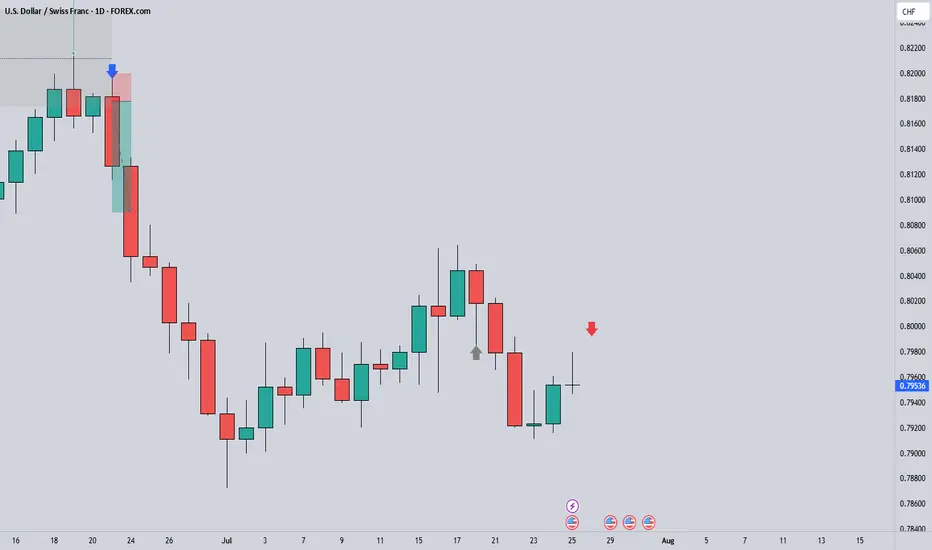
Next Volatility Period: Around August 21
Hello, traders.
Please "Follow" to get the latest information quickly.
Have a nice day today.
-------------------------------------
#TSLA
We need to see if it is rising along the rising channel.
The key is whether it can rise with support near 311.48 to break out of the downtrend line.
The key is whether it can rise along the short-term uptrend line and break through the short-term downtrend line after passing through this volatility period around July 25.
Therefore, we need to see whether it can rise above the 347.21-382.40 range with support near 311.48.
The next volatility period is expected to be around August 21.
-
The important thing is to maintain the price above the M-Signal indicator on the 1M chart.
If not, there is a possibility of a long-term downtrend.
Therefore, if it shows support in the 268.07-311.48 range, it is a time to buy.
-
Thank you for reading to the end.
I hope you have a successful trade.
--------------------------------------------------

Altseason 2025 – EthseasonWe’ve officially entered #ETH season. Some liquidity is flowing into alts, but CRYPTOCAP:ETH has now taken the lead from CRYPTOCAP:BTC as the big dog.
Old retail is here and slowly buying this dip... but the new retail is nowhere to be seen, yet! Still positioning for that full-blown altseason:
🥑 POLONIEX:GUACUSDT 🧱 MEXC:YBRUSDT ⛏️ MEXC:KLSUSDT
🌐 HTX:SYNTUSDT 🧪 MEXC:DEAIUSDT ✳️ MEXC:SAIUSDT
🔗 POLONIEX:LLUSDT 🎮 KUCOIN:MYRIAUSDT 🤖 COINEX:ENQAIUSDT
#crypto #altseason2025 #altseason #ethseason

GBP-USD Support Ahead! Buy!
Hello,Traders!
GBP-USD went down but
The pair will soon hit a
Horizontal support level
Of 1.3400 from where we
Will be expecting a local
Rebound and a move up
Buy!
Comment and subscribe to help us grow!
Check out other forecasts below too!
Disclosure: I am part of Trade Nation's Influencer program and receive a monthly fee for using their TradingView charts in my analysis.

USDT DOMINANCE Update (2H)After losing important levels, the price has now started to pull back, and it seems that some of the market’s major players have taken profits.
On the chart, the price faces two key levels ahead, from which it could be rejected at either one.
There is also a possibility that the price will reach the key level zone.
We are waiting for the reaction to these levels.
A daily candle close above the invalidation level will invalidate this analysis.
For risk management, please don't forget stop loss and capital management
Comment if you have any questions
Thank You
