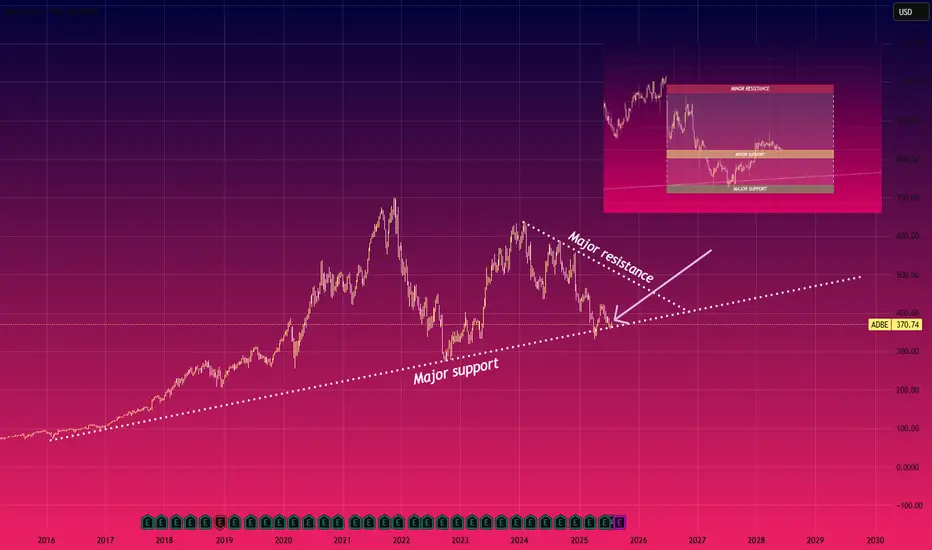
L: Quick Analysis on $NASDAQ:ADBE Support and ResistanceQuick Analysis on NASDAQ:ADBE Support and Resistance
The chart shows NASDAQ:ADBE nearing a major support level around $370, Which has held since 2016, the downward resistance line suggests continued pressure, but a breakout above $400 levels could signal a bullish reversal
Please note this is not financial advice
Trend Analysis
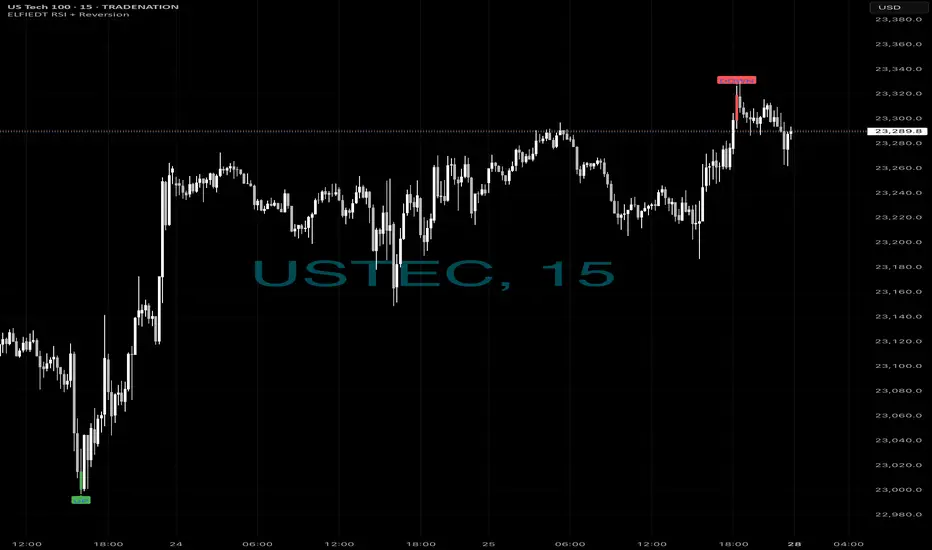
Longs then short - $$$🚀 Caught the Bottom. 🔻 Sold the Top.
Same chart. Same system. Same day.
While most traders were guessing,
ELFIEDT RSI + Reversion was sniping both ends on the US Tech 100.
📍 Long Signal:
At the dead low — green UP arrow fired.
The reversal followed instantly. Momentum exploded.
📍 Short Signal:
At the top of the rally — red DOWN printed.
Perfect spot. Price reversed hard within 1 candle.
⸻
🎯 How It Works:
✔️ Combines RSI overshoots + volatility reversion
✔️ Filters false signals using structure + time of day
✔️ Works on any index or FX pair
✔️ Real-time signals. No lag. No repainting.
⸻
💡 These weren’t “lucky trades.”
They were high-probability SETUPS.
Backed by logic. Confirmed by RSI extremes.
And now? Proven on the chart.
⸻
👉 Want to catch the next reversal like this?
💬 DM me “USTEC” or drop a 🚀
🔒 Access is limited to serious traders only.
📲 Follow for daily setups & training.
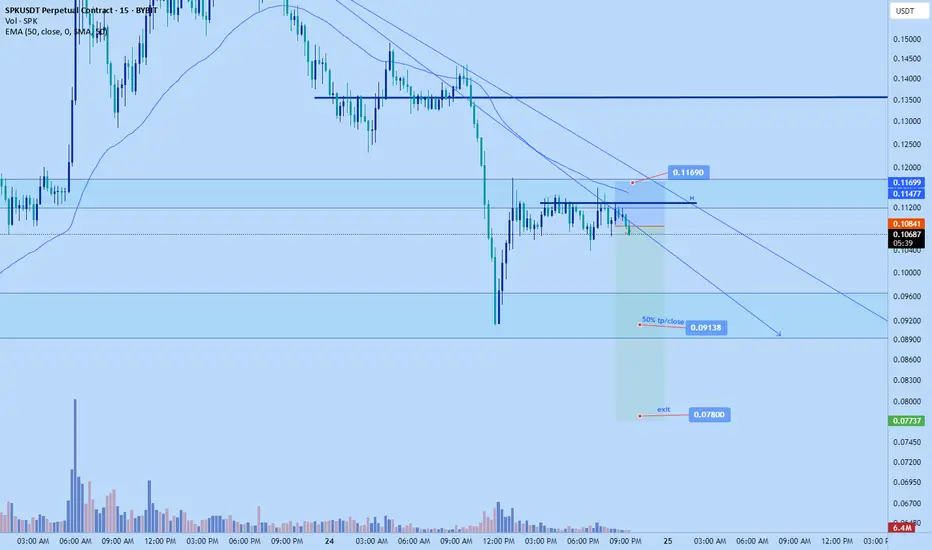
Spk short to $0.078Just recently opened up a short position on SPK. Targeting $0.078
|Scaling out at least 50% at 0.09138-*might full close depending on market reaction
Time sensitive
Double bottomDouble bottom with RSI regular divergency. It seems that buyers a willing to buy at this level again.

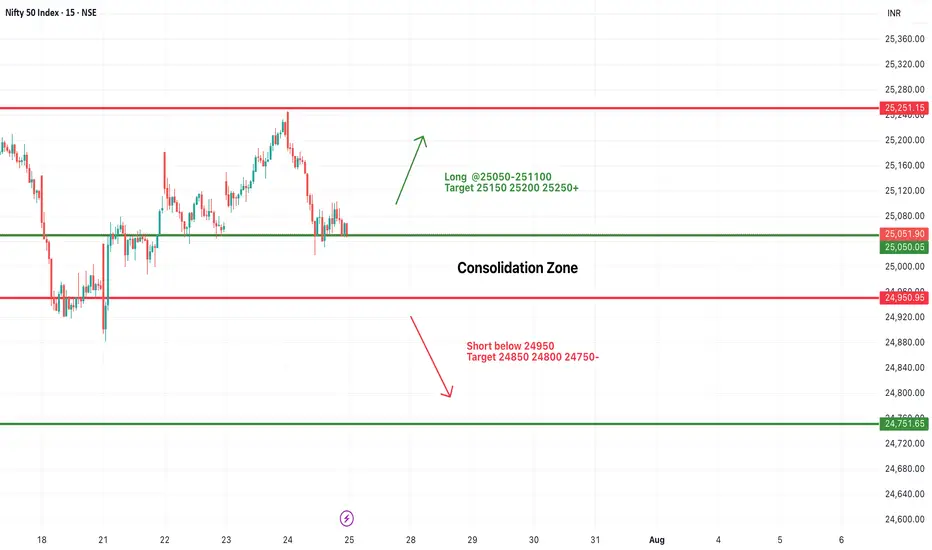
#NIFTY Intraday Support and Resistance Levels - 25/07/2025Nifty is expected to open with a slight gap-down and is currently trading within a tight consolidation zone between 24,950 and 25,050. This narrow 100-point range has acted as a critical zone over the past sessions, indicating indecision and low conviction among traders.
A sustained move above 25,050–25,100 may provide a long opportunity with potential upside targets of 25,150, 25,200, and 25,250+. Strong bullish momentum will only be confirmed if Nifty manages to close above 25,250, which may push the index further toward 25,350–25,400 in the coming days.
On the other hand, a breakdown below 24,950 will shift the bias toward bearishness. A short setup could then target 24,850, 24,800, and 24,750- levels.
Until then, expect sideways price action between 24,950 and 25,050. Traders should wait for a breakout or breakdown before entering fresh trades. Avoid aggressive entries inside this tight band.
Gold prices are under pressure, focusing on the Fed stormGold prices are under pressure, focusing on the Fed storm
Weekly gold price report: The rebound of the US dollar suppresses precious metals, and the market focuses on the Fed's policies and trade negotiations
Market review
On Friday (July 26), the international gold price was under pressure to fall, with spot gold falling 0.9% to $3,336.01/ounce, and COMEX gold futures closing down 1.1% to $3,335.6/ounce. The US dollar index rebounded from a low of more than two weeks, and the progress in US-EU trade negotiations weakened the demand for safe havens, which jointly suppressed the performance of precious metals.
Analysis of core influencing factors
The US dollar and trade situation
The US-EU trade agreement negotiations have entered a critical stage. The EU said that "the agreement is just around the corner", but member states still approved the potential counter-tariff plan. US President Trump said that he will negotiate with the EU on Sunday, with a probability of 50%. If the agreement is implemented, it may further suppress the safe-haven properties of gold.
The recent trade agreement between Japan and the United States also boosted market risk appetite, and funds flowed to risky assets.
Fed policy expectations
Despite the resilience of the US labor market (initial jobless claims fell to 217,000 last week, the sixth consecutive week of decline), the market generally expects the Fed to keep interest rates unchanged at its July meeting.
Trump has recently pressured the Fed to cut interest rates and even made a rare visit to the Fed headquarters, sparking discussions on policy independence. Some analysts believe that if inflationary pressures ease, the Fed may release dovish signals in the second half of the year.
Fund positions and central bank demand
As of the week of July 22, hedge funds' net long positions in gold increased to 170,868 contracts, the highest level since April, reflecting the market's long-term concerns about trade tensions.
Central bank gold purchase demand still provides structural support for gold prices.
Geopolitical dynamics
Israeli-Palestinian conflict: Hamas said that the ceasefire negotiations have made progress, but the US statement caused a surprise, and the progress of subsequent negotiations may affect market sentiment.
Russia-Ukraine situation: Turkey coordinates all parties to hold a leaders' summit in Turkey. Russia and Ukraine have agreed in principle to meet, and potential peace plans may reduce the safe-haven premium.
Outlook for the future
Key short-term events:
US/EU/China trade negotiations: If progress is optimistic, gold prices may fall to the support level of $3,300/ounce.
Federal Reserve July resolution: Pay attention to the policy statement's hints on the path of interest rate cuts and the Fed's response to political pressure.
US non-farm data: If the employment data is strong, it may strengthen the expectation of "higher for longer" interest rates.
Technical aspect: Near $3,300/ounce may attract buying, but breaking through the previous high requires clearer signals of monetary policy shift.
Risk warning: Repeated trade negotiations, escalating geopolitical conflicts or unexpectedly dovish Fed may reverse the decline in gold prices.
BTC Balanced Volume Profile BTC is now trading in a textbook D-Shape Volume Profile. In english - Buyers & Sellers are happy to transact here and will stay inside the value area & consolidating sideways until further notice.
Consolidation at POC is a signature of this profile, and one of the easiest and least stressful trade setups because now, your mission, should you chose to accept. Is to fade the Highs (VAH) and Lows (VAL) and avoid the middle unless you love donating money to the market.
I'll have buy limit orders waiting right below the VAL where we have the single prints. It doesn't get any easier than this.
Doesn't mean price cant rip through, but this is always the best entry with less risk, especially when the single prints have not been tested yet..
BINANCE:BTCUSD CME:MBT1!

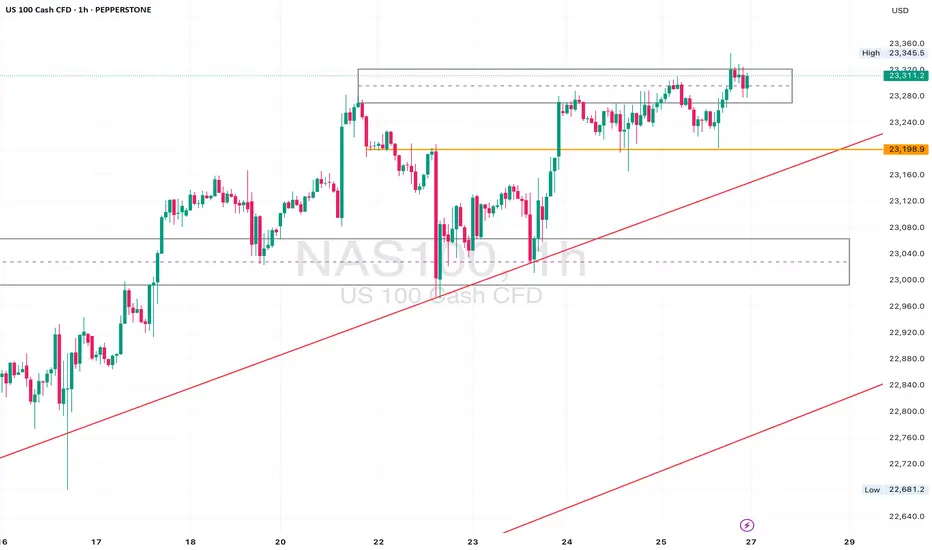
NAS100 Retesting Breakout – Eyes on 23170 for Bullish PushDaily Analysis:
Price is testing the upper boundary of the long-term ascending channel. Structure is still bullish with no major breaks of support. If momentum holds, we could extend toward the channel top.
4H Analysis:
Retesting breakout structure. Support is forming around 23000–23050. Bullish momentum remains valid unless price closes below this zone.
1H Analysis:
Micro-breakout confirmed with bullish impulse above 23120. If 23170 holds, continuation toward 23280–23320 is likely.
Confirmation & Entry:
Watch for continuation above 23170. SL below 23080. TP: 23280+
Use caution if 23000 breaks — this would weaken short-term bias.
BTC – Bulls still in controlBTC is trading around 117,800 USD, well above both the EMA 50 (111,800) and the pivot level (105,300), confirming bullish dominance. Price remains below the upper Bollinger Band (123,400), leaving potential room for continuation.
Momentum stays constructive, with RSI at 60 and MACD in a strong positive zone, reflecting sustained upward pressure. As long as price holds above EMA 50 and pivot, the next upside targets lie at 123,400 and R1 at 110,000 has already been surpassed.
Volume has dropped significantly (-31%), suggesting the latest move could lack conviction or represent a pause rather than a breakout.
As long as BTC holds above 111,800, the bullish scenario remains intact.
Watch for any rejection near 123,400 or a close back below the EMA as potential invalidation signals.

CHECK BTCUSD SIGNAL UPDATE GO AND READ CAPTAINEntry Point: Around 118200 TO 117900
Take Profit 1: 116750
Take Profit 2: 115550
Last Target: 114400
Stop Loss: 119400

BTC Liquidity Grab + BounceBitcoin just completed a liquidity sweep below the recent low, grabbing stop-losses before reversing sharply. This move often signals smart money accumulation, as shown by the strong bullish reaction off the demand zone. Aiming for the Buy-Side Liquidity (BSL) above $123K. Volume spike and RSI divergence further validate the bullish narrative.

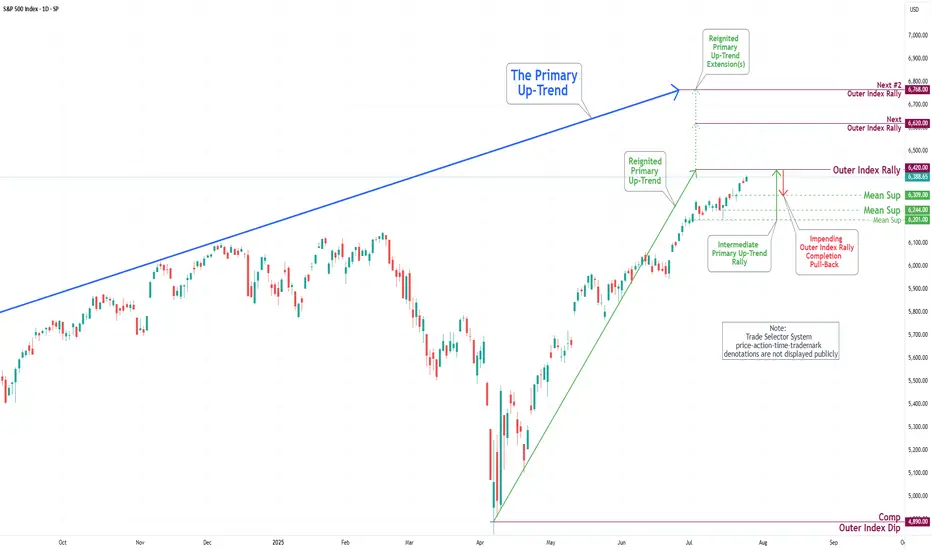
S&P 500 Daily Chart Analysis For Week of July 25, 2025Technical Analysis and Outlook:
In the trading activity observed last week, the S&P 500 Index exhibited a predominantly upward trajectory. It traded around the Key Resistance level of 6314. It successfully broke through this level, with the primary objective being to complete the Outer Index Rally at 6420, as outlined in the previous week's Daily Chart Analysis.
It is crucial to acknowledge that the current price movement may prompt a substantial pullback following the completion of the Outer Index Rally, with the main target identified as the Mean Support level of 6309. Following this potential downward adjustment, it is anticipated that the index will resume its upward trend, targeting a retest of the forthcoming completion of the Outer Index Rally at 6420.
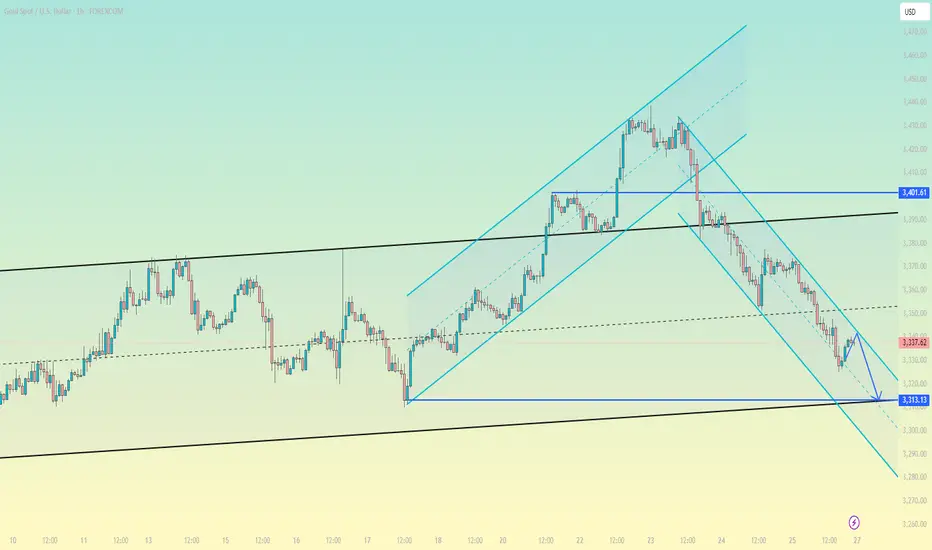
Gold is going down. It may continue next week.On the last trading day of this week, the bears attacked strongly and continued to refresh the recent lows, reaching the lowest point near 3325 before stopping.
From Monday's 3345 to 3440, it closed near 3337. This week, it also walked out of the large range roller coaster pattern, and all the strengths in the previous period did not exist. Under the continuous downward trend, the bulls were also vulnerable, and there was not even a strong rebound, which indirectly explained the strength of the bears in the short term.
As for the current trend, the bears are likely to continue to be strong, and before there is a symbolic upward breakthrough, we still need to maintain the idea of shorts to operate. The current upper pressure is maintained near 3350, which is also the bottom position touched for the first time in the previous period. It is possible that it will be transformed into a top-bottom conversion pattern; and the strong support level below is near 3310.
When the Asian market opens next Monday, we need to pay close attention to whether there is a gap problem on both the bulls and bears. After three consecutive negative daily lines, all the moving average systems have been broken, and it is also likely to form a resonance pressure pattern. On Monday, gold will first touch around 3350 and continue to short. The profit range will be around 3330-3320, and the stop loss will be 3360. If the European session is stronger, you can adjust the point before the US session.
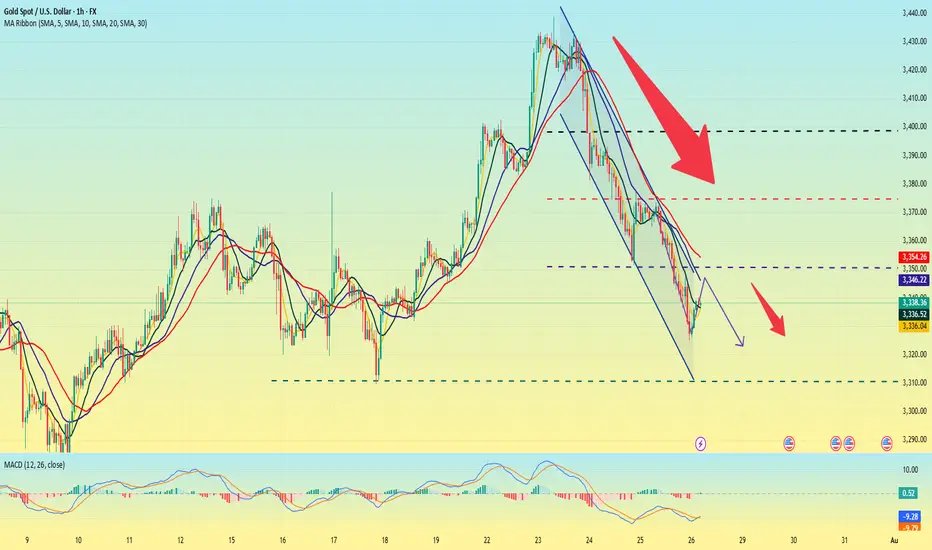
Summary of gold market this week and analysis of next week's mar
Gold closed with an inverted hammer candlestick with a relatively long upper lead this week. Technically, the market is still bearish next week, and the pressure from above is still relatively large. After reaching the highest point of 3438.7 this week, it started a unilateral decline mode, which caught the bulls off guard perfectly. This week, I also emphasized that the 3400 line is not a high point. Gold rose strongly at the beginning of this week, and the market had high expectations for bulls. In the second half of the week, gold fell unilaterally, hitting the bulls hard. This week, it closed at 3336.7, which is another distance from 3400. Next week, we will continue to give the operation ideas of rebound shorting according to the technical analysis. Following the trend is the way to invest. If your current operations are not ideal, I hope I can help you avoid detours in your investment. You are welcome to communicate with me!
From the 4-hour analysis chart, we focus on the short-term suppression of 3370-75 on the top, and focus on the suppression of 3397-3400 on the top. After all, gold fell and broke through here this week, and then fell southward. We focus on the support of 3312-18 on the bottom. On Friday midnight, we gave a long position at 3318-25. Gold rebounded at 3324.9 at midnight. In operation, gold will still be treated as rebound short next week. I will remind you of the specific operation strategy during the trading session, so please pay attention to it in time.
Gold operation strategy:
Short gold rebounds at 3370-75, stop loss at 3387, target 3327-3330, and continue to hold if it breaks;

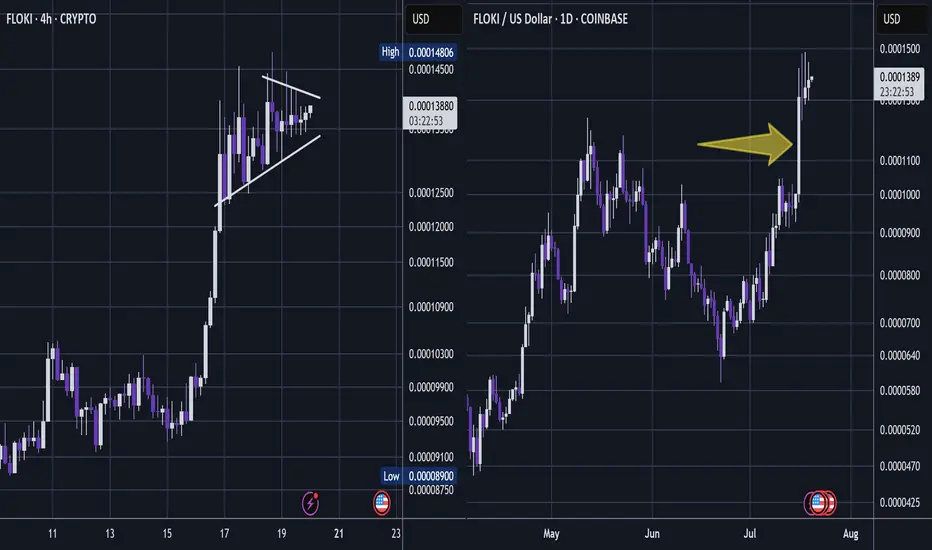
FLOKI - Oki Doki PumpJust one of many coins that I am picking in this area.
But these meme coins can have some pop - and so this is one I share with TradingView.
It had once nice push up (arrow) - signalling it has plenty of bullish potential.
The low time frame is choppy but the candles are both narrowing and shallowing -
I think this may be building pressure for a next wave up.
This analysis is shared for educational purposes only and does not constitute financial advice. Please conduct your own research before making any trading decisions.
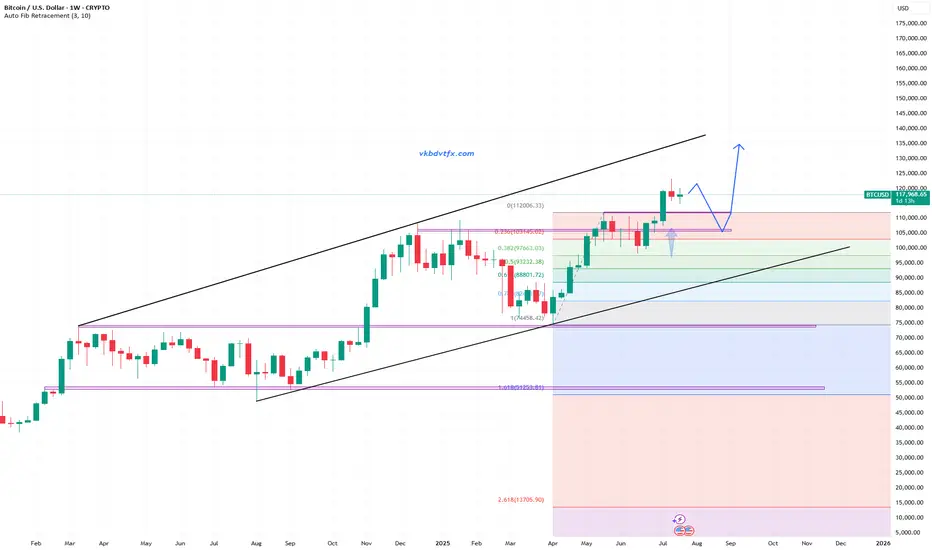
BITCOIN Is this just a giant Bull Flag?Bitcoin (BTCUSD) is basically on its first strong pull-back since the July 14 All Time High (ATH), as it is the 3rd straight red day going from roughly $120300 to below $115000 as of this moment.
Technically this Channel Down pull-back looks like a Bull Flag to the uptrend that started following the June 22 Low. The 1D RSI pattern is similar to the May 22 - 30 fractal, which was also a correction that started after a Channel Up and initially hit the 1D MA50 (blue trend-line), only to rebound a settle for a last dip lower closer to the 1D MA200 (orange trend-line).
If the 1D MA50 fails to contain the current correction, we may again be faced with a slightly more prolonged pull-back, which may be translated into an Accumulation Phase that could eventually lead to prices above $130000 by September.
Do you think that will be the case or we will see an instant rebound? Feel free to let us know in the comments section below!
-------------------------------------------------------------------------------
** Please LIKE 👍, FOLLOW ✅, SHARE 🙌 and COMMENT ✍ if you enjoy this idea! Also share your ideas and charts in the comments section below! This is best way to keep it relevant, support us, keep the content here free and allow the idea to reach as many people as possible. **
-------------------------------------------------------------------------------
💸💸💸💸💸💸
👇 👇 👇 👇 👇 👇

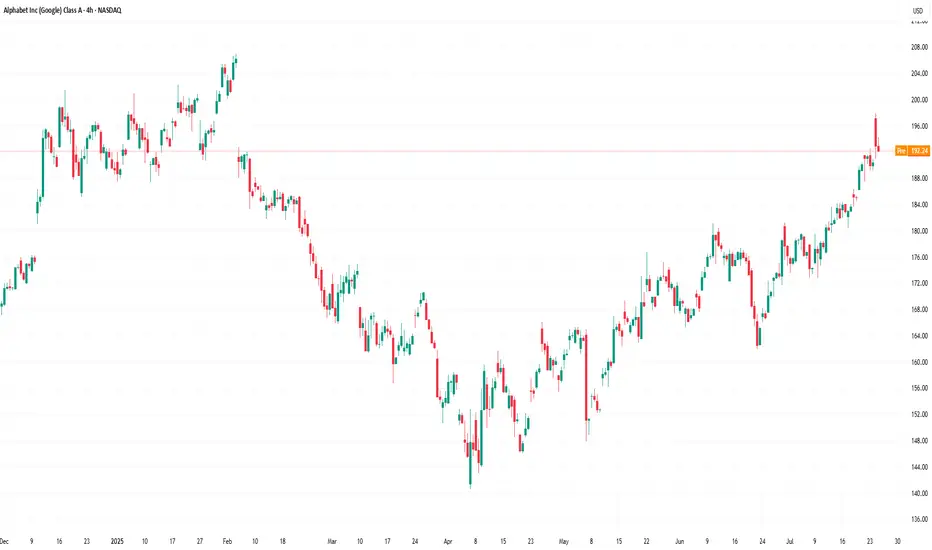
Alphabet (GOOGL) Stock Chart Analysis Following Earnings ReleaseAlphabet (GOOGL) Stock Chart Analysis Following Earnings Release
Earlier this week, we highlighted the prevailing bullish sentiment in the market ahead of Alphabet’s (GOOGL) earnings report, noting that:
→ an ascending channel had formed;
→ the psychological resistance level at $200 was of particular importance.
The earnings release confirmed the market’s optimism, as the company reported better-than-expected profits, driven by strong performance in both its advertising and cloud segments.
In his statement, CEO Sundar Pichai noted that AI is positively impacting all areas of the business, delivering strong momentum.
The company is expected to allocate $75 billion this year to expand its AI capabilities.
As a result, Alphabet (GOOGL) opened yesterday’s trading session with a bullish gap (as indicated by the arrow). However, as the session progressed, the price declined significantly, fully closing the gap.
This suggests that:
→ the bulls failed to consolidate their gains, allowing the bears to seize the initiative;
→ the ascending channel remains valid, with yesterday’s peak testing its upper boundary;
→ such price action near the $200 level reinforces expectations that this psychological mark will continue to act as resistance.
It is possible that the positive sentiment following the earnings report may weaken in the near term. Accordingly, traders may consider a scenario in which Alphabet’s (GOOGL) share price retraces deeper into the existing ascending channel. In this case, the former resistance levels at $180 and $184 may serve as a support zone.
This article represents the opinion of the Companies operating under the FXOpen brand only. It is not to be construed as an offer, solicitation, or recommendation with respect to products and services provided by the Companies operating under the FXOpen brand, nor is it to be considered financial advice.
DeGRAM | GOLD will retest the channel boundary📊 Technical Analysis
● Fresh rejection at the blue resistance line (~3 435) pushed XAU back to the 3 355 mid-band, yet successive higher-lows (green arrows) keep price inside the May-origin rising channel.
● The pullback is probing 3 328-3 355 — confluence of the former flag roof and triangle top; holding this zone should launch another test of 3 400/3 435, with the channel crest targeting 3 500.
💡 Fundamental Analysis
● U-S S&P-Global PMIs softened, nudging 2-yr real yields to three-week lows, while cautious ECB rhetoric limits dollar gains — both supportive for gold.
✨ Summary
Long 3 328-3 355; above that aims 3 400 ➜ 3 435, stretch 3 500. Invalidate on an H4 close below 3 293.
-------------------
Share your opinion in the comments and support the idea with a like. Thanks for your support!

XAGUSD - Silver - Important levels for the next few years!!These are important levels for the next few years.
I expect a new ATH for Silver. Better know where you buy and where you should sell.
Several CUP & Handle show how much silver is bullish.
After Gold, it's Silver's turn..

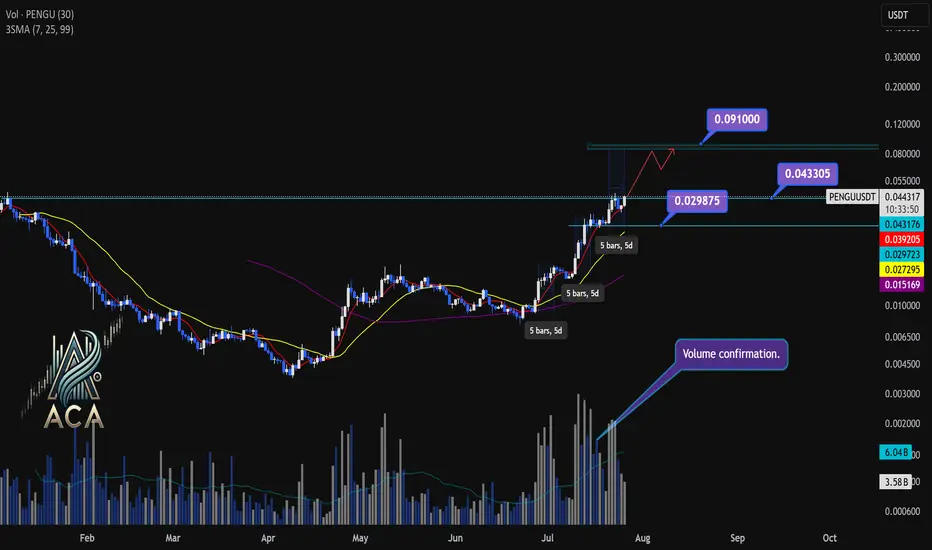
PENGUUSDT Daily Chart Analysis | Powerful Uptrend in PlayPENGUUSDT Daily Chart Analysis | Powerful Uptrend in Play
🔍 Let’s dissect the current PENGU/USDT daily chart, highlighting the unmistakable bullish structure and mapping potential targets as this trend matures.
⏳ Daily Overview
PENGUUSDT is riding a strong upward trend, with all three daily SMAs (7, 25, and 99) lined up in bullish sequence—clear confirmation of momentum. Recent rallies are also supported by textbook volume behavior: volume consistently surges during price climbs and tapers off during minor corrections, reflecting the classic signature of a robust uptrend.
🔺 Bullish Setup and Price Targets:
The next major upside target sits at $0.0910, almost 85% above the current level. For bulls, a daily candle closing above $0.043305 with convincing volume should act as a confirmation for fresh highs—though, as it’s Saturday, even moderate volume could suffice for a valid breakout.
📊 Key Highlights:
- All SMAs (7, 25, 99) confirming the uptrend on daily timeframe.
- Volume spikes on upward moves, fades on corrections—classic bullish confirmation.
- Historical trend velocity: Each time a new high (HH) is set, it’s preceded by around 5 days of advance; first leg was +83%, second +124%, the next (projected) is +160%, aligning with the $0.0910 target.
- Corrections: After each rally, pullbacks have measured about 15% and 20%. Should the first target be reached, expect a correction up to 25%—a healthy reset for further continuation.
🚨 Conclusion:
With all signals aligned—moving averages, volume dynamics, and historic price structure—the path remains bullish. A decisive close above $0.043305, especially with solid volume, could be the catalyst for the next major leg higher. As always, monitor for typical correction ranges post-breakout in line with the prior trend.
bitcoin technical chart movingwe are provide bitcoin next falling expected after big chance to buying level
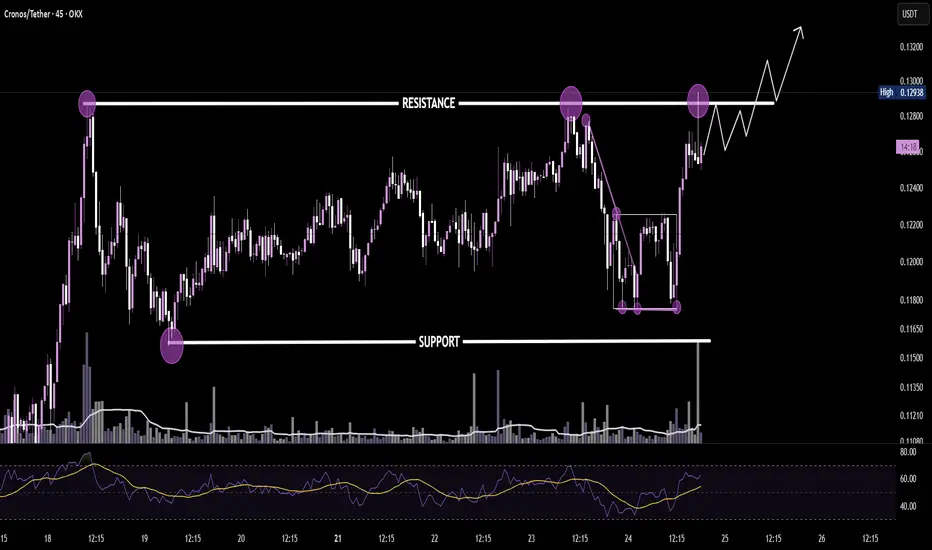
Cronos 45M – Range Breakout SetupPerfect triple tap at support led to a sharp reversal. Price now testing range resistance — clean breakout structure forming.
If confirmed, eyes on continuation toward $0.132+ 🚀
Btcusd techinical analysis.Btcusd techinical analysis next move posibale at h1 time.not finchinal advice.
