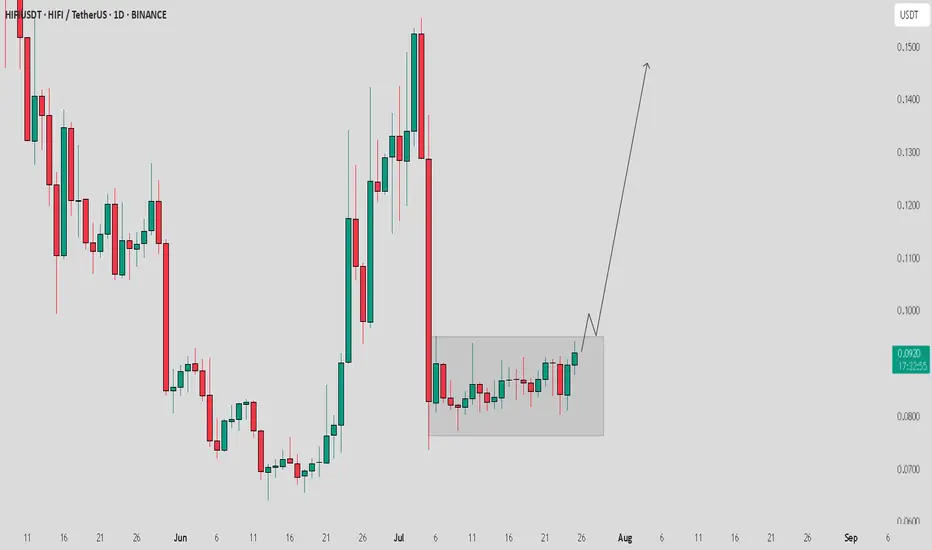
HIFI / USDT in consolidation zone heading to break through itHIFI/USDT Analysis:
HIFI/USDT is currently in a consolidation zone and seems to be heading towards a potential breakout. If it breaks through this zone, we could see a good move towards $0.14 soon, assuming the market remains stable.
Bullish Scenario:
Breakout above consolidation zone could trigger a strong move towards $0.14.
Confirmation: Watch for strong volume during the breakout to ensure the move is genuine.
Bearish Scenario:
Failure to Breakout: If the price fails to break through and stays within the consolidation, the setup might remain invalid.
Note:
Current market situation is not looking very strong right now. I hope the correction happens smoothly soon, but if the market remains unstable, this setup could become invalid. Always manage your risk and stay cautious.
Trend Analysis
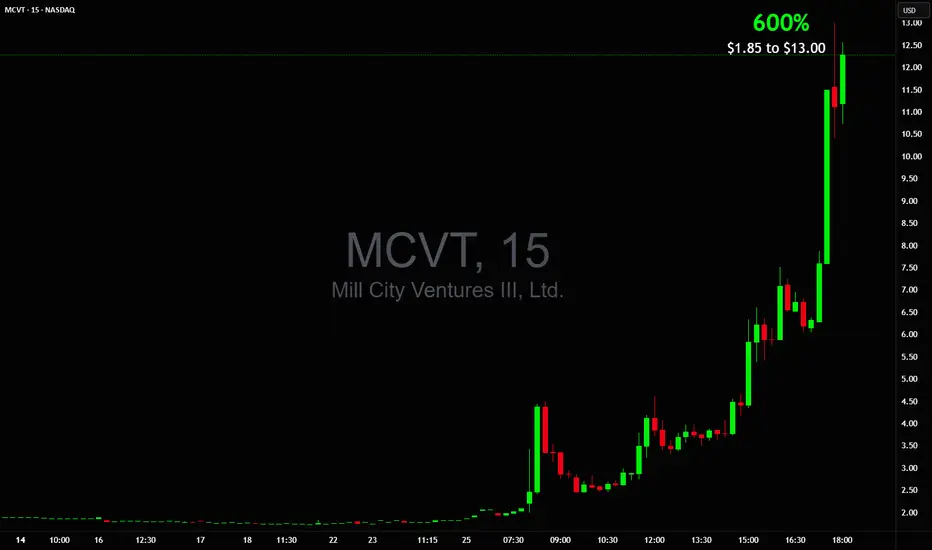
600% vertical $1.85 to $13.00 MCVT after hoursWOW!💥 $1.85 to $13.00 🚀 600% vertical after chat message at 11 am while still in high $3's saying NASDAQ:MCVT 6-7 or much more if volume remains strong, here we are at much more pushing $13
Dogecoin Wave Analysis – 25 July 2025
- Dogecoin reversed from resistance zone
- Likely to fall to support level 0.2000
Dogecoin cryptocurrency recently reversed down from the resistance zone between the key resistance level 0.2630 (former monthly low from December, acting as the resistance now), standing near the upper daily Bollinger Band.
This resistance zone wad further strengthened by the 38.2% Fibonacci correction of the previous sharp downward impulse from December.
Given the clear daily downtrend, Dogecoin cryptocurrency can be expected to fall to the next round support level 0.2000 (target price for the completion of the active correction ii).

XAGUSD SILVER ON 3OTH we are expecting a strong fundamental data .
ADP Non-Farm Employment Change forecast 82K previous -33K
Advance GDP q/q forecast 2.4% previous -0.5% Advance GDP Price Index q/q forecast 2.3% previous 3.8%
Pending Home Sales m/m0.3% 1.8%
7:00pm
USD
Federal Funds Rate
4.50% 4.50%
USD
FOMC Statement
7:30pm
USD
FOMC Press Conference.
we will be watching the data outlook for clear directional bias.

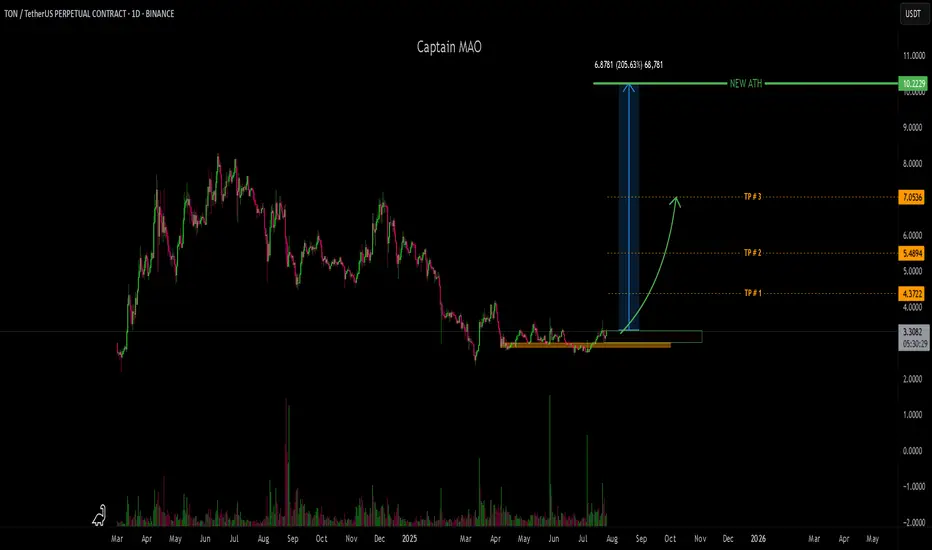
TON/USDT - ATH !!!TON/USDT has been in a sideways consolidation phase for over 100 days, tightly ranging between the $2.90–$3.50 zone. This prolonged accumulation is forming a solid base structure, often seen before major trend reversals in high-cap altcoins.
Recent price action is beginning to show early signs of bullish momentum, with buyers gradually stepping in and volume starting to rise. This area is historically significant and marks a high-probability entry zone, especially if the market confirms the breakout.
S - SONIC 1DSonic lacks the buying volume to break through its resistances.
The project, after a name change, has become Matic 2.
I expect that we'll soon reach support levels of 30 cents and 25 cents after the pullback is complete. If these supports are broken, the next support levels will be 20 cents and 17 cents.
If the 40 to 43 cent resistance breaks with high volume, there's a possibility of growth to 50 cents. If 50 cents is broken, growth to 63 cents becomes possible.

BTCUSD As BTCUSD fell back to 118k, we’ve some good break of structure to the downside with some good momentum seen from the H4 timeframe. Could this be giving us some good bearish sentiment? Or it’s just one of the mini-fluctuations pullbacks as they accumulate enough orders to push the BTCUSD markets even higher.

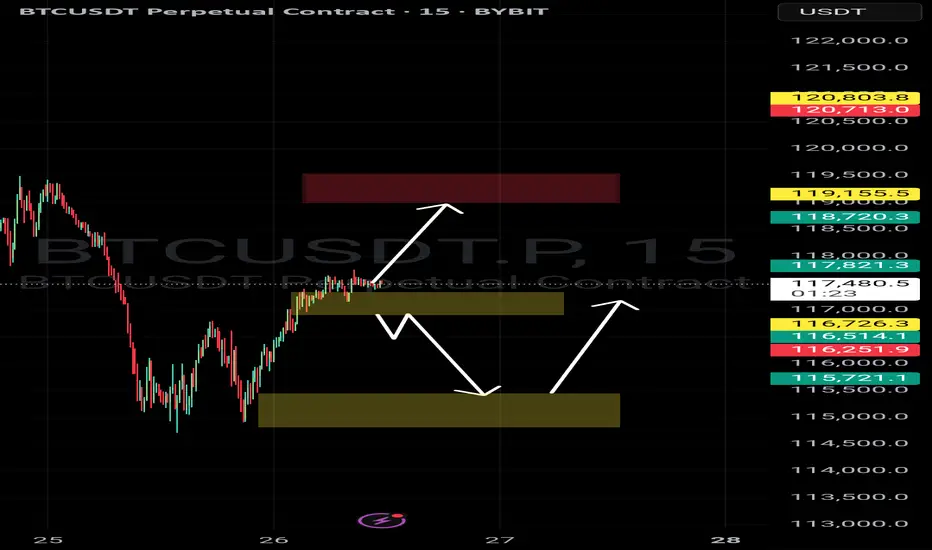
BTC NEXT MOVE UPWARS OR BREAKDOWN?We can see btc hovering over bullish ob
We can expect a pump from here
If breakdown both bullish ob we can look for shorts
Indicator used tuffycalls smc orderblock
GBPNZD Breakdown – Smart Money Turns Fully Bearish🧠 Macro + COT + Sentiment Context
Commitment of Traders (COT) – Asset Managers
Institutional asset managers are significantly net short on GBPNZD, with positioning at its lowest level of the year and declining sharply since May. This reflects a clear bearish stance from smart money and reinforces the current downward pressure.
Sentiment & Momentum Indicators
DPO: -54.9 → Indicates a moderately bearish momentum phase.
Wyckoff: -20.3 → Price is in a distribution phase, suggesting weakness.
Speed: 3.2 → Low acceleration, but directional bias remains bearish.
Market Mood: Neutral, but leaning into oversold territory.
Seasonality (July 1st – Sept 30th)
Historically, GBPNZD performs positively in this period:
3Y: +1.7%, 5Y: +1.6%, 10Y: +2.3%, 15Y: +2.8%
However, in 2025, price is diverging sharply from seasonal norms. The pair is trading against historical patterns, suggesting a seasonal anomaly where institutional flow is dominating historical behavior.
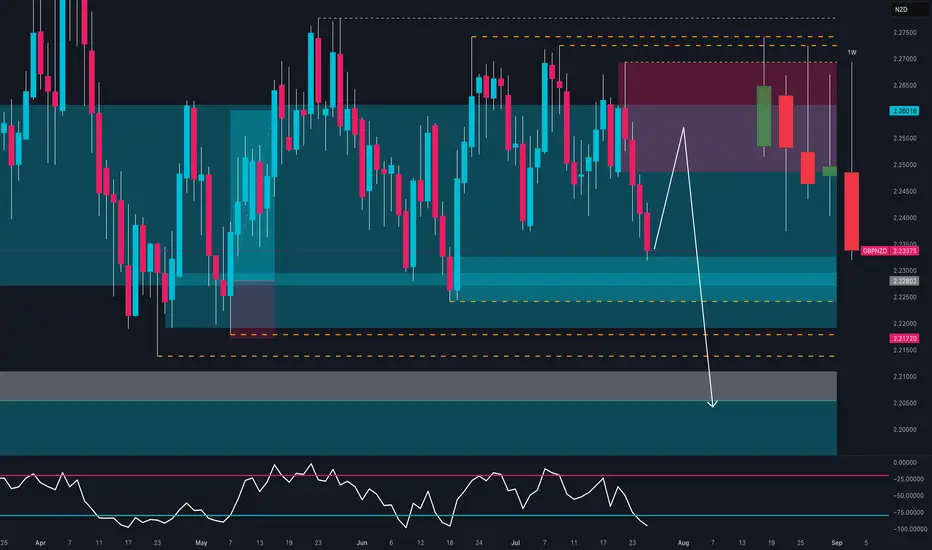
🧱 Technical Outlook (Daily Chart)
GBPNZD had been consolidating in a clear range between 2.2170 support and 2.2750 resistance since May. The pair has now broken down with a strong, full-bodied weekly candle, closing below the 2.2320 demand zone.
Key Technical Zones:
Supply zone (2.2494–2.2659) → A clear rejection zone that initiated the current selloff.
Demand zone (2.2170–2.2300) → Has been tested twice already, increasing the probability of a clean breakdown.
RSI (Daily) → Currently neutral, with a sequence of lower highs and no bullish divergence in sight — indicating weak momentum.
✅ Conclusion & Trade Plan
Directional Bias: Bearish (Short)
Although seasonality typically supports bullish price action for GBPNZD in Q3, the current context is decisively bearish. Institutional positioning, price structure, and sentiment all confirm a potential shift in direction, reinforced by a confirmed weekly breakdown.
Bearish Targets:
📍 First: 2.2170 (recent support test)
📍 Second: 2.2000–2.1900 (April swing low)
📍 Extension: 2.1750 (base of previous accumulation zone)
Invalidation Criteria:
A weekly close above 2.2490 (supply zone breached)
Bullish RSI divergence + weekly recovery candle
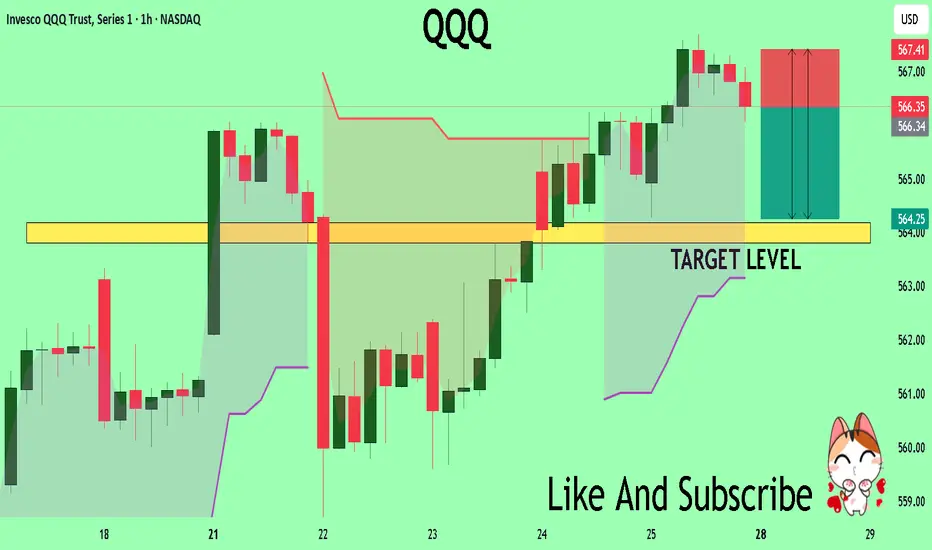
QQQ Massive Short! SELL!
My dear followers,
This is my opinion on the QQQ next move:
The asset is approaching an important pivot point 566.35
Bias - Bearish
Safe Stop Loss - 567.41
Technical Indicators: Supper Trend generates a clear short signal while Pivot Point HL is currently determining the overall Bearish trend of the market.
Goal - 564.18
About Used Indicators:
For more efficient signals, super-trend is used in combination with other indicators like Pivot Points.
Disclosure: I am part of Trade Nation's Influencer program and receive a monthly fee for using their TradingView charts in my analysis.
———————————
WISH YOU ALL LUCK
ZORA.usd eyes on 6 cents: Golden Genesis fib a TOP or RELOAD? ZORA has been flying since Coinbase integration.
Currently range bound by Goldens at 4 and 6 cents.
Look for a Rejection-Short or Break-n-Retest for longs.

KSE 100 Index Technical Analysis 26-07-2025📈 KSE 100 Index Technical Analysis 26-07-2025
The KSE 100 index is moving in an uptrend, albeit at a relatively slowed pace. Although it broke down from the upward channel (marked yellow color), it filled the measuring gap, marked a higher low, and completed its pullback. The index seems poised to resume its upward trajectory.
Key Points
Higher Low Formation: The index has marked a higher low, indicating a potential reversal.
Pullback Completion: The pullback is over, and the index is ready to move upwards.
Powerful and Poised: We find the index very powerful and poised to move upwards.
Target Prices
Immediate TP: 141,500
Final TP: 151,600
Recommendation
The index is always in long, and with the pullback over, we expect it to pursue the mentioned targets.

Reversal Zone: BTC Eyes $124.5K After Potential Liquidity SweepTechnical Analysis (4H Chart)
🔷 Pattern Overview:
Rising Channel: BTC is still respecting a long-term upward channel (black parallel trendlines).
Falling Wedge (Short-Term): Inside the channel, a falling wedge is forming—typically a bullish continuation signal.
The wedge is nearing completion, with a possible fakeout below support to the $110,500–$110,600 zone before a sharp rally.
✅ Price Expectation:
Bear Trap Likely: Price may dip to $110.5K support, triggering stop-losses.
Bullish Breakout Setup: If price rebounds strongly from $110K area, the wedge + channel pattern supports a move toward $124.5K–$125K.
Invalidation: Clean break below the channel and $110K could invalidate the bullish scenario.

CAD/JPY BEARS WILL DOMINATE THE MARKET|SHORT
Hello, Friends!
CAD-JPY uptrend evident from the last 1W green candle makes short trades more risky, but the current set-up targeting 106.478 area still presents a good opportunity for us to sell the pair because the resistance line is nearby and the BB upper band is close which indicates the overbought state of the CAD/JPY pair.
Disclosure: I am part of Trade Nation's Influencer program and receive a monthly fee for using their TradingView charts in my analysis.
✅LIKE AND COMMENT MY IDEAS✅

BCH/USD Chart Analysis: Higher Highs Fuel Bullish Outlook
Price is riding the upper half of the Bollinger Band.
Price recently bounced from the middle band, a bullish continuation signal.
Multiple bullish candles with small upper wicks, showing buyers are in control.
Recent pullbacks have been shallow, indicating strong buying interest on dips.

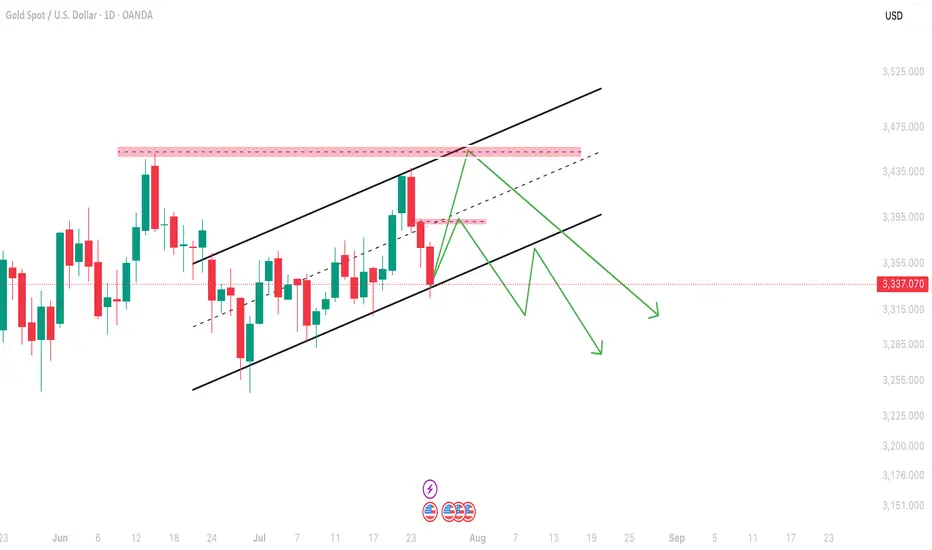
Daily Time frame Structure setAs you can see gold is moving in a channel in daily time frame so according to me next move will be till protected order block i.e 3382-3388 and after that big fall expected and if any candle close above 3384 then 3451 is the next target for gold.
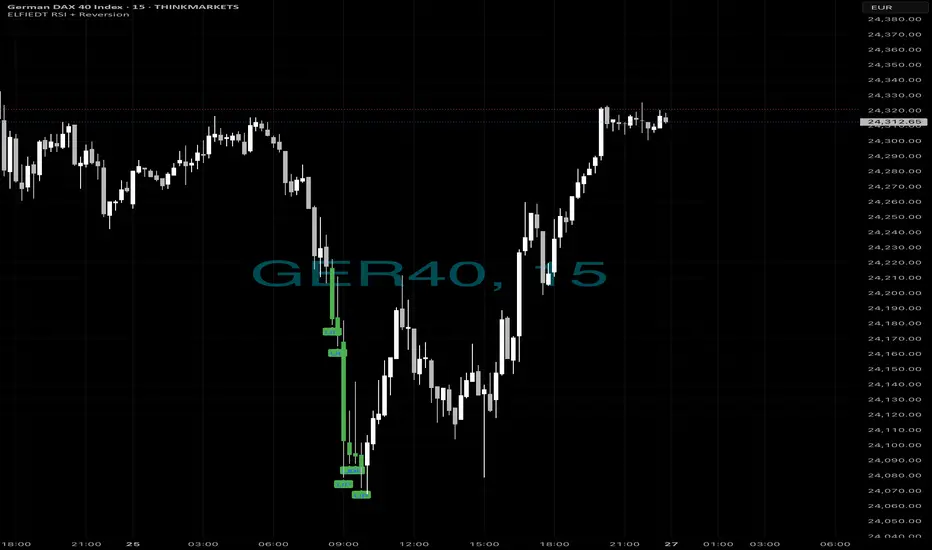
Same as always….📈 The Market Crashed. We Bought the Bottom. Again. 💥
Just another 15-minute chart… or is it?
While panic hit the DAX this morning, ELFIEDT RSI + Reversion was calmly printing BUY after BUY at the dead low. No guessing. No hype. Just precision.
✅ 5 Buy signals within minutes
✅ Picture-perfect mean reversion
✅ Price soared right after
✅ ZERO lag. ZERO repaint.
If you missed this move, don’t worry — this is what my system does.
🧠 Want to learn the logic behind this?
💰 Want to use it live on your own charts?
👉 Drop a 🔥 below if you want access.
👉 DM me “ELFIEDT” to test it out.
👉 Follow for real, repeatable setups.
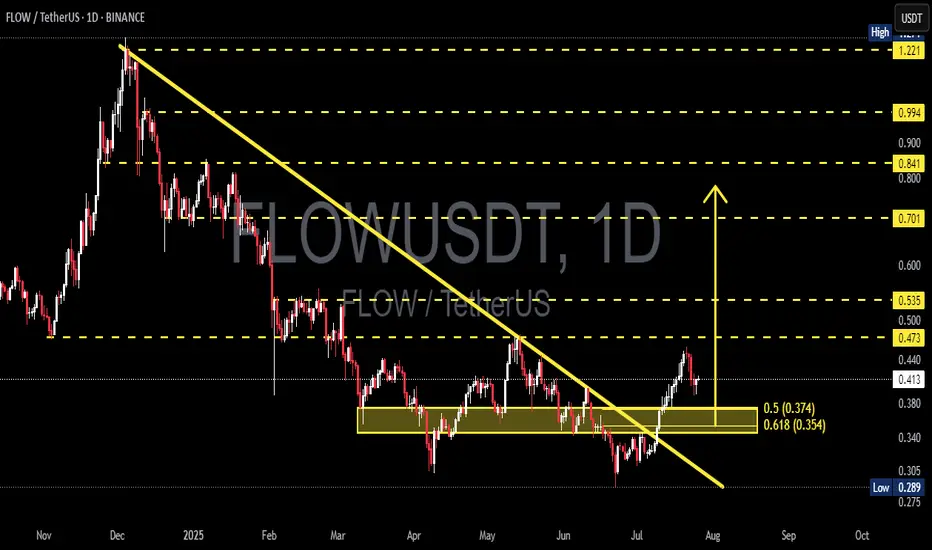
FLOWUSDT Breakout + Golden Pocket Retest: Ready to Explode?After being trapped in a persistent downtrend for months, FLOW has finally shown a major technical signal: a clean breakout from the dominant descending trendline that has defined price action since late 2024.
This breakout isn’t just visually appealing — it’s backed by strong technical confluence, including a key demand zone, Fibonacci retracement support, and potential shift in market psychology.
---
🧠 Technical Structure & Chart Breakdown
📉 Descending Trendline Breakout
The major downtrend line has been decisively broken, indicating that bearish pressure is weakening. This is an early but powerful sign that momentum may now be shifting toward the bulls.
🟨 Consolidation Zone & Flip Area (Yellow Box)
The $0.354–$0.374 zone has acted as:
Former resistance during sideways consolidation
Potential new support after the breakout (support-resistance flip)
📊 Fibonacci Retracement Levels
0.5 Fib = $0.374
0.618 Fib = $0.354
This area, also known as the "Golden Pocket", is one of the most critical levels in technical analysis. It often acts as a launchpad during bullish retests.
---
🟢 Bullish Scenario: Textbook Retest Before a Rally?
If the price holds and reacts positively from the $0.354–$0.374 zone, the following upside targets come into play:
1. 🎯 Target 1: $0.473 – Previous range resistance
2. 🎯 Target 2: $0.535 – Key horizontal level
3. 🎯 Target 3: $0.701 – Historical resistance
4. 🎯 Extended Target: $0.841 – $0.994, potentially up to $1.221 in a strong bullish expansion
For this scenario to play out, bulls must push a daily close above $0.473 to confirm strength and break market structure.
---
🔴 Bearish Scenario: False Breakout Ahead?
If the price fails to hold the golden pocket support:
The breakout could turn into a bull trap
The price may retrace toward:
$0.305 – Local support
$0.289 – The previous low
A strong bearish candle with volume below $0.354 would invalidate the breakout and may signal renewed downward pressure.
---
💡 Conclusion: Critical Decision Point Ahead
FLOWUSDT is now at a pivotal point. The breakout has happened — but the retest zone will decide everything. Will it serve as the foundation for a larger bullish rally, or will it mark the start of another bearish wave?
Watch price action closely around $0.354–$0.374 — that’s where smart money makes their move.
#FLOWUSDT #CryptoBreakout #TechnicalAnalysis #GoldenPocket #RetestZone #FibonacciLevels #AltcoinSetup #CryptoMomentum #FlowAnalysis
EURUSD has broken channal and hovering near resistance.EURUSD has broken channal and hovering near resistance.

Don’t miss this Move on LTBRLTBR forming a classic cup and handle with confluence in the timing of recent institutional exposure.
The chart speaks for itself

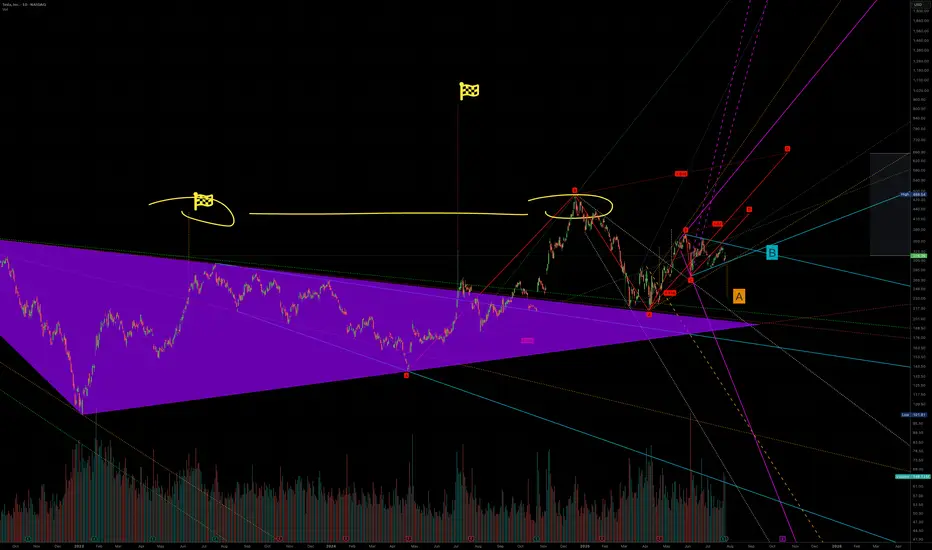
A to 236 or B killing A to 420Tesla is one of those stocks that is heavily manipulated algorithmically. When we were in an uptrend and needed a little push, a large fractal was created that could break a previously formed structure which should have taken us to $236(A). Interestingly, a very strong symmetrical triangle has emerged, influencing this upward movement, and the final price—due to some mystical reason—seems to be $420(B). It’s also worth noting that this whole move is being influenced by another similar structure whose target is above $600. So, if we analyze everything that’s happening, a 12% drop in sales means nothing compared to what Tesla will gain from robots, restaurants, and robotaxis, which I call RRR
REI/USDT CYCLE UPDATE $0,90 by 2025 - Price prediction📈 REI/USDT CYCLE UPDATE – $0.90 by 2025
REI could break above its old ATH, targeting $0.90 in the upcoming cycle. Why?
Upcoming
✅ Ultra-fast blockchain (⏱️ 1.5s block time)
✅ Gas-free or near-zero fees – perfect for DeFi, NFTs & gaming
✅ EVM-compatible – easy migration for Ethereum dApps
✅ Low market cap → high upside potential
✅ Clean tokenomics with staking + resource model
✅ Built for speed, scale & adoption
DATA
Data shows that there is a structural trend going on, where this coin can break soon.
If the altcoin market heats up, REI has the fundamentals & tech edge to explode past previous highs. 🚀
🧠 Watch this one closely.
#REINetwork #Crypto #Altseason #EVM #PricePrediction #Web3
This is not trading advice, but a view from a side of study.

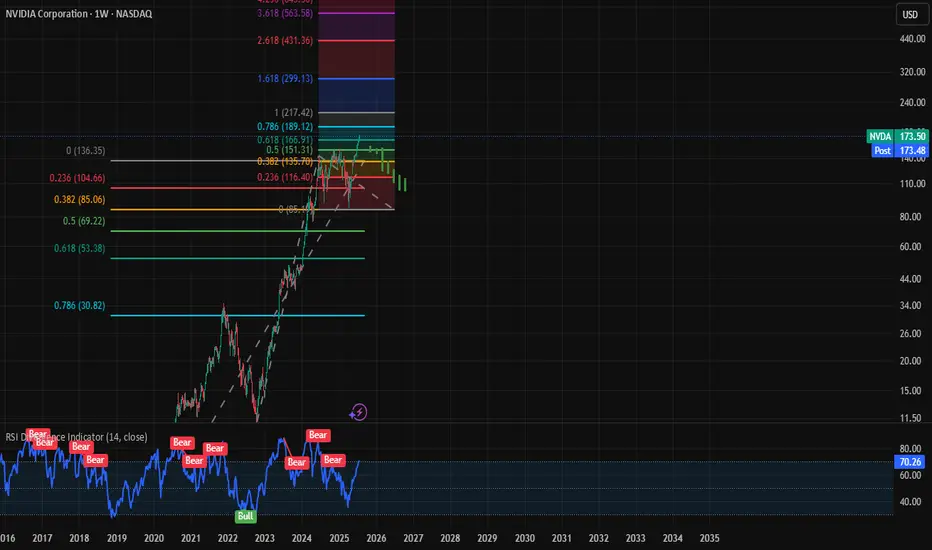
envidia drops from 173.50 to 130 ish or less to 104.00technical prediction based on the volumes pattern when sellers position themselves before the giant crash