S&P 500 Counter-Trend Setup After Bullish Week US500Currently watching the S&P 500 (US500) closely 👀. The index has been in a strong bullish trend 📈, but I’m now evaluating a potential counter-trend opportunity.
Given the strength we’ve seen this week — possibly a “foolish rally” — there’s a chance we’ve either printed or are close to printing the high of the week 🧱. That opens the door for a retracement setup, particularly as we head into Monday’s open 🗓️.
🧠 Trade idea: If we get a bearish market structure break, I’ll be looking to enter short — targeting a 1R take profit initially, and holding a portion for a 2R–3R extension 🎯.
Friday sessions, especially after strong trends, often present clean intraday pullbacks — and when Monday’s low is set early, it can trap late buyers and fuel the move 📉.
⚠️ This is not financial advice — just sharing my thought process and trade plan.
Trend Analysis

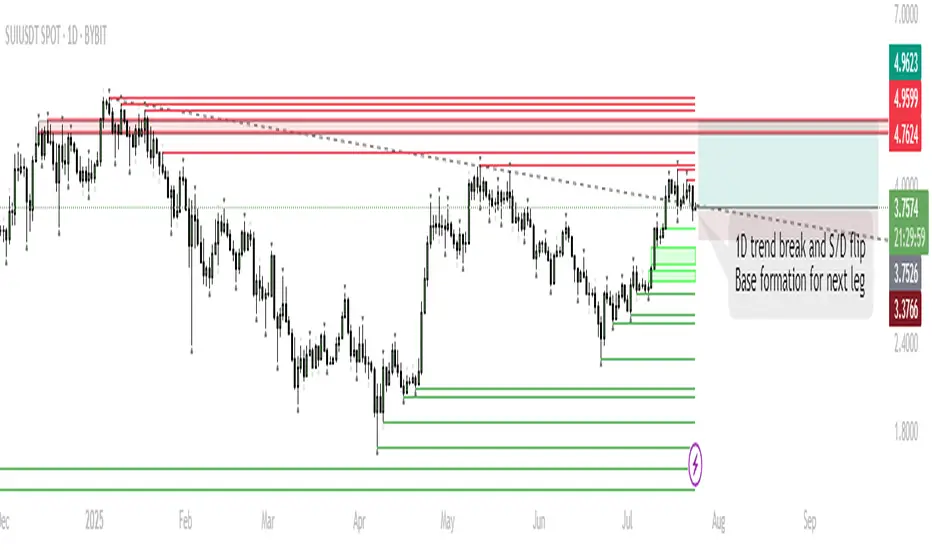
SUI – Base Formation for Next Leg HigherTrend Shift:
SUI has broken the 1D downtrend and is now consolidating above a key supply/demand zone, suggesting accumulation.
Short-Term Range:
Expect ranging/chop as price tests acceptance above broken resistance. This phase could last up to a week.
Trigger for Next Move:
Sustained closes above $4.0 will signal buyers are in control, opening the way for a move higher.
Targets:
If the base holds and SUI establishes above resistance, the next push is toward $5.10–$5.40 (previous highs/ATH zone).
Invalidation:
A sustained move below $3.37 would invalidate the bullish base thesis and open the door for deeper retrace.
SUI has flipped its 1D trend and is now consolidating above a key S/D level. Historically, such consolidations above reclaimed resistance often precede strong trend continuation. While a short-term range is likely as the market digests recent gains, the structure favors an eventual push toward previous highs and potentially new ATHs in August. Patience during this ranging phase is key; the setup remains bullish unless price falls back below $3.37.
What next on XAUUSD? What’s the next possible move on XAUUSD as we saw a slight drop above the all time high this week? We a break below $3200. I anticipate a further decline due to high selling pressure.

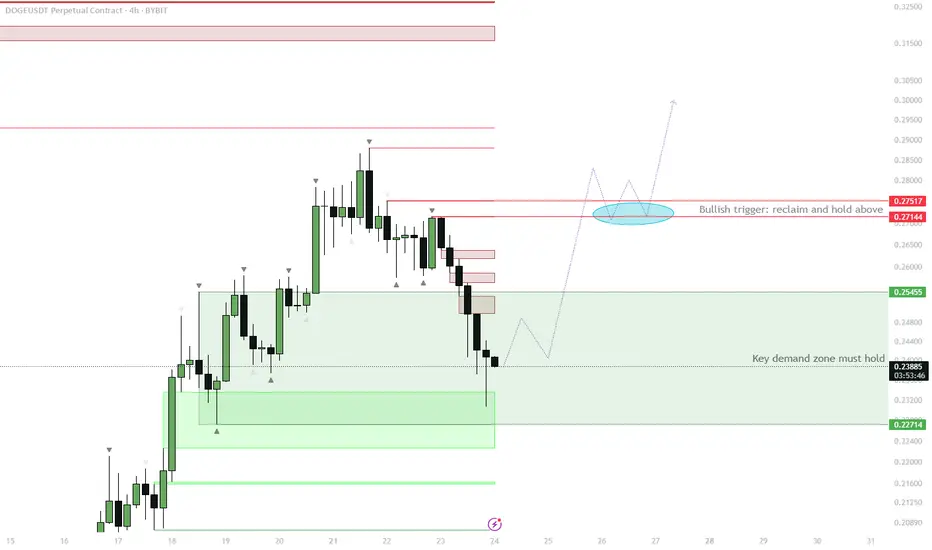
DOGE H4 – Demand Zone Reclaim as Bullish Trigger
Price is currently testing the H4 demand zone (~0.227–0.254).
Watch for price to reclaim the demand zone and close back above 0.254.
If confirmed, expect a move up toward the red resistance cluster at 0.271–0.275.
Consolidation above this area (highlighted in blue) would be a strong signal for continuation.
Invalidation: clean breakdown and acceptance below 0.227 signals failure of demand and deeper retrace.
This setup aims to capitalize on a classic liquidity sweep and demand reclaim. Typically, after taking out the flat open and collecting late shorts/stop losses, strong buying often steps in if demand is genuine. A successful reclaim and consolidation above the previous resistance will set the stage for bullish continuation. If this zone fails to hold, the move is invalidated and lower targets come into play. Waiting for confirmation reduces the risk of a failed bounce.

NZDCHF I Daily CLS I Model 1 I Pullback entryYo Market Warriors ⚔️
Fresh Crypto Analysis— if you’ve been riding with me, you already know:
🎯My system is 100% mechanical. No emotions. No trend lines. No subjective guessing. Working all timeframes. Just precision, structure, and sniper entries.
🧠 What’s CLS?
It’s the real smart money. The invisible hand behind $7T/day — banks, algos, central players.
📍Model 1:
HTF bias based on the daily and weekly candles closes,
Wait for CLS candle to be created and manipulated. Switch to correct LTF and spot CIOD. Enter and target 50% of the CLS candle.
For high probability include Dealing Ranges, Weekly Profiles and CLS Timing.
Analysis done on the Tradenation Charts
Disclosure: I am part of Trade Nation's Influencer program and receive a monthly fee for using their TradingView charts in my analysis.
Trading is like a sport. If you consistently practice you can learn it.
“Adapt what is useful. Reject whats useless and add whats is specifically yours.”
David Perk aka Dave FX Hunter
💬 Comment any Coin I ll give you my quick view

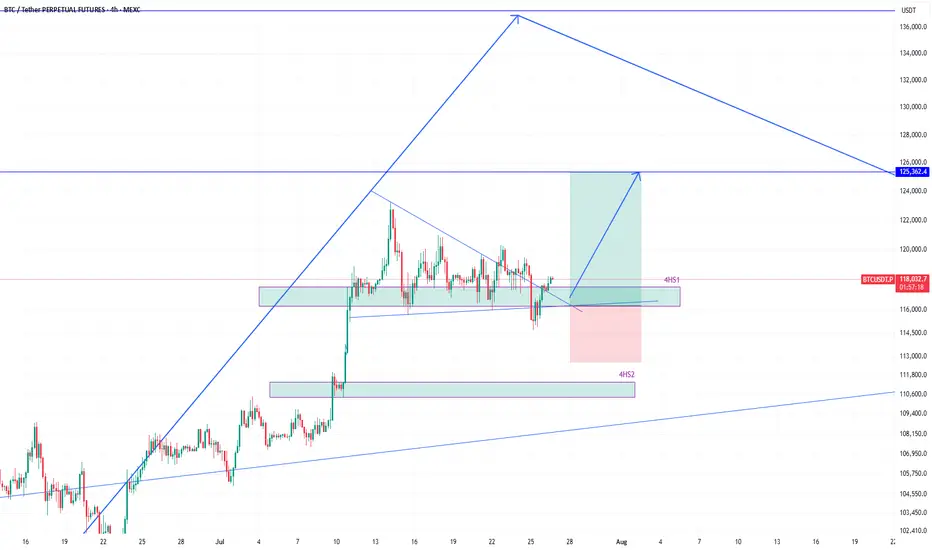
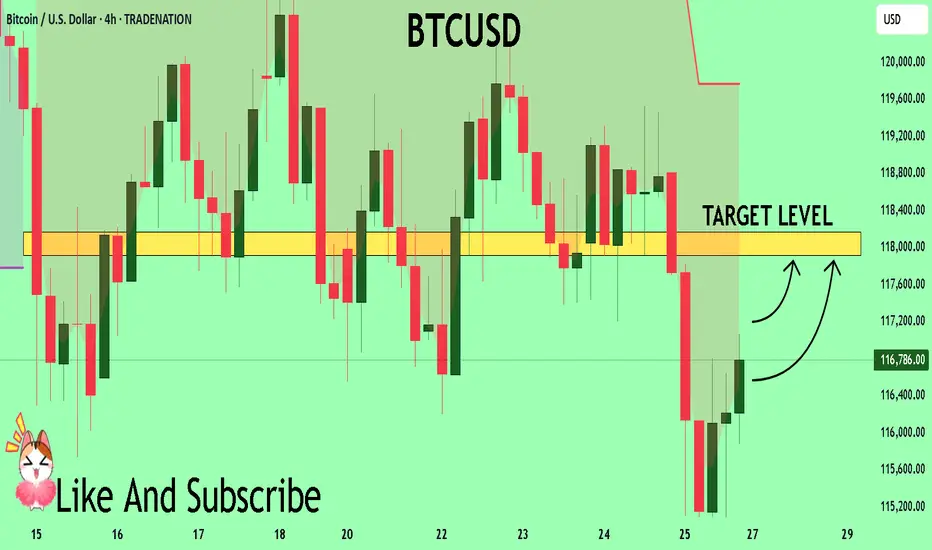
BTCUSDT eyeing 125k next after bounce from 116k zoneEarlier I shared the high time frame view of #BTCUSDT. We know that its heading higher and that helps in holding spot positions.
However, the move to the high frame target will not happen in a straight line, instead with various push to the upside and then subsequent corrections to the down side.
Therefore, as a trader, we must profit from those movements as we see some good high probability setups.
And there is one right now which is a long position.
The price broke 4h support 4HS1, but quickly reclaimed it. That is a sign of demand and strength required to move higher.
Therefore, this presents a long opportunity where the target of this long position should be 125k.
As the price enters into 4HS1 zone, I will scale into long position.
It is quite likely that the price will bounce hard once it taps into 4HS1 zone.
I am talking this long position targeting 125k. What about you? Share with me what you think.
Smart Robbery Plan: LINK/USDT Long Setup | Swing/Day Trade Idea🚨CHAINLINK HEIST PLAN 🚨 | LINK/USDT Market Robbery (Thief Trader Style) 💰🔐
🌍 Hola! Bonjour! Hallo! Marhaba! What’s up, Money Makers & Market Robbers?! 🕶️💵
Get ready to raid the LINK/USDT vault with Thief Trader’s high-precision strategy based on 🔥 Technical & Fundamental fusion 🔥.
This is not your regular setup. This is a robbery roadmap. Designed for swing & day traders, and spiced with smart DCA entries, risk control, and a bold vision. Let's get into the game plan before the market alarms go off! 🚓📉📈
🎯 Master Plan – LINK/USDT | Bullish Setup
Entry:
📌 “The vault is open – grab the loot!”
Start entering long anywhere within the nearest price pullback zone. Use 15m to 30m TFs for sniper-style limit entries.
🛠️ Deploy DCA-style multiple limit orders (layered strategy), preferably around recent swing lows or major liquidity zones.
Stop Loss:
🔐 Place SL just below the 4H swing low wick (Currently at $16.50), adjusting for your risk, lot size, and how many limit orders you're stacking.
Take Profit:
🎯 Main TP target: $21.50
⛔ Or bail early if momentum weakens. Your profit, your decision.
⚡️Scalper’s Memo:
Only scalp on the bullish side – stay with the smart money.
Have deep pockets? Jump in now.
On a budget? Join swing traders and follow the full heist plan.
📉 Use trailing SL to secure profits during volatile rallies.
🔍 Fundamental & Sentiment Snapshot:
LINK is gaining bullish traction due to a combo of strong sentiment, favorable macro outlook, and on-chain flows aligning.
📊 Keep eyes on COT reports, intermarket data, and liquidity metrics.
🧠 Sentiment leans bullish while late bears are trapped in the supply zones above.
🛑 Risk & News Management Alert:
🚨 News releases can spike volatility and mess with clean entries.
📵 Avoid placing trades during high-impact events.
📍 Use trailing stop-loss to protect your running profits and preserve capital.
💖Support the Plan, Join the Heist:
Love the trade idea? 💥Hit the BOOST💥 button and show some love to the strategy that lets traders "rob the market" with confidence.
Every like helps build the strongest heist crew on TradingView.
✅ Stay sharp. Stay patient. Stay profitable.
👤 Thief Trader signing out… until the next raid. 🐱👤💰🚀
#LINK #LINKUSDT #CryptoTrading #ThiefTrader #SwingTrade #DayTrade #DCA #BullishSetup #TradingPlan #TA #RobTheMarket #ChainlinkHeist #SmartMoneyMoves

AAPL HEADING INTO AUG 25'AAPL TOPPED @ 250-260 TO CLOSE OUT 24
BAD Q1
Consistent since then.
Consolidation happened @ key weekly support $194-198 range, solid move up after.
Long Apple currently.
They have the IPHONE 17 releasing in Sept with a few new colors and new back design as well as other affordable options to assist with consumer retention, entry and re entry into the apple hemisphere for consumers.
Earnings July 31st, currently expected to increase YOY for Q3.
I expect earnings to come in strong to assist with the move up to try and work back to retest ATH again.
Long back up to $247 range to close out 2025 for Apple. End of year Q3, Q4 is always their time to shine. Don't think we see a break of ATH in 2025 for Apple though. Retest, to come back down slightly again before major break.

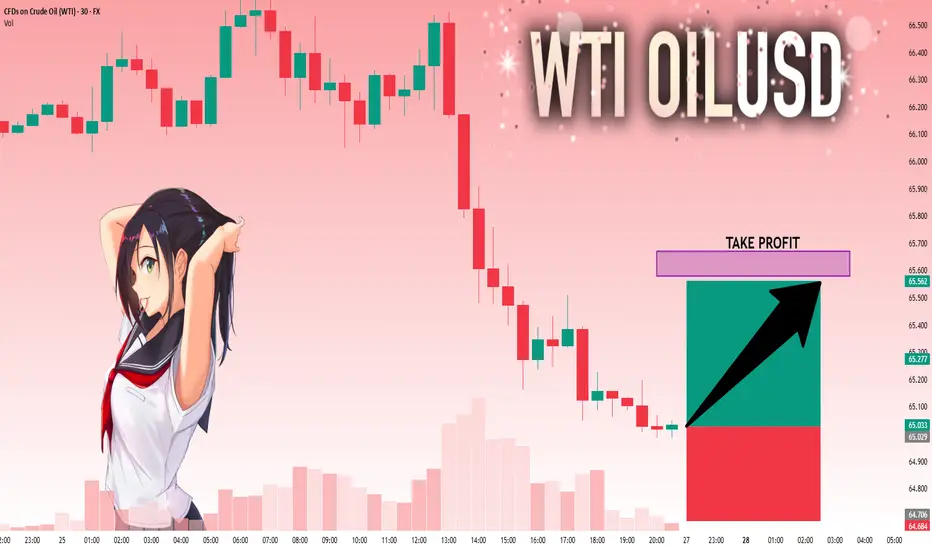
USOIL: Next Move Is Up! Long!
My dear friends,
Today we will analyse USOIL together☺️
The market is at an inflection zone and price has now reached an area around 65.029 where previous reversals or breakouts have occurred.And a price reaction that we are seeing on multiple timeframes here could signal the next move up so we can enter on confirmation, and target the next key level of 65.579.Stop-loss is recommended beyond the inflection zone.
❤️Sending you lots of Love and Hugs❤️
TOTAL 2 # 002 ( GOOD for Altcoins )Hello dear traders .
Good days .
First of all thanks for your comment and support.
----------------------------------------------------------------------
Total 2 is growing in rising wedge .
With refer to the last Daily Bullish Gann Square ( Blue Square) and Bearish Gann Square and with considering bitcoin dominance which start its correction, expected to ALTCOIN season started and it can rise up to 8-9 T dollars which is looks good opportunity for investment together great benefits within a year .
Safe trades and good luck

BTCUSD What Next? BUY!
My dear friends,
Please, find my technical outlook for BTCUSD below:
The price is coiling around a solid key level - 11678
Bias - Bullish
Technical Indicators: Pivot Points High anticipates a potential price reversal.
Super trend shows a clear buy, giving a perfect indicators' convergence.
Goal - 11791
About Used Indicators:
The pivot point itself is simply the average of the high, low and closing prices from the previous trading day.
Disclosure: I am part of Trade Nation's Influencer program and receive a monthly fee for using their TradingView charts in my analysis.
———————————
WISH YOU ALL LUCK
Buy zone for GBP USDEasy buy on GBP_ Very good entry point after a massive rally,,, pull back zone.. and its a careful buy point

Dow Jones Potential UpsidesHey Traders, in the coming week we are monitoring US30 for a buying opportunity around 44,650 zone, Dow Jones is trading in an uptrend and currently is in a correction phase in which it is approaching the trend at 44,650 support and resistance area.
Trade safe, Joe.

PENDLEUSDT 1D#PENDLE has broken above the symmetrical triangle resistance on the daily chart and has completed a successful retest.
Our targets for this breakout are:
🎯 $5.109
🎯 $6.006
🎯 $7.147
🎯 $7.803
🎯 $8.913
⚠️ As always, use a tight stop-loss and apply proper risk management.

Price approaches a resistance level one more time!EURJPY recently approached a monthly resistance level. It’s a crucial level where we’re monitoring price closely to see either a breakout or the resistance level for the first time since 2008 (over 17years now) coming week as we’re going to keep a close watch from the intraday perspective to help us spot when market will either start to break above the resistance to start to decline from that high

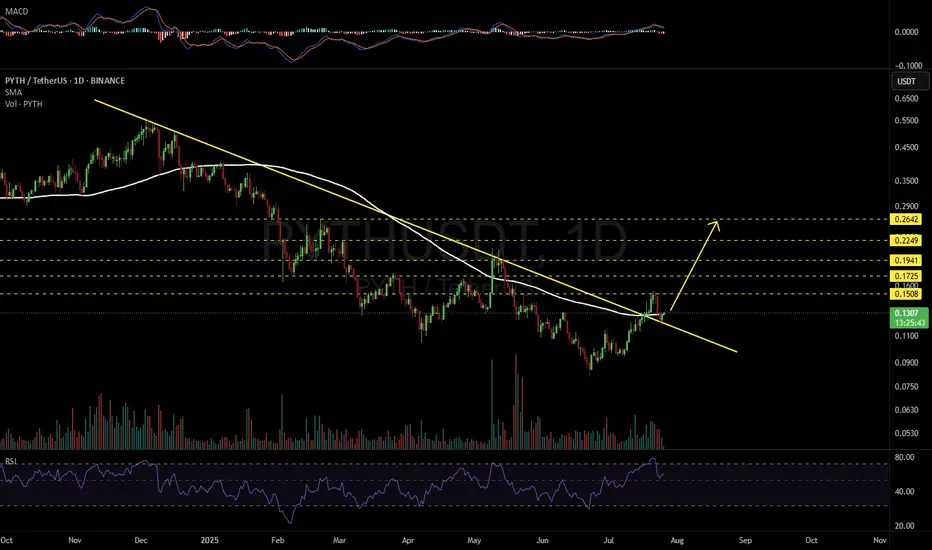
PYTHUSDT 1D#PYTH has broken above the descending trendline, and the retest has been completed successfully. It is now on the verge of breaking out above the daily SMA100.
If the daily candle closes above it, the upside targets are:
🎯 $0.1508
🎯 $0.1725
🎯 $0.1941
🎯 $0.2249
🎯 $0.2642
⚠️ As always, use a tight stop-loss and apply proper risk management.
SRF Multi year breakout
Long Leg Candle form with volume
All moving average are in line
RSI also above 60 D / W /W
Volume Growth

EURCAD Will Go Down! Short!
Please, check our technical outlook for EURCAD.
Time Frame: 15m
Current Trend: Bearish
Sentiment: Overbought (based on 7-period RSI)
Forecast: Bearish
The market is approaching a significant resistance area 1.608.
Due to the fact that we see a positive bearish reaction from the underlined area, I strongly believe that sellers will manage to push the price all the way down to 1.607 level.
P.S
The term oversold refers to a condition where an asset has traded lower in price and has the potential for a price bounce.
Overbought refers to market scenarios where the instrument is traded considerably higher than its fair value. Overvaluation is caused by market sentiments when there is positive news.
Disclosure: I am part of Trade Nation's Influencer program and receive a monthly fee for using their TradingView charts in my analysis.
Like and subscribe and comment my ideas if you enjoy them!

EU possible buy idea?7 days ago, I shared a bullish idea that remains valid despite price failing to hold above 1.04321.
Current Market Analysis:
Price appears to be forming an Elliot Wave 2 (a-b-c) correction.
Key Levels to Watch:
- 38.2% Fibonacci retracement level (minimum required for Wave 2)
- 88.7% Fibonacci retracement level (maximum allowed for Wave 2 to maintain bullish bias)
Trade Plan:
With my initial position at break-even, I'll employ dollar-cost averaging for additional buys targeting 1.065 :
1. 50% Fibonacci retracement level
2. 61.8% Fibonacci retracement level
3. 78.6% Fibonacci retracement level
Stop Loss: 1.017
This is not a financial advice but if you must take the trade, apply proper risk and money management while scaling into the trade.

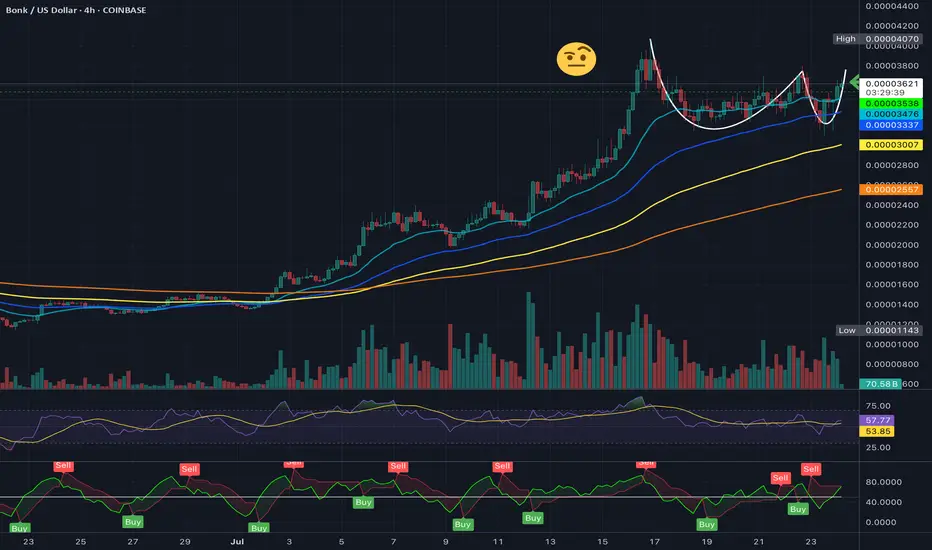
Its an ugly Cup & Handle, But one Nonetheless....$BONKThis isn't the prettiest formation of a Cup & Handle but playing out as one currently. A Pick up in volume should send this shit. LFG!
XAUUSD – The assassin returnsGold is showing a weak reaction around the 3,375 zone — a previous supply area — with RSI dipping into oversold territory but failing to bounce significantly. The chart reveals layered FVG traps, hinting at a potential -1.5% drop toward 3,324 within the next 18 hours.
Bearish catalyst: The U.S. jobless claims have dropped to a 3-month low → labor market remains strong → Fed likely to keep interest rates high → stronger USD, weaker gold.
Preferred setup:
SELL if price gets rejected at 3,375
SL: 3,390
TP: 3,324 – 3,310
