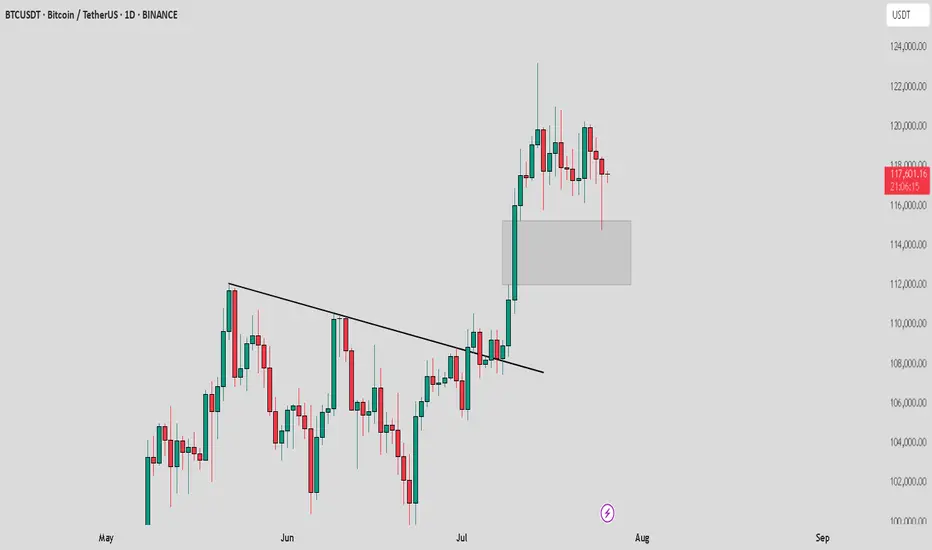
BTC /USDT : Getting support from FVG BTC Support from FVG - Bullish & Bearish Scenarios:
Bullish Scenario:
BTC is holding support from the FVG. As long as BTC stays above this zone, the market remains bullish. A bounce here could lead to further upside.
Bearish Scenario:
If BTC breaks below the FVG, it signals a potential downtrend. A breakdown may lead to more pain and further declines in the market.
Tips:
1. Wait for Confirmation: Look for a clear candle close above/below FVG for validation.
2. Risk Management: Set stops near the FVG to manage potential losses.
3. Monitor Volume: Strong volume during support retests increases bullish potential.
4. Stay Flexible: Be prepared for a market shift if BTC breaks the FVG support.
Trend Analysis
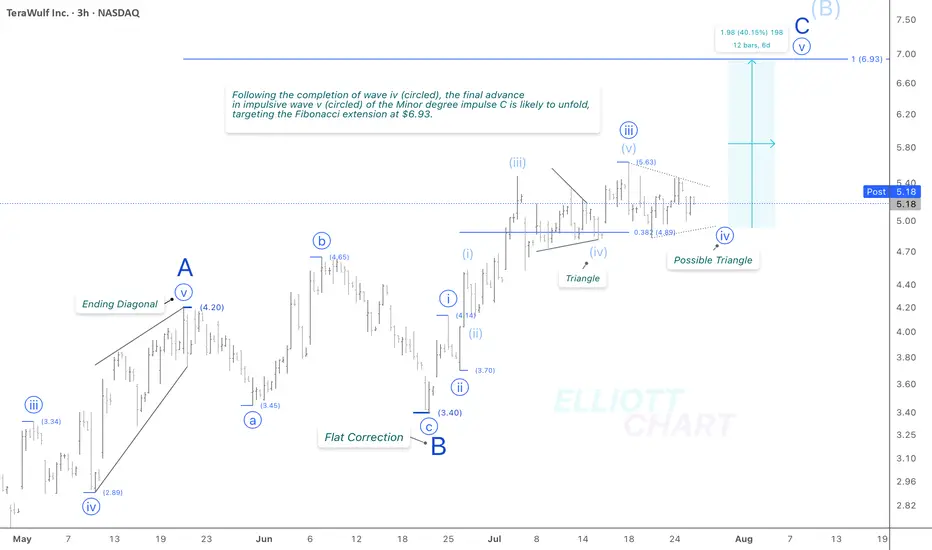
WULF / 3hWave Analysis >> While the overall outlook on NASDAQ:WULF remains consistent with the previous analysis, the ongoing sideways volatility suggests a need to reassess the wave count on the final stages of Minor degree impulsive advance in wave C.
The Fib extension target remains intact >> 6.93
Trend Analysis >> Upon completion of Minor degree wave C, the countertrend advance of Intermediate degree wave (B), which has been unfolding since April 9, is likely to give way to a decline in wave (C) of the same degree. This downtrend might begin in the coming days and potentially extend through the end of the year!!
NASDAQ:WULF CRYPTOCAP:BTC BITSTAMP:BTCUSD MARKETSCOM:BITCOIN
#CryptoStocks #WULF #BTCMining #Bitcoin #BTC
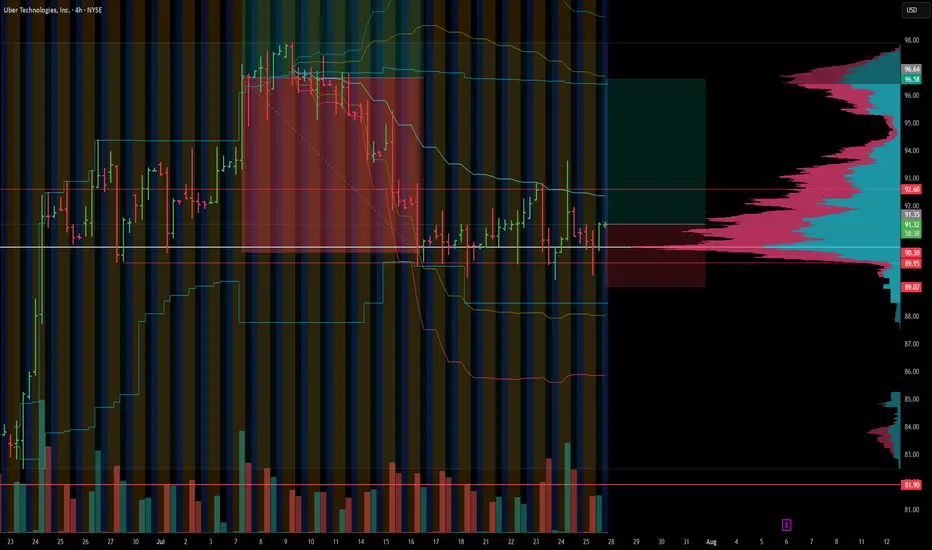
Repeating UBER longUBER has found the support at 91 level and will likely retest initial supply area.
SPX chit chat... we're still up for nowAfter that crazy April 2025 crash, it feels like we should not be this high so fast... that's how I felt before too. But the rising channel is holding up right now. We are approaching the top. In previous times, the market grinded even higher (COVID pandemic was the last example).
Today we squeezed out new ATHs. The month ends next week and a new one begins. Less fear; more charts for the rest of the year.
See you in August!

USDJPY 30Min Engaged ( Bullish Entry Detected )————-
➕ Objective: Precision Volume Execution
Time Frame: 30-Minute Warfare
Entry Protocol: Only after volume-verified breakout
🩸 Bullish From now Price : 146.500
➗ Hanzo Protocol: Volume-Tiered Entry Authority
➕ Zone Activated: Dynamic market pressure detected.
The level isn’t just price — it’s a memory of where they moved size.
Volume is rising beneath the surface — not noise, but preparation.
🔥 Tactical Note:
We wait for the energy signature — when volume betrays intention.
The trap gets set. The weak follow. We execute.

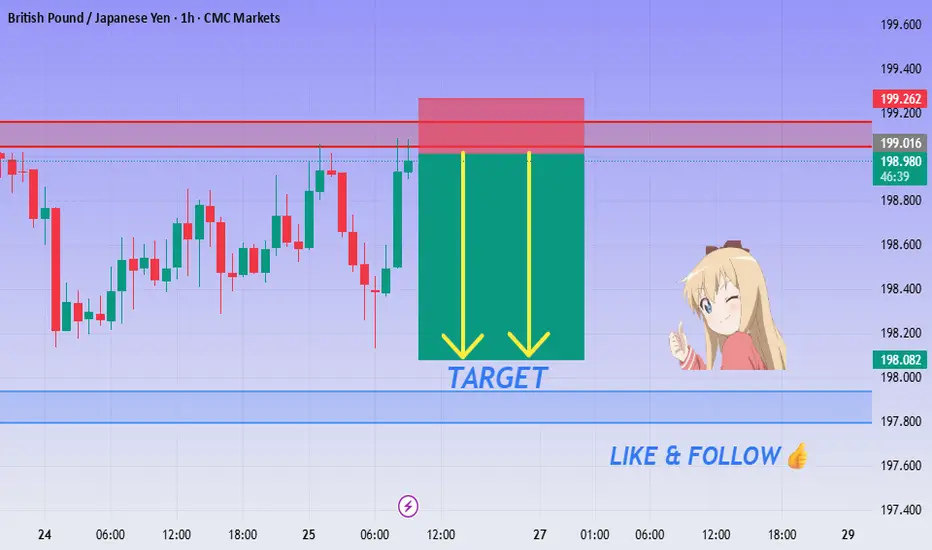
GBP/JPY Breakdown Alert - Bears Taking Control!💙 GBP/JPY Resistance Rejection ! SELL Setup Activated!
👩💻 Dear traders,
After analyzing GBP/JPY on the 1H timeframe, we have a clean short opportunity developing from a key resistance zone around 199.00 – 199.26. Price has stalled and rejected strongly, signaling potential for a bearish move.
Bias – Bearish
🎯 Target – 198.20
🎯 Target – 197.90
🎯 Final Target – 197.70
🛑 Safe Stop Loss – 199.26
📊 Reasoning:
– Price rejected a clear resistance/supply zone
– Red box marks historical rejection area
– Yellow arrows indicate downside momentum zone
– Bearish pressure forming at the top of the range
– Excellent intraday short with clean R:R structure
🍀 Stay patient, trust your levels, and trade smart!
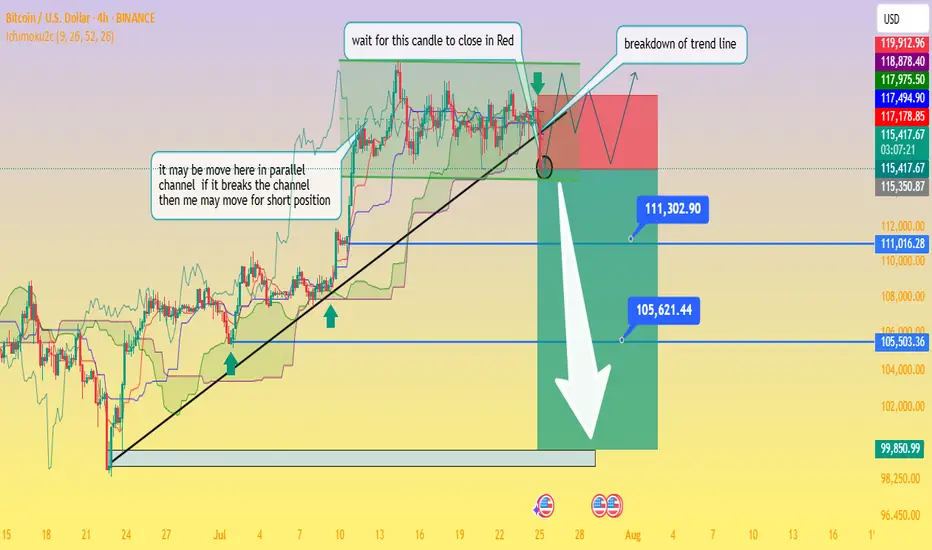
Critical Breakdown: BTC/USD Poised to Fall — Waiting on H4 CloseAnalysis of the BTC/USD 4‑Hour Chart
From the chart you provided, here's how the technical situation looks:
Ascending trendline support has been tested multiple times and was recently breached this afternoon, signaling a possible shift from the bullish setup to a bearish continuation.
The price is now trapped within a descending triangle formation beneath a well‑defined swing high resistance zone. This reflects indecision in the market, with neither buyers nor sellers in clear control
Business Insider
+15
Fxglory Ltd
+15
Bitcoin News
+15
.
Key levels to monitor:
Support zone: ~$115,500, extending down to ~$111,300 and ~$105,600 as deeper targets if bearish momentum strengthens.
Resistance zone: ~$119,000–120,000 area, forming strong overhead supply
Economies.com
DailyForex
Bitcoin News
.
The chart’s annotations align with a classic breakout strategy—with the caveat: wait for a confirmed close below the trendline before considering short positions (as noted in your “wait for this candle to close in red” comment).
Breakout confirmation would likely pave the way toward your indicated profit zones near ~$111k and ~$105k, with a larger potential down to ~$99.8k if further downside pressure builds.
🔍 What the Broader Market Signals
Technical sentiment from sources covering today’s analysis shows BTC/USD hovering just under $120,000, stuck within the defined range of $115.5k support to $120k resistance
Economies.com
.
While there’s still neutral momentum in indicators like RSI and MACD, the short-term direction leans bearish if the breakdown is confirmed on the H4 timeframe
Fxglory Ltd
.
Analysts emphasize that sustained movement above $116.5k could retarget resistance near $119–120k. A failure there and a move below $115.5k may thrust price deeper toward your downside zones
DailyForex
.
✅ Trading Strategy Overview
Scenario Trigger Target Levels
Bearish Breakdown H4 candle closes below trendline ~$115.5k $111.3k → $105.6k → possible $99.8k zone
Bullish Rejection Bounce back above ~$116.5k and trending above resistance $119k–120k retest, potential breakout if sustained
Neutral / Wait-and-see No decisive candle close yet Hold for confirmation
⛳ Final Thoughts
chart highlights a critical point: don’t act prematurely. Wait for a decisive H4 candle close below the trendline before committing to shorts. Confirmed bearish action around the breakout could open the path to the lower targets you identified. However, if price rebounds above support and climbs above $116.5k, a short-term retest of $119k–120k is still in range.
Traders should maintain prudent risk management—watching the unfolding price action around these pivot points without overreaching. Let me know if you'd like help crafting entry/exit zones or risk profiles for this setup!
ICL on the Daily TFScrip is currently at around 87. Took a correction of 0.382 Fib level and moving up and there is a potential Bearish ABCD Reversal pattern Point D at around 109-110.lets c how it plays further, hopefully InSha Allah.

TONUSD TONUSDT TONCOIN mid- to long-termIn my view, we are still in the accumulation phase. The current price action and reactions at key levels suggest ongoing accumulation.
🔻 Bearish Scenarios:
In the short term, a retest of the lower boundary of the accumulation zone (purple box) is possible if the market weakens.
The worst-case scenario would be a move down to the lower green support zone, which has historically triggered strong bullish reactions. This is a critical demand area.
🔼 Bullish Scenarios:
A confirmed breakout and hold above the white line (within the purple box) would signal strength and a potential move higher.
We would then likely see a retest of the upper boundary of the accumulation zone.
A breakout and consolidation above the yellow line would open the door for a move toward the wider yellow channel, which could act as a final target zone
🚨 High-Risk Zone:
The yellow channel might represent the final phase of the current move.
From there, we could see either a sharp correction
Or, if trend strength and macro conditions allow, a continuation towards a new ATH (purple line).
📌 📌 📌 :
All marked lines and zones represent key support and resistance levels.
Price reaction at these areas will be crucial for decision-making.
As always, risk management and trend confirmation are essential.

ETHBTC x ETH.DETHBTC x ETH.D
Ethereum bitcoin pair and ethereum dominance will gain upward momentum with the reaction it receives from the major support line in 2019
The better Ethereum is, the better Altcoins will be.

BANK NIFTY S/R for 28/7/25Support and Resistance Levels:
Support Levels: These are price points (green line/shade) where a downward trend may be halted due to a concentration of buying interest. Imagine them as a safety net where buyers step in, preventing further decline.
Resistance Levels: Conversely, resistance levels (red line/shade) are where upward trends might stall due to increased selling interest. They act like a ceiling where sellers come in to push prices down.
Breakouts:
Bullish Breakout: When the price moves above resistance, it often indicates strong buying interest and the potential for a continued uptrend. Traders may view this as a signal to buy or hold.
Bearish Breakout: When the price falls below support, it can signal strong selling interest and the potential for a continued downtrend. Traders might see this as a cue to sell or avoid buying.
MA Ribbon (EMA 20, EMA 50, EMA 100, EMA 200) :
Above EMA: If the stock price is above the EMA, it suggests a potential uptrend or bullish momentum.
Below EMA: If the stock price is below the EMA, it indicates a potential downtrend or bearish momentum.
Trendline: A trendline is a straight line drawn on a chart to represent the general direction of a data point set.
Uptrend Line: Drawn by connecting the lows in an upward trend. Indicates that the price is moving higher over time. Acts as a support level, where prices tend to bounce upward.
Downtrend Line: Drawn by connecting the highs in a downward trend. Indicates that the price is moving lower over time. It acts as a resistance level, where prices tend to drop.
Disclaimer:
I am not SEBI registered. The information provided here is for learning purposes only and should not be interpreted as financial advice. Consider the broader market context and consult with a qualified financial advisor before making investment decisions.

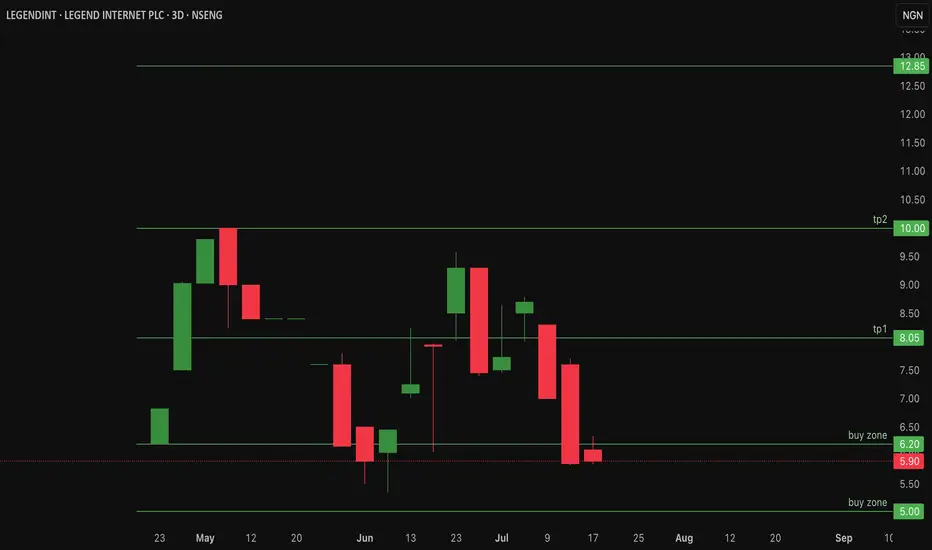
$legendint Could LegendInt be undervalued? - 40% RetracementLegend Internet Plc on the Nigerian Stock Exchange (NGX) was listed on April 24, 2025, under ticker LEGENDINT. The company offers fiber-to-the-home (FTTH) services in Abuja and digital products like LegendMail and MailPay.
IPO price: ₦5.64 per share, closed first trading day at ₦6.20. Previously NSENG:LEGENDINT has reached an all time high of 10naira/share and has currently retraced over 40%
Current price: 5.90
As a newly listed small-cap, it faces low visibility and high volatility, contributing to weak investor demand and price devaluation. It would be interesting to see what the future holds for #legendint.
Upside resistance at 8naira and 10naira per share
Buy zone range is between 5 -6.2naira/share
Price action looks like an inverse cup and handle pattern - Not a bullish pattern!
Invalidation for this Legend Idea is under 5naira per share!
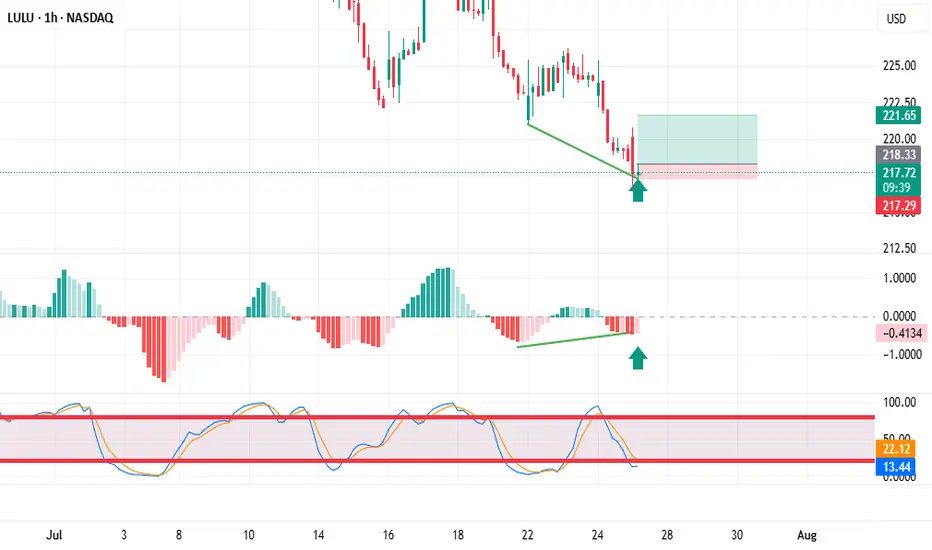
Trading stocks using Dr. Elder's "Three Screen Method"The first thing I do is check the weekly chart. Here I see excellent price divergence relative to the MACD indicator
Then I switched to the daily chart and saw the same excellent divergence as on the weekly chart.
The hourly chart also showed excellent divergence. placed a pending buy order above the candle marked with an arrow.
EUR USD longas trend suggest and as today is Friday everything should settle this trade can be viable but the question that the target will hit would not be answered today
Please note: This is for educational purposes only and not a trading signal. These ideas are shared purely for back testing and to exchange views. The goal is to inspire ideas and encourage discussion. If you notice anything wrong, feel free to share your thoughts. In the end, to learn is to share !

eurgbp Sell positionthe asset has reached a strong supply zone triggering stop losses. we expect price to drop from here.

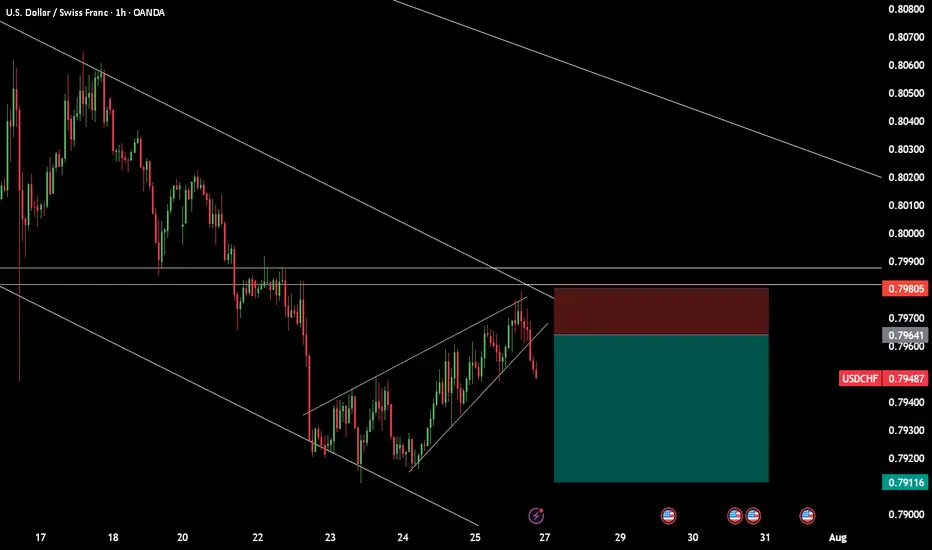
USDCHF sellUSD/CHF is currently in a downtrend, with the US Dollar exhibiting weakness throughout the year. From a technical standpoint, the pair appears poised for further decline, given the formation of a bearish flag. If considering this trade, it's essential to prioritize risk management or look for a potential retest of the flag's resistance level (or the apex of an ascending wedge, if applicable) before entering a short position.

BTCUSD Key Supply Zone Rejection – Bearish Target Mapped BTCUSD Key Supply Zone Rejection – Bearish Target Mapped (Educational Breakdown)
⸻
🧠 Technical Analysis (1H Chart):
• Range Structure: BTCUSD is currently trading within a well-defined consolidation range between the Resistance Zone ($119,850–$120,591) and the Support Zone ($116,937).
• Volume Profile (VRVP): Volume is noticeably thick near the mid-range, suggesting accumulation/distribution behavior. Price is struggling to break above the value area high near $120K.
• Resistance Rejection: After testing the upper supply zone, price failed to sustain bullish momentum and is showing signs of exhaustion – a possible sign of institutional selling.
• Target Zone: If price rejects this resistance again, a strong move toward the target level of $117,260 is expected. This aligns with:
• Mid-range liquidity sweep
• Low-volume node (LVN) below current price
• Fair Value Gap fill near $117,200–$116,900
⸻
🧩 Key Concepts Highlighted:
• Support & Resistance Mapping
• Volume Profile Readings
• Institutional Order Flow Bias
• Target Projection using Smart Money Concepts
⸻
⚠ Educational Insight:
This setup is a perfect example of how to combine Volume Profile + Price Action to identify liquidity traps and smart entries. Always wait for confirmation near key zones — not every level breaks!
⸻
✅ Trade Plan (Not Financial Advice):
• Watch for bearish engulfing/rejection wick at resistance
• Short entry below $119,000 with SL above $120,600
• Target: $117,260 / Final TP: $116,937 zone

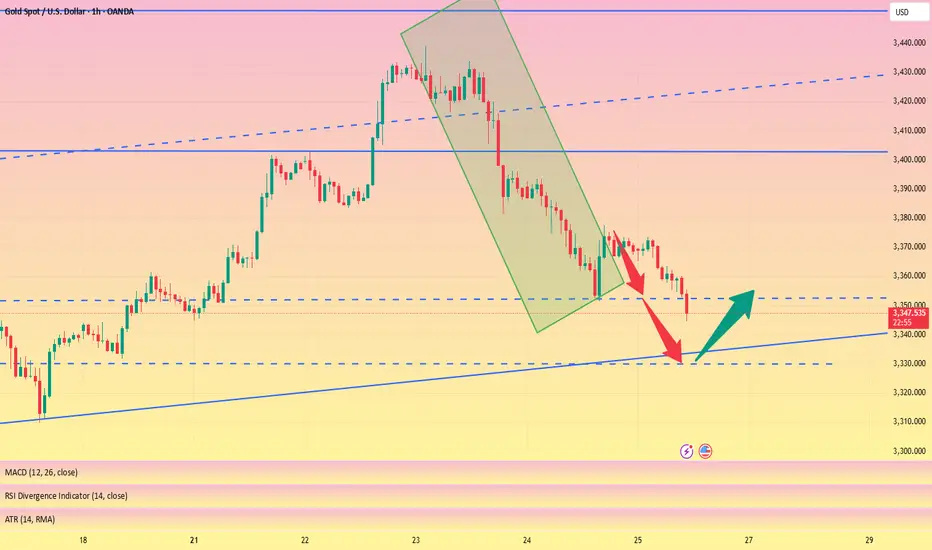
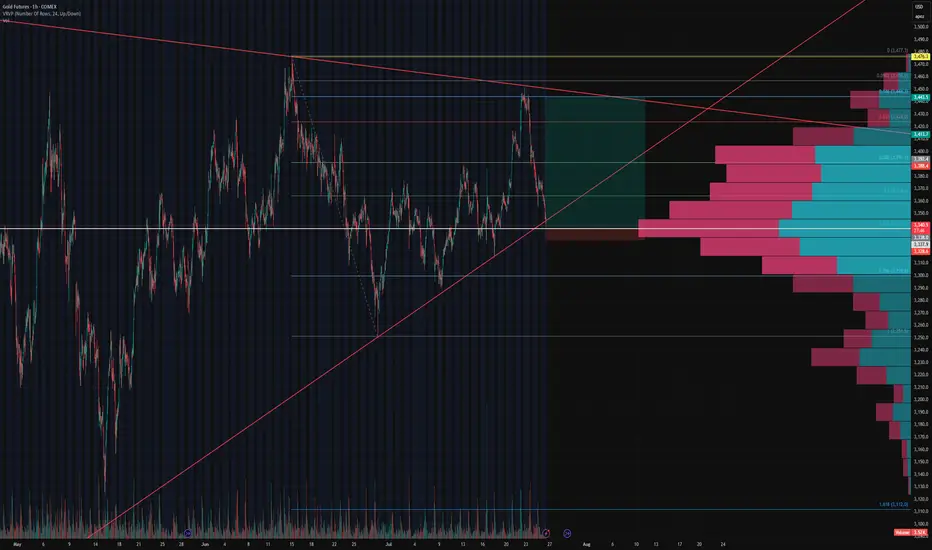
Gold Futures Update – 0.5 Fib Stop Hit, Eyes on 0.618 ConfluenceGold Futures Update – 0.5 Fib Stop Hit, Eyes on 0.618 Confluence
Our initial long setup at the 0.5 Fibonacci retracement level has been stopped out, but the structure remains constructive.
Price is now approaching a key confluence zone at $3,336 , where:
The 0.618 fib retracement from the recent swing low to high aligns perfectly,
The ascending trendline support (respected multiple times since May) intersects, and
The oint of Control (POC) from the visible volume profile shows dominant volume transacted.
This area represents a high-probability support level where bulls may attempt to defend again. We’re monitoring for reaction and potential entry signals around this level. A break below would invalidate the rising wedge structure and shift bias toward lower fib extensions.
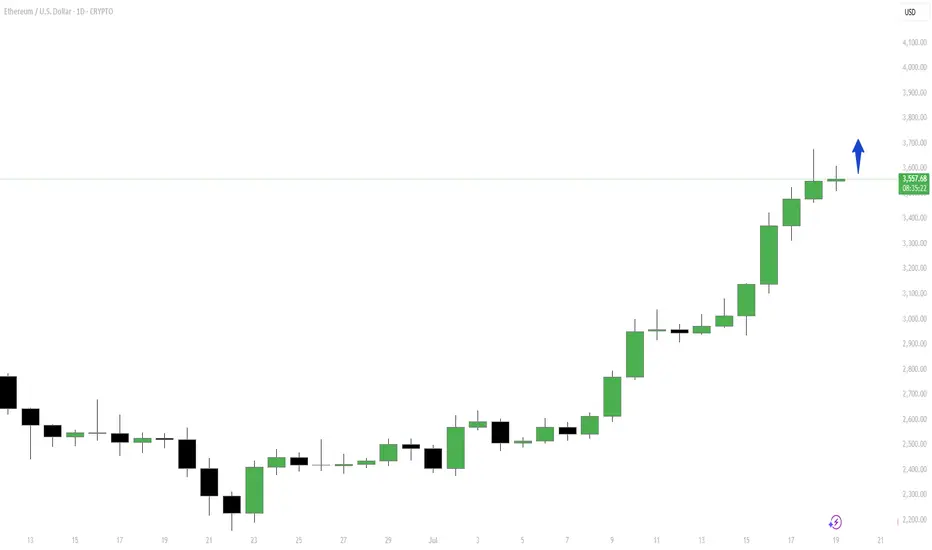
Strategy Idea: “React, Don’t Predict” ETH at Decision ZoneHey Traders, Ethereum recently made a strong move up to around $3,600. Now it’s slowing down, and we’re at a key decision point. Two things can happen from here:
Option 1 – Pullback:
If the price drops, watch the $3,200–$3,300 zone. That area could act as support. If a strong bullish candle forms there (on the daily or 4H chart), it could be a good buying opportunity.
Option 2 – Breakout:
If ETH stays above $3,550 and breaks the recent high with strong momentum, price could move toward $3,800 or even $4,000. Only buy if the breakout is clear and strong.
Basic Plan for New Traders:
Wait for confirmation before entering
Don’t buy the top
Use stop loss to manage risk
Only risk what you can afford to lose
Be patient. No setup = no trade
Reminder:
We don’t predict, we react. Let the chart show the move, then decide. Stay safe and stick to your plan.
Don't forget to follow me, boost this content, and comment if you like this strategy idea or have any questions.
-Neo
SPX More upside potentialI've revised my previous count based on recent price action. I now see a potential minor Wave 4 (of Intermediate Wave 5) forming around the 6,500 level. This could present a reasonable opportunity to take some % profits, (for the cautious or short term traders) though I recommend being prepared to re-enter, as I still believe we are ultimately headed toward the 6,650–6,720 range before a larger-scale correction sets in.
Taking some profits around 6,500 may be a prudent move, or alternatively, you can continue holding while adjusting your trailing stops accordingly.
Generally and in most cases its best to exhaust you bullish counts in Elliot .
On the right hand side i am showing SPX/ DXY which is typically a more accurate and discernable wave pattern then the SPX alone. FYI

USDCHFPossible move to the down side. Waiting for a retracement around the 0.79650 zone before we go short.
@musehanezwothe
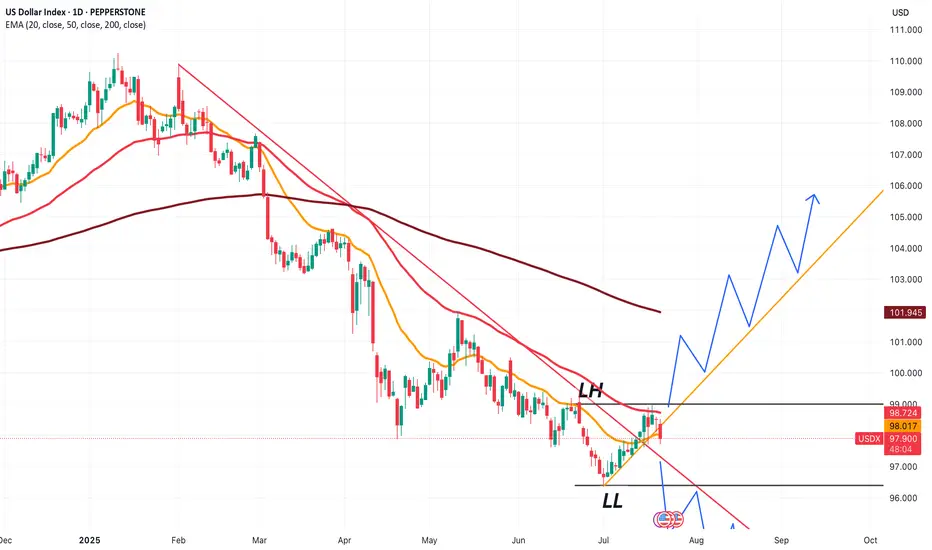
USDX at a crucial price point, which will decide trendThe next few candles for USDX price will be extremely important to understand where the dollar index is headed.
Based on that, we'll be able to choose 'which' Forex pairs we can trade, and more importantly 'how' we can trade them.
If price starts to follow the green line, and takes out 99.000, we'll be in an uptrend.
If price goes back to the red line and eventually goes below 96.400, we'll be in a downtrend.
Hopefully price won't consolidate too much, and trend in a particular direction.
Wait for 3330 to buy the bottom and reduce unnecessary operation#XAUUSD
We have made good profits from short selling yesterday. Currently, gold has fallen to 3350📎. The 4HMACD death cross has increased in volume and is expected to continue to decline. Consider going long near 3330📈. I don’t think it is prudent to bottom out at 3340. Move forward steadily on Friday and reduce unnecessary operations⚖️.
🚀 BUY 3335-3330
🚀 TP 3345-3362