TradeCityPro | JUP Eyes Breakout as Altseason Momentum Builds👋 Welcome to TradeCity Pro!
In this analysis, I want to review the JUP coin for you. It’s one of the projects in the Solana ecosystem, currently ranked 59 on CoinMarketCap with a market cap of $1.65 billion.
📅 Daily Timeframe
On the daily timeframe, this coin is currently sitting below a very important resistance zone at 0.6312. This is a strong resistance area and serves as the main trigger for a trend reversal in this coin.
✔️ The main support floor for JUP is located at 0.3409, a level price has tested twice before. Now it has returned to 0.6312, and we can see increased market volume at this level, which indicates tension between buyers and sellers.
✨ A breakout of 0.6312 would be a good trigger for a long position, and I plan to open a long if this level breaks. This could potentially be a long-term position with a high risk-to-reward ratio.
🔔 The next major resistance zones are at 0.7858 and 1.1435, which we can use as targets for this position.
🔽 If the price gets rejected from the top and moves down, breaking 0.4186 and 0.3409, we can look to open a short position.
🧩 The break of 0.3409 would confirm the start of a downtrend, and it's one of the key zones where I’ll definitely look to hold a short position if it breaks.
📝 Final Thoughts
This analysis reflects our opinions and is not financial advice.
Share your thoughts in the comments, and don’t forget to share this analysis with your friends! ❤️
Trend Analysis

SPY: Pullback or No? Hey everyone,
Posting again for next week.
My thoughts, not advice as usual.
Hope you find them helpful and I hope you all have a great and sunny weekend!
Take care and safe trades!

2025 Is a Big Year for Bitcoin Miners—Who’s Winning the Hash War
Bitcoin’s resurgence in 2025 has reignited the mining race. The halving came and went, hashprice bounced from the abyss, and a fresh wave of capital is pouring into the space. So we figured: time to catch you up on who’s making real moves and pulling ahead — both in market cap and megawatts.
⚡ CleanSpark (CLSK): The Sharpshooter
If Bitcoin mining were a sport, CleanSpark would be the athlete that trains all year, eats clean, and shows up for every match. No drama, just execution.
In 2025, CleanSpark continues to grow fast — but smart. It’s acquiring distressed sites, upgrading facilities with immersion cooling, and pushing its fleet beyond 50 EH/s. Its Tennessee expansion (a deal scooped up for pennies on the dollar) was classic CLSK: low cost, renewable-powered, and ready to scale.
In Q1 2025, CleanSpark posted $162.3 million in revenue, up a blistering +120% YoY, and delivered $246.8 million in net income, or $0.85 per share. It's one of the few miners that’s profitable and expanding — at the same time.
The stock is up 25–30% YTD, trading around $12. While it’s been volatile like the rest of the sector, CLSK remains the benchmark for cost-effective, execution-focused Bitcoin mining. If you’re looking for a fundamentals-backed growth story, this is it.
🏗️ Iris Energy (IREN): The AI-Ready Dark Horse
Iris Energy may have flown under the radar in past cycles, but in 2025 it’s turning heads — not just because of Bitcoin, but because of data infrastructure.
While IREN runs a lean BTC mining operation powered by 100% renewable energy in Australia and Canada, the real story is its pivot toward modular data centers. It’s one of the few miners actively positioning itself for GPU workloads and AI compute as a hedge against mining volatility.
The upside? Flexibility. If BTC mining margins compress again, IREN has the facilities and roadmap to reconfigure its power-hungry machines for AI hosting. The market likes the optionality. The stock’s up ~70% this year and may still be cheap if the data center thesis catches on.
🔥 BitFuFu (FUFU): The Challenger
BitFuFu came in hot after its 2024 IPO — vertically integrated, Bitmain-backed, and global from day one. It’s the largest cloud mining provider in the mining space. It provides cloud mining, sells miners, hosts them, runs its own mining pool (BitFuFuPool), and operates a global fleet clocking over 36 EH/s under management.
While others focused on HPC & AI business, BitFuFu doubled down on mining scale and infrastructure. It aims to own over 1 GW of power capacity and launched its own mining operating system.
The post-halving reality has been rough. Q1 2025 revenue came in at $78 million, down 46% YoY, with self-mining revenue dropping 70.7%. But the company has a track record of being profitable every year since founded, plus its P/S is only 1.6, well below other mining giants such as Mara and Riot.
Watch this one. Especially if BTC pushes above $150K.
🐋 Marathon Digital (MARA): The Goliath, Still Standing
Marathon is the largest public miner by market cap — and has been the face of institutional mining exposure for years. It’s also the most debated name in the game.
On one hand, MARA controls a monster fleet with over 75 EH/s expected by year-end, global mining operations from the U.S. to the UAE, and a budding software business for managing hashrate.
On the other, critics argue it’s bloated, overly reliant on third-party infrastructure, and too slow to pivot in a fast-moving landscape.
Still, when Bitcoin’s hot, Marathon runs. The company holds a large BTC treasury of over 50,000 BTC, is adding immersion-cooled sites, and remains a proxy trade for many traditional investors wanting in on mining without picking niche plays.
Love it or hate it, MARA isn’t going anywhere. And if BTC moons in Q4, it’ll be one of the first tickers to feel the heat.
🧊 Cipher Mining (CIFR): The Quiet Killer
Cipher isn’t flashy. It doesn’t dominate headlines or make bold predictions. What it does do: mine Bitcoin efficiently, at low cost, with minimal dilution and maximum discipline.
Based in Texas, CIFR locked in long-term power contracts at enviably low rates and steadily grew its fleet past 13.5 EH/s. It has some of the best cost-per-BTC metrics in the industry and avoids unnecessary spending or debt.The Texas-based miner produced 602 BTC in Q1, and benefits from low power contracts and disciplined growth.
The market loves it: CIFR is up ~35% YTD, trading at $6.52. It’s becoming a favorite among investors who want hash exposure with less volatility and more transparency. The monthly production updates are clear, consistent, and confidence-building.
👀 Trends to Watch in H2 2025
1. Hashprice Rollercoaster: Hashprice (BTC earned per TH/s per day) has bounced from $39 post-halving lows to nearly $60. If BTC rallies again, miners with fixed-cost power will reap the upside.
2. GPU Hosting Pivot: With AI demand surging, some miners are repurposing infrastructure to host GPUs — think IREN.
3. M&A Season: Expect smaller players with weak cash flow to get scooped up.
4. Regulatory Shifts: Crypto Week laws passed in the U.S. provide more clarity. But ESG pressure and power usage scrutiny will remain part of the narrative.
💭 Final Thought
Bitcoin mining stocks aren’t just about Bitcoin anymore.
They’re about infrastructure. Data. Energy. Efficiency. Optionality. And in 2025, the winners will be those who can balance raw hashpower with strategic foresight.
Whether you’re team CLSK, FUFU, IREN, MARA, or CIFR — the landscape is shifting fast. And with BTC momentum building again, this might just be the beginning.
So — which miner are you backing this cycle?

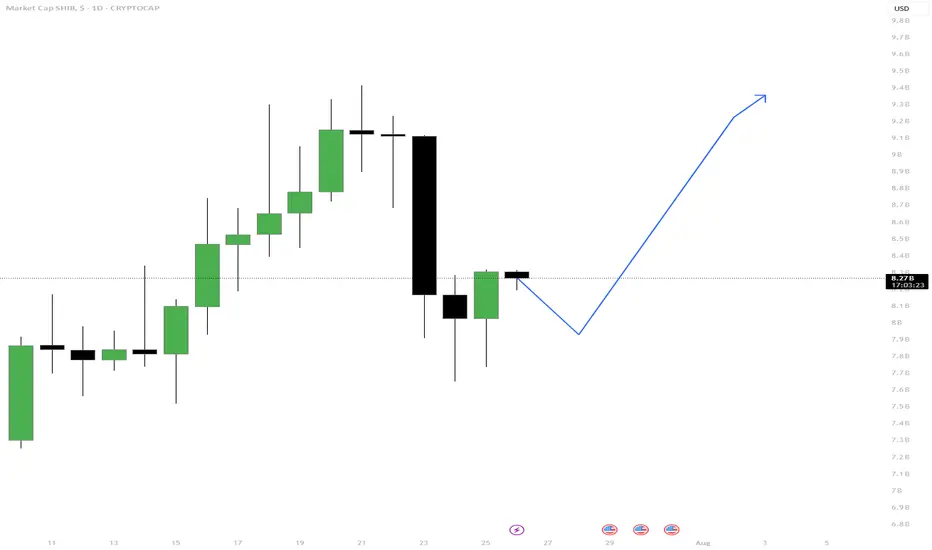
SHIB Market Cap – Dip Before the Rip?Hey Traders!
🧠 Idea: After a strong bounce from recent lows, SHIB’s market cap is showing signs of consolidation. A minor dip could come first, but if support holds, the next move may be a solid push upward.
📌 Tip of the Day:
Smart pullbacks often precede significant breakouts. Be patient and let the structure play out.
🔍 Why This Setup Makes Sense:
🔻 Big drop followed by recovery: Indicates buyers are stepping in.
💚 Strong support at 7.65B zone (wick rejection) shows buying interest.
📉 Short dip expected to shake out weak hands before possible rally.
🔼 Break above 8.4B–8.5B could trigger a continuation pump.
✅ Rules to Follow:
Don’t chase the green; wait for confirmation after any dip.
Key support to hold: 7.65B
Key breakout zone: 8.4B–8.5B
Invalidation: If market cap loses 7.65B and fails to bounce, reassess the setup.
Remember: Whales often buy dips, not breakouts. Let price come to you.
Let me know what you guys think about this post, don't hesitate to ask questions, drop some comments, boost this post and follow for more updates.
-Neo
#SHIB #CryptoCap #Altcoins #TradingView #CryptoAnalysis #MarketUpdate #DipBuyers #PatienceWins
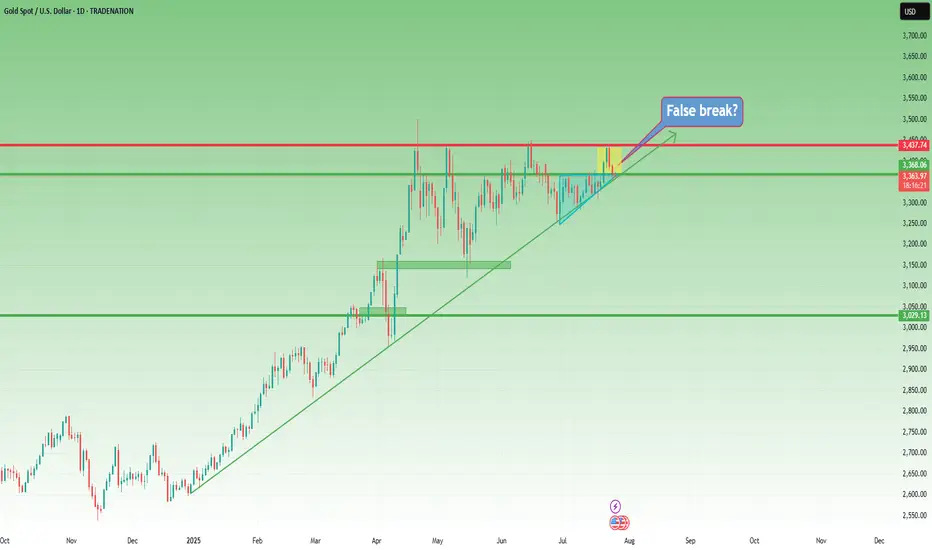
XAUUSD – The Structure Is Still Bullish... But Barely Holding 📌 In yesterday’s analysis, I mentioned that although Gold corrected deeper than expected, dropping below 3400, the bullish structure remained intact — and I stayed true to that view by buying dips.
🎯 The trade didn’t go as planned. Fortunately, the New York rebound from 3350 helped me exit at breakeven.
🧭 So now the big question is:
Is Gold reversing to the downside?
The answer: Not confirmed yet.
The structure is technically still bullish, but the chart is far from pretty.
🧨 What’s going wrong?
❌ Bearish engulfing candle on Wednesday – I chose to ignore it yesterday, but it’s still there.
❌ The breakout above 3375 (ascending triangle resistance) is failing – and could now turn into a false breakout trap.
❌ The ascending trendline from January 2025 is under pressure.
❌ And if today we close near 3350, the weekly chart will show a bearish Pin Bar – not exactly a sign of strength.
📉 My current plan:
- If price rallies back above 3380 → I’m looking to sell into strength, not buy.
- If we break below 3350 → I’ll also look to sell the breakdown.
Right now, for Gold to regain bullish momentum, it needs to reclaim 3400. No compromise.
⚠️ Summary:
Yes, the bigger structure is still bullish.
But momentum is fading, and price action is starting to turn against the bulls.
We need confirmation, not hope.
If 3350 breaks cleanly – things could accelerate to the downside.
Disclosure: I am part of TradeNation's Influencer program and receive a monthly fee for using their TradingView charts in my analyses and educational articles.
GBPJPY short From what I'm seeing
GBPJPY is not done yet
As buyers have tried to push price higher but pressure from the sellers still keeping price from going any further.
The battle continues
Causing the market to range
Next week tell who wins
For I'm seeing sellers with the upper hand
My thoughts 💭 on GJ 🤔

Sell setup if the sell trigger gets activated.Due to a weak trend and a rejection from the all-time high, we’ve seen a strong rejection, suggesting that the price may drop further. If the sell trigger gets activated, it could be a good opportunity to open a sell position.

TradeCityPro | Bitcoin Daily Analysis #137👋 Welcome to TradeCity Pro!
Let’s go over the Bitcoin analysis. I’m making a change to how I analyze Bitcoin — I will no longer include indicators like dominance charts.
🔍 From now on, I’ll be analyzing Bitcoin in daily, 4-hour, and 1-hour timeframes only.
📅 Daily Timeframe
On the daily timeframe, Bitcoin is in a strong uptrend that started from the 78,397 level and in two bullish legs has reached the 122,733 zone.
✅ This level, along with the 0.618 Fibonacci Extension, has created a strong resistance zone. Although price has attempted multiple times to break into or above this area, it has not yet succeeded in closing a candle above or inside the range.
🎲 We also have a curved trendline from higher timeframes, which the price is reacting to even on the daily chart. Currently, the price is near this trendline. There is a possibility that price consolidates over time until it reaches this trendline and then begins its next bullish leg.
📊 If that happens, breaking 122,733 or 120,140 would be triggers for opening a long position on the daily timeframe.
I do not recommend buying Bitcoin on spot right now, because I believe we’re close to the top of this bullish cycle, and this current leg might be the last one.
⭐ A breakout of 76.50 on the RSI would be a strong confirmation of bullish momentum, and would mark the continuation of the uptrend.
🔑 If we get a pullback, the price could correct to dynamic zones like SMA25 or SMA99. Important static support levels are at 110,183 and 100,763.
⏳ 4-Hour Timeframe
In the 4-hour chart, we can see more details of the bullish leg. After the sharp move to 122,733, a correction phase began, forming a range box.
💥 The bottom of the box is around 116,829, which I’ve marked as a zone. It also overlaps with the 0.382 Fibonacci, making it a very important PRZ (Potential Reversal Zone).
The top of the range is at 120,041.
🧩 Yesterday, price made a fakeout to the downside. As you can see, it dumped hard with heavy selling volume and hit the 0.5 Fibonacci level, but couldn’t hold there and quickly bounced back above 116,829.
🧲 Today, I think it's better not to go below the 4-hour timeframe and avoid getting caught up in small market noise.
A break above 120,041 can trigger a long entry.
Another breakdown from the box might trigger a deeper correction.
❌ Disclaimer ❌
Trading futures is highly risky and dangerous. If you're not an expert, these triggers may not be suitable for you. You should first learn risk and capital management. You can also use the educational content from this channel.
Finally, these triggers reflect my personal opinions on price action, and the market may move completely against this analysis. So, do your own research before opening any position.

NZDCAD Long Now!I believe it will reach the 83000 target, it may still retest the level before going to the target, but I have all the confimation for a long here.

BITCOIN (BTCUSD): Recovery Starts
Bitcoin is going to rise from a key daily support.
After a liquidity grab, the market shows a clear strength,
forming a double bottom on an hourly time frame.
I expect a bullish movement at least to 117100
❤️Please, support my work with like, thank you!❤️
I am part of Trade Nation's Influencer program and receive a monthly fee for using their TradingView charts in my analysis.

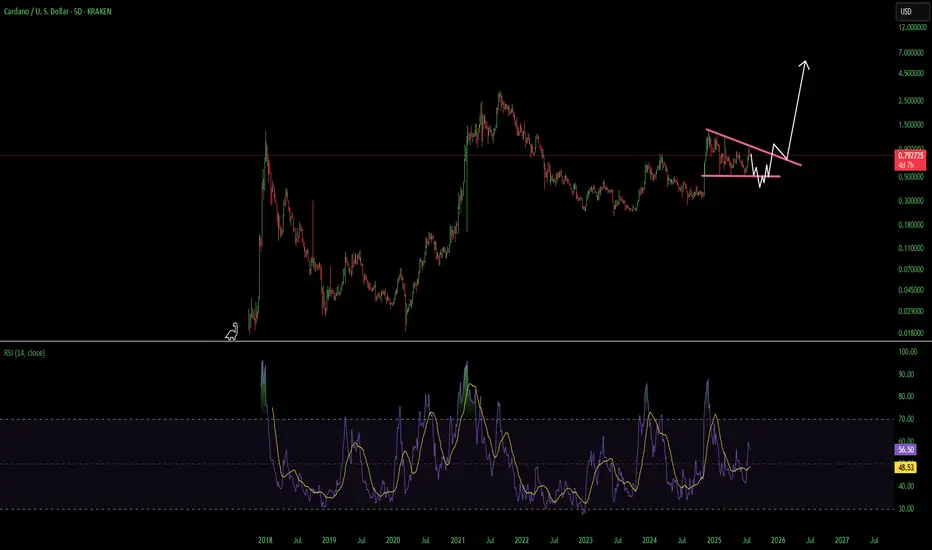
ADA Cardano Decsending Triangle Use Caution HereCardano had a heck of a move but i think its going to erase most if not all of it before it goes on its next leg up. A break over the overhead resistance line and finding support above would invalidate this. Not financial advice just my opinion. Thank you
Bitcoin - The cycles are playing out!⚔️Bitcoin ( CRYPTO:BTCUSD ) just repeats another cycle:
🔎Analysis summary:
Following all of the previous all time high breakouts, Bitcoin will now further extend the rally. After some simple calculation, we can see that Bitcoin will rally another +50% in order to reach the overall price target. However there will be volatility along the way so make sure to remain calm.
📝Levels to watch:
$200.000
SwingTraderPhil
SwingTrading.Simplified. | Investing.Simplified. | #LONGTERMVISION

GBPUSD → Retest of previously broken resistance...FX:GBPUSD has entered a correction phase after breaking through the local downtrend. If the price remains in the 1.3450–1.346 zone, this will confirm the formation of a new trading range...
The market is entering a correction phase due to the dollar. A countertrend retest of the support zone is forming. Earlier, the currency pair broke the local trend and is entering a flat phase. The retest of support may end with a recovery. If, within the local movement and after a false breakout of the 1.345 - 1.3467 zone, the bulls keep the price above the buying zone, then in the short and medium term, we can expect growth to continue.
Support levels: 1.3467, 1.345
Resistance levels: 1.35, 1.3584
A false breakdown of support at 1.3467 will confirm a change in the local trend (correction). The market may return to the recovery phase of the global trend.
Best regards, R. Linda!

bitcoin- Time to buy again! (Update)As I said, Bitcoin broke the triangle, and now with a slight price correction, it could surge to $160,000, and you still think I'm joking!!
Previous analysis
Lingrid | USDJPY Potential Channel Breakout. LongFX:USDJPY is retesting the breakout zone after reclaiming support from a prior swap area near 146.9. Price action has broken above a downward trendline and is forming a bullish retest structure. As long as USDJPY holds above 146.920 zone, the setup favors a continuation toward the resistance barrier. A breakout above the red descending trendline could accelerate upside momentum.
📉 Key Levels
Buy trigger: Break and hold above 147.500
Buy zone: 146.900 – 147.000
Target: 148.250
Invalidation: Break below 146.000
💡 Risks
Failure to break the descending red trendline may trigger renewed selling
Consolidation below resistance could signal buyer exhaustion
Break below 146.000 would invalidate bullish retest setup
If this idea resonates with you or you have your own opinion, traders, hit the comments. I’m excited to read your thoughts!

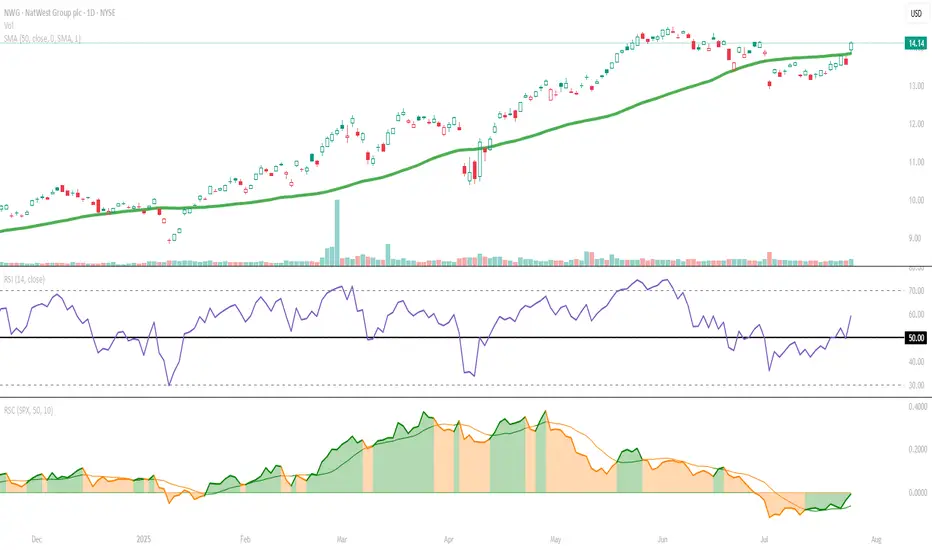
NatWest Group (NWG): A Kicker Setup Is BrewingKicker-like Surge Shifts Tone
The latest daily candle resembles a bullish kicker, gapping above the previous day's range with strong follow-through—a possible sign of sentiment shift. Notably, this move came with an RSI jump from the equilibrium zone of 50 to near 60, suggesting growing momentum. Price has pushed through immediate resistance near $14.00 while holding firmly above the rising 50-DMA. RSC with SPX is indicating a revival in strength.
📆 Weekly Chart Overview
After a brief multi-week pullback, NWG appears to be stabilising just above its 20-week moving average. The latest weekly candle shows a strong rebound, closing near the highs and gaining over 6%, suggesting renewed buying interest. RSI has turned upward from the 60 zone, indicating momentum may be regaining strength. This price action, coupled with the overall trend structure, suggests the broader uptrend remains intact and buyers may be attempting to reassert control.
Gautam Mazumdar
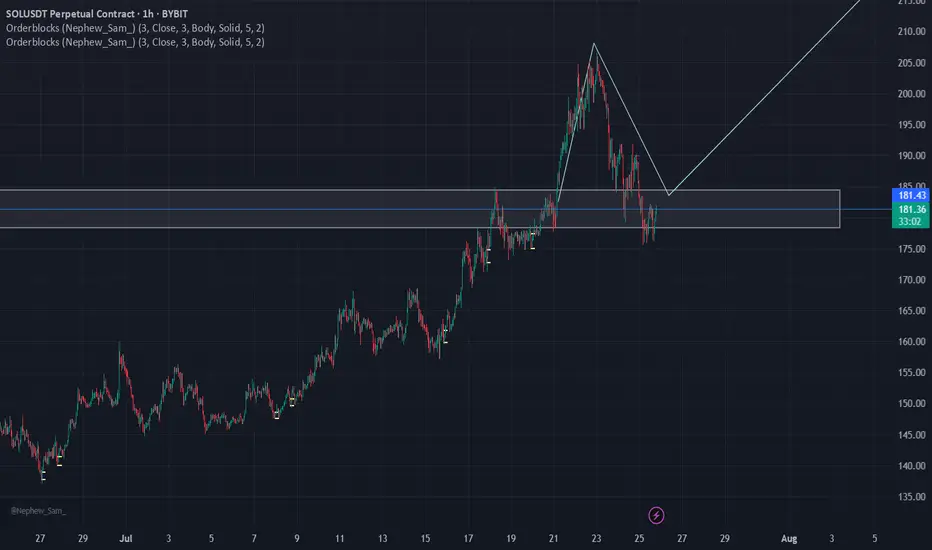
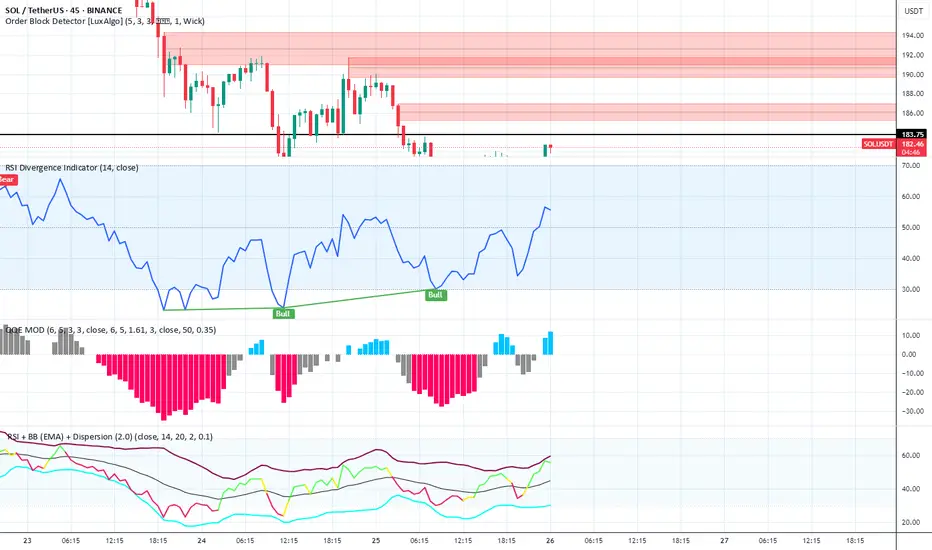
Vijay D - Smart Order Block + RSI Divergence Reversal SuiteIndicators Used in the Setup
Order Block Detector
Settings: (5, 3, 3), 1 Wick
Function: Highlights institutional order blocks to identify high-probability supply/demand zones.
Chart Insight: Multiple bearish order blocks marked in red between $186–$194, confirming strong overhead resistance. Price is reacting at the lower boundary (~$183.75), showing signs of rejection.
RSI Divergence Indicator (14)
Settings: 14-period RSI
Function: Detects bullish and bearish divergences between price and RSI.
Chart Insight: Bullish Divergence identified — price made a lower low while RSI made a higher low, signaling a potential trend reversal or bullish bounce.
QQE MOD
Settings: (6, 5, 3), Smoothing: 6.5, RSI Length: 14
Function: A momentum oscillator derived from RSI with smoothing and histogram representation.
Chart Insight:
Histogram flipped from red (bearish) to blue (bullish).
Bullish transition suggests increasing momentum in favor of bulls.
TSI – BB (EMA) + Dispersion
Function: Combines True Strength Index with Bollinger Band (EMA-based) and dispersion overlays.
Chart Insight:
TSI is rising toward midline with narrowing dispersion bands.
Indicates a potential volatility contraction before an expansion — likely upside if TSI crosses above signal.
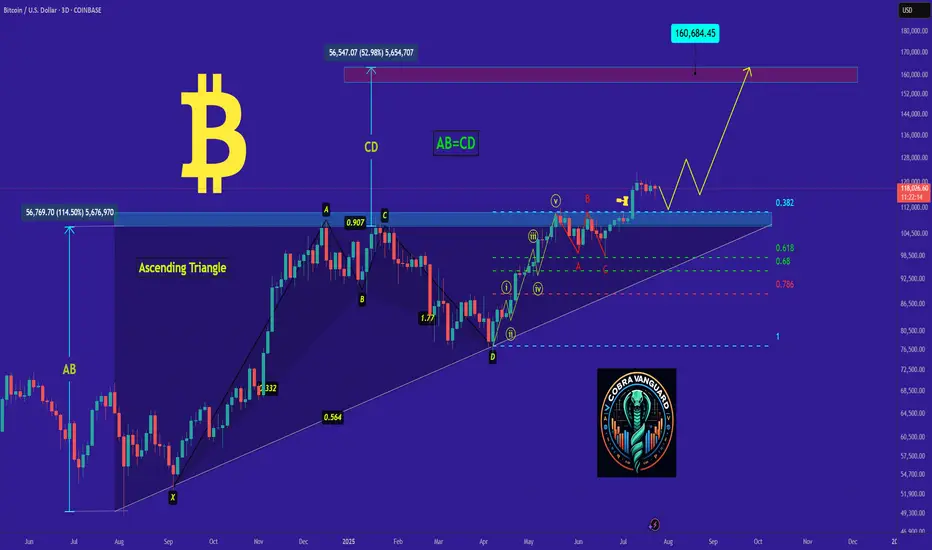
BITCOIN's Situation (12h) !!!So if you pay attention to the TON chart you can see that the price has formed a Ascending wedge which means it is expected to price move as equal as the measured price movement.( AB=CD )
NOTE: wait for break of the WEDGE .
Best regards CobraVanguard.💚

BITCOIN - Price can correct to support area and then start riseHi guys, this is my overview for BTCUSD, feel free to check it and write your feedback in comments👊
For a significant period, the price of Bitcoin was trading upwards within the confines of a rising channel.
Strong buying pressure led to a breakout above the channel's upper boundary, signaling an acceleration of the uptrend.
After this breakout, the upward momentum stalled, and the price entered a new phase of horizontal consolidation, forming a wide flat range.
The price recently tested the upper resistance of this range near $122800 and was rejected.
As a result, the asset is currently in a corrective move downwards, approaching the key support area located between $114000 and $115000
I expect that the price will find support at the bottom of this flat range, reverse its course, and begin a new rally back towards the top of the range at $122800
If this post is useful to you, you can support me with like/boost and advice in comments❤️
Disclaimer: As part of ThinkMarkets’ Influencer Program, I am sponsored to share and publish their charts in my analysis.

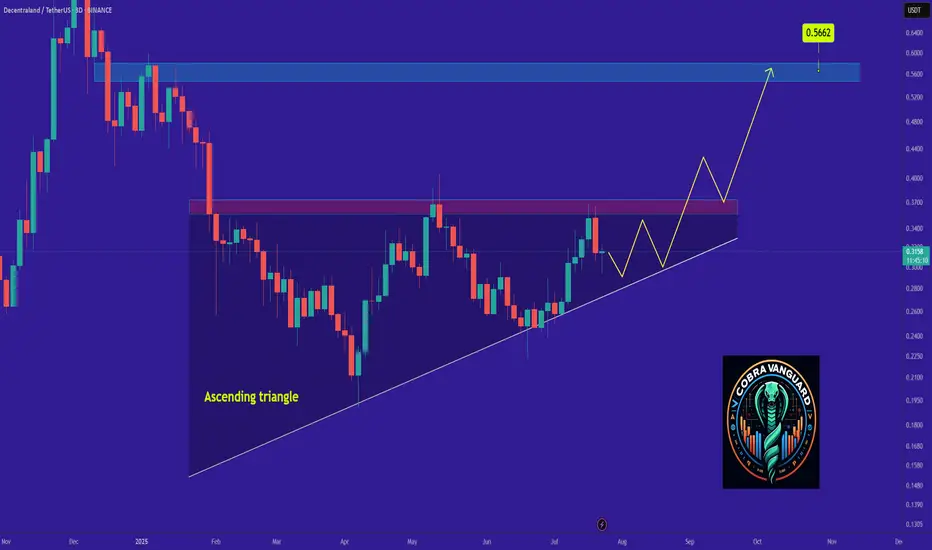
MANA's Situation, A Comprehensive Analysis !!!The price on the 3-d timeframe is within an ascending triangle, which can be promising. If the price breaks this pattern with bullish candles, it could easily rise by the distance of AB=CD .
Best regards CobraVanguard.💚
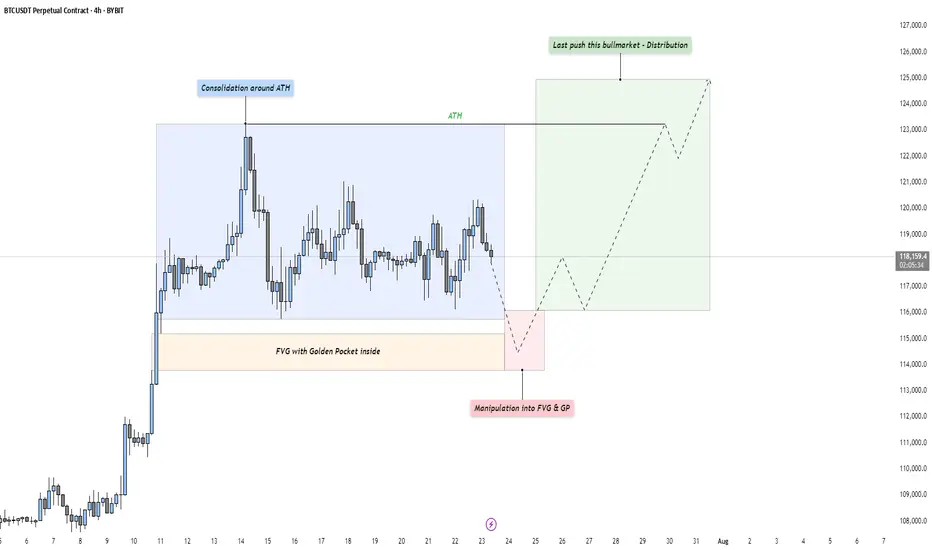
BTC - Last Push: Consolidation, Manipulation & DistributionMarket Context
After a strong upward impulse, Bitcoin has entered a mid-term consolidation phase just below its all-time high. This kind of price action is typical as the market digests recent gains and larger participants prepare for the next move. These pauses in momentum often precede either trend continuation or a reversal — and the structure here suggests we might be witnessing the former, but not without a final shakeout.
Phase 1: Consolidation Around the All-Time High
The first phase is defined by a tight range just beneath the all-time high, where price moves sideways in a balanced struggle between buyers and sellers. This is often where retail participants become overly bullish, anticipating a breakout. However, the lack of a sustained move higher indicates that smart money may be waiting for better entries — or preparing to engineer liquidity to fuel the next move.
Phase 2: Manipulation Into the Fair Value Gap and Golden Pocket
Directly below the range lies a clean Fair Value Gap, with a Golden Pocket retracement nestled inside it. This zone represents a strong area of interest. A sharp move into this area would likely sweep late long positions and trigger stop-losses from range traders — a classic manipulation pattern. This phase serves two purposes: collect liquidity and offer favorable pricing for larger players looking to position themselves before expansion. Watch for signs of absorption or reversal as price enters this zone.
Phase 3: Expansion – The Last Push of the Bull Market?
Following the liquidity sweep and reaction from the Fair Value Gap and Golden Pocket zone, we could see a renewed expansion toward higher highs. This is the phase where volume returns, sentiment shifts, and price accelerates. If this plays out, it could mark the final leg of this bull cycle — potentially driving Bitcoin to new all-time highs with strength.
Execution Thoughts
If you're looking to participate, it's wise to wait for a confirmation signal on a lower timeframe — like the 5-minute or 15-minute chart — once price enters the Fair Value Gap and Golden Pocket zone. Watch for a strong bullish reaction, break of structure, or shift in order flow to signal that buyers are stepping back in.
Final Thoughts
Let the market come to your level and don’t chase moves without context. These three phases — consolidation, manipulation, and expansion — are timeless patterns seen across all markets. Stay patient, stay objective, and react with clarity.
If this breakdown helped you see the setup more clearly, a like would mean a lot — and I’d love to hear your thoughts in the comments! Are you watching the same zone, or do you see something different?
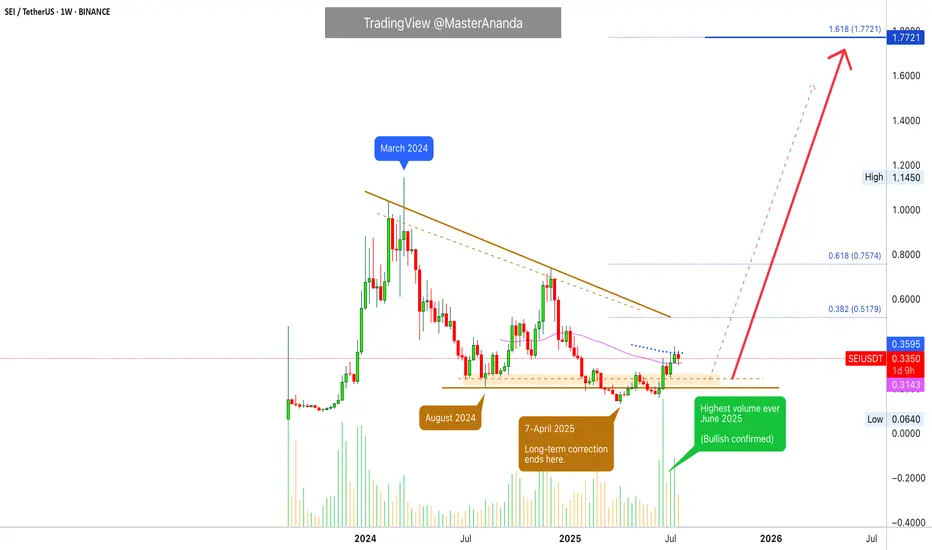
Sei · Technical Analysis · Beyond Trading —The Soul in the ChartThis is a nice chart. It is well structured. It is also basic and standard. You can know where a project is at based on the drawings (patterns) on the chart. When you look at hundreds of charts, for years, you can see the signature of the trading bots on each chart. Each exchange has a different set of algorithms doing the trading. It is fascinating to say the least. Once you learn their language and understand their behaviour, you can time the market and predict market moves. I've seen the same patterns, actions and reactions repeating thousands of times, over and over, again and again. This is good, it helps us predict the market.
Even if humans are the ones doing most of the trading, their habits and customs will show up on the chart. These will appear as different sequences, fractals and patterns. People act based on instincts, emotions, impulses and intuitions. These come based on the weather, the environment, our relations, physical chemistry and the effect of the astros on our bodies and minds. If we can put all these things together we can time the market. Doing it consciously sounds (feels/looks) like a very hard task but most of it is done subconsciously, like driving. You learn to perform the craft consciously but once you have practice and engage in it then it comes out naturally; you don't have to think about changing gears or pressing on the gas, you just do it; like riding a bike. That's technical analysis for you, that's trading. It can be approached in the same way. If you engage the market long enough, with an open mind always ready to adapt and accept new input, eventually you move with the market and this movement will tend to be the right choice when it comes to making a decision.
This or that? Your intuition is when solutions and answers come forth from a vast array of subconscious material. So we read, we trade and we participate and our minds take care of the rest. The way to organize all this subconscious information and make it useful—and available to the conscious mind—is through meditation.
I am going to go with the volume signal. The highest volume ever happened in June after a higher low. The main low from the March 2024 high happened in 2025-April, the market bottom. There was a low in August 2024 and this becomes an important level. When the action moved below, it activates signals for buyers; when the action moves back above, we are in the bullish zone. Current price action confirms this, SEIUSDT is long-time bullish now. Rising for months but momentum is yet to show. This is only the start.
The action is happening above EMA55 below EMA89. Support and resistance.
Considering the bigger picture and the overall growth potential we can say the market is still trading at the bottom. I am using the linear chart to make this clear.
After the highest volume ever the market cannot start dropping. After more than a year of bearish action, between March 2024 and April 2025, seeing a full green candle with the highest volume ever after a higher low means that the bulls are in. Coming from a technical analysis perspective, this means that the bullish bias is confirmed.
The break and close above EMA55 weekly gives this signal additional strength, and what is happening across the altcoins market; every single day several pairs are growing more than 100%, in just one day; reveals what the future holds.
This is not speculation. This is not my speculative opinion. This is a translation of actual price data, which is the action the market participants are taking, that says we are going up.
It is not "I" that is saying "we are going up." It is the chart, the market, the data. It is inevitable, it is already confirmed based on the information that I've been showing you month after month after month.
It is not predicting the future. It is simply pointing out the logical conclusion of a series of events. If someone has an idea to build a house and from this idea starts to work; accumulate the necessary money, hire an engineer and take all the necessary steps to build a house, you can easily say, if you have access to this information, that a house will be built at some point. You don't have to be genius to do it, but you know this person has been putting the money and effort, has been taking all the steps that are necessary to get it done. Knowing this, you can say with a high level of certainty that it will be done, based on the data of course. Crypto is going up. Only a Black Swan event can stop this, and you can't predict those. So we go with what is possible and what we know. Just watch!
Thanks a lot for your continued support.
It might be hard to be 100% right or predict minor swings and changes short-term, but when it comes to the bigger picture? It is impossible to miss.
Thank you for reading.
Namaste.