posting full SSThis post serves only to share the complete SS, which was not inadvertently included in the earlier post shared today.
Trend Analysis
RIVN Approaching Trend ShiftRIVN has NEVER held above the high time frame cloud....until now. Probably at least a 3-6 month idea, gotta give this time to play out after being down only since IPO. Green diag is current SL.

Aeva Technologies (AEVA) – Pioneering Next-Gen LiDAR Company Snapshot:
Aeva NASDAQ:AEVA is revolutionizing perception systems with 4D FMCW LiDAR—offering instant velocity detection, high precision, and long-range sensing, setting a new standard for autonomous systems.
Key Catalysts:
Breakthrough Technology
AEVA’s proprietary 4D Frequency Modulated Continuous Wave (FMCW) LiDAR provides real-time velocity and depth data, outperforming traditional Time-of-Flight systems in accuracy and safety.
Automotive OEM Traction 🚗
Strategic collaborations are translating into production-stage contracts, marking a key inflection from R&D to scalable revenue generation.
Multi-Sector Expansion 🌐
AEVA’s sensing tech is penetrating robotics, aerospace, and industrial automation, significantly broadening its TAM and diversifying revenue streams.
Government & Aerospace Validation
Recent contract wins with defense and aerospace clients underscore AEVA’s technological credibility and commercial viability.
Investment Outlook:
Bullish Entry Zone: Above $22.50–$23.00
Upside Target: $39.00–$40.00, supported by production scaling, cross-sector adoption, and deep-tech differentiation.
⚙️ AEVA stands at the forefront of smart sensing innovation with strong momentum into high-growth verticals.
#AEVA #LiDAR #AutonomousVehicles #Robotics #Aerospace #IndustrialTech #SensorRevolution #4DPerception #FMCW #TechStocks #Innovation #SmartMobility

EUR/USD – The Cleanest Buy Setup EUR/USD – The Cleanest Buy Setup This Quarter (Wave E Targeting New Highs)
---
📄 TradingView explanation
📊 EUR/USD 4H Chart Analysis
The pair has beautifully respected the corrective channel from Wave C to D and is now preparing for the final leg — Wave E.
🟦 Key Highlights:
🔹 Price bouncing off demand zone
🔹 Tight consolidation near mid-channel = accumulation
🔹 Next targets: 1.1900 / 1.2050
🔹 Bullish continuation expected after liquidity sweep
🎯 The cleanest and most technically sound buy opportunity this quarter — align your longs with the trend before the breakout happens.
💬 Let them call it a bubble — we call it precision and patience. 🧠💸
#ElliottWave #EURUSD #ForexSetups #SmartMoneyMoves
?

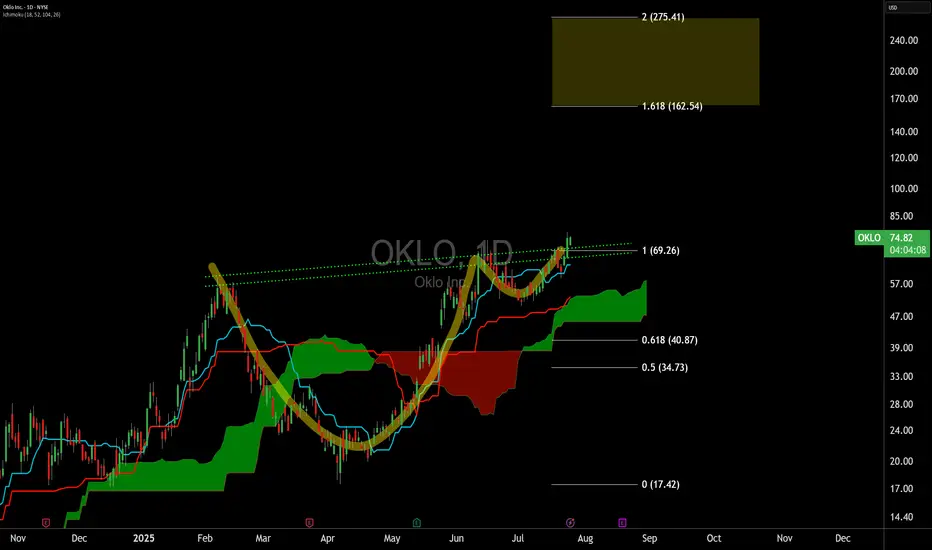
OKLO C&HC&H chart pattern in a hot sector seeing support by the US Government. The intersection of energy, uranium, nuclear, utilities, data centers, the grid, AI, etc.
SL = LL at 58
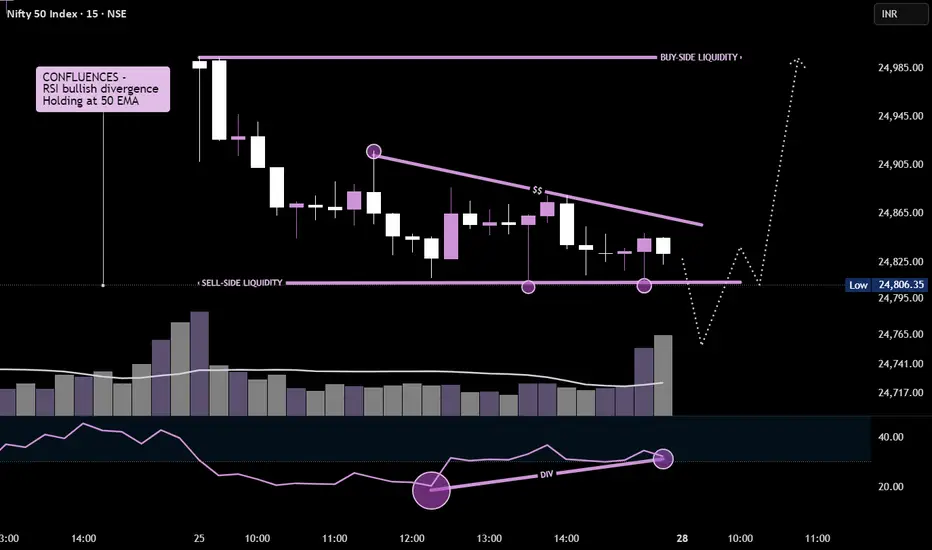
NIFTY50 - 15MIN Potential reversal brewingPrice is forming a falling wedge pattern with clear bullish RSI divergence, signaling potential reversal.
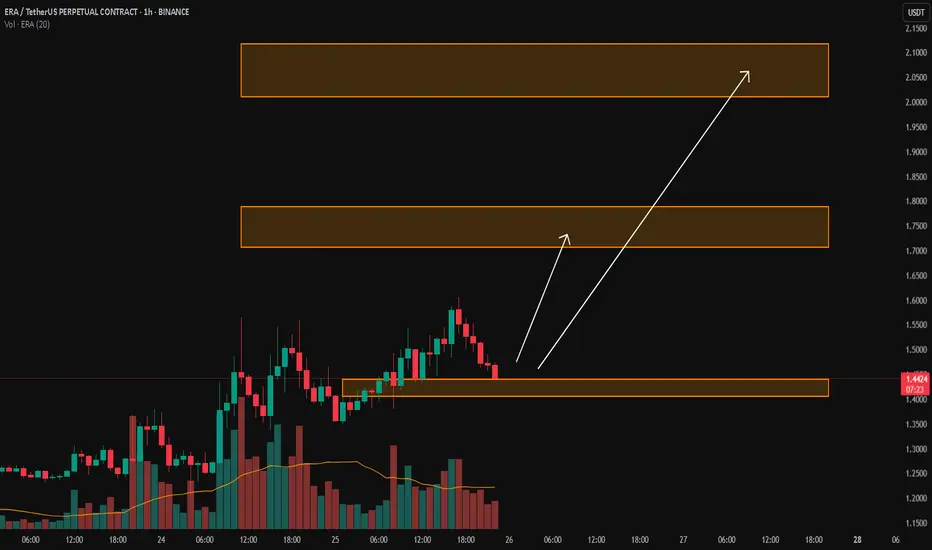
ERA/USDTKey Level Zone: 1.4050 - 1.4400
LMT v2.0 detected.
The setup looks promising—price previously trended upward with rising volume and momentum, then retested this zone cleanly. This presents an excellent reward-to-risk opportunity if momentum continues to align.
Introducing LMT (Levels & Momentum Trading)
- Over the past 3 years, I’ve refined my approach to focus more sharply on the single most important element in any trade: the KEY LEVEL.
- While HMT (High Momentum Trading) served me well—combining trend, momentum, volume, and structure across multiple timeframes—I realized that consistently identifying and respecting these critical price zones is what truly separates good trades from great ones.
- That insight led to the evolution of HMT into LMT – Levels & Momentum Trading.
Why the Change? (From HMT to LMT)
Switching from High Momentum Trading (HMT) to Levels & Momentum Trading (LMT) improves precision, risk control, and confidence by:
- Clearer Entries & Stops: Defined key levels make it easier to plan entries, stop-losses, and position sizing—no more guesswork.
- Better Signal Quality: Momentum is now always checked against a support or resistance zone—if it aligns, it's a stronger setup.
- Improved Reward-to-Risk: All trades are anchored to key levels, making it easier to calculate and manage risk effectively.
- Stronger Confidence: With clear invalidation points beyond key levels, it's easier to trust the plan and stay disciplined—even in tough markets.
Whenever I share a signal, it’s because:
- A high‐probability key level has been identified on a higher timeframe.
- Lower‐timeframe momentum, market structure and volume suggest continuation or reversal is imminent.
- The reward‐to‐risk (based on that key level) meets my criteria for a disciplined entry.
***Please note that conducting a comprehensive analysis on a single timeframe chart can be quite challenging and sometimes confusing. I appreciate your understanding of the effort involved.
Important Note: The Role of Key Levels
- Holding a key level zone: If price respects the key level zone, momentum often carries the trend in the expected direction. That’s when we look to enter, with stop-loss placed just beyond the zone with some buffer.
- Breaking a key level zone: A definitive break signals a potential stop‐out for trend traders. For reversal traders, it’s a cue to consider switching direction—price often retests broken zones as new support or resistance.
My Trading Rules (Unchanged)
Risk Management
- Maximum risk per trade: 2.5%
- Leverage: 5x
Exit Strategy / Profit Taking
- Sell at least 70% on the 3rd wave up (LTF Wave 5).
- Typically sell 50% during a high‐volume spike.
- Move stop‐loss to breakeven once the trade achieves a 1.5:1 R:R.
- Exit at breakeven if momentum fades or divergence appears.
The market is highly dynamic and constantly changing. LMT signals and target profit (TP) levels are based on the current price and movement, but market conditions can shift instantly, so it is crucial to remain adaptable and follow the market's movement.
If you find this signal/analysis meaningful, kindly like and share it.
Thank you for your support~
Sharing this with love!
From HMT to LMT: A Brief Version History
HM Signal :
Date: 17/08/2023
- Early concept identifying high momentum pullbacks within strong uptrends
- Triggered after a prior wave up with rising volume and momentum
- Focused on healthy retracements into support for optimal reward-to-risk setups
HMT v1.0:
Date: 18/10/2024
- Initial release of the High Momentum Trading framework
- Combined multi-timeframe trend, volume, and momentum analysis.
- Focused on identifying strong trending moves high momentum
HMT v2.0:
Date: 17/12/2024
- Major update to the Momentum indicator
- Reduced false signals from inaccurate momentum detection
- New screener with improved accuracy and fewer signals
HMT v3.0:
Date: 23/12/2024
- Added liquidity factor to enhance trend continuation
- Improved potential for momentum-based plays
- Increased winning probability by reducing entries during peaks
HMT v3.1:
Date: 31/12/2024
- Enhanced entry confirmation for improved reward-to-risk ratios
HMT v4.0:
Date: 05/01/2025
- Incorporated buying and selling pressure in lower timeframes to enhance the probability of trending moves while optimizing entry timing and scaling
HMT v4.1:
Date: 06/01/2025
- Enhanced take-profit (TP) target by incorporating market structure analysis
HMT v5 :
Date: 23/01/2025
- Refined wave analysis for trending conditions
- Incorporated lower timeframe (LTF) momentum to strengthen trend reliability
- Re-aligned and re-balanced entry conditions for improved accuracy
HMT v6 :
Date : 15/02/2025
- Integrated strong accumulation activity into in-depth wave analysis
HMT v7 :
Date : 20/03/2025
- Refined wave analysis along with accumulation and market sentiment
HMT v8 :
Date : 16/04/2025
- Fully restructured strategy logic
HMT v8.1 :
Date : 18/04/2025
- Refined Take Profit (TP) logic to be more conservative for improved win consistency
LMT v1.0 :
Date : 06/06/2025
- Rebranded to emphasize key levels + momentum as the core framework
LMT v2.0
Date: 11/06/2025
- Fully restructured lower timeframe (LTF) momentum logic
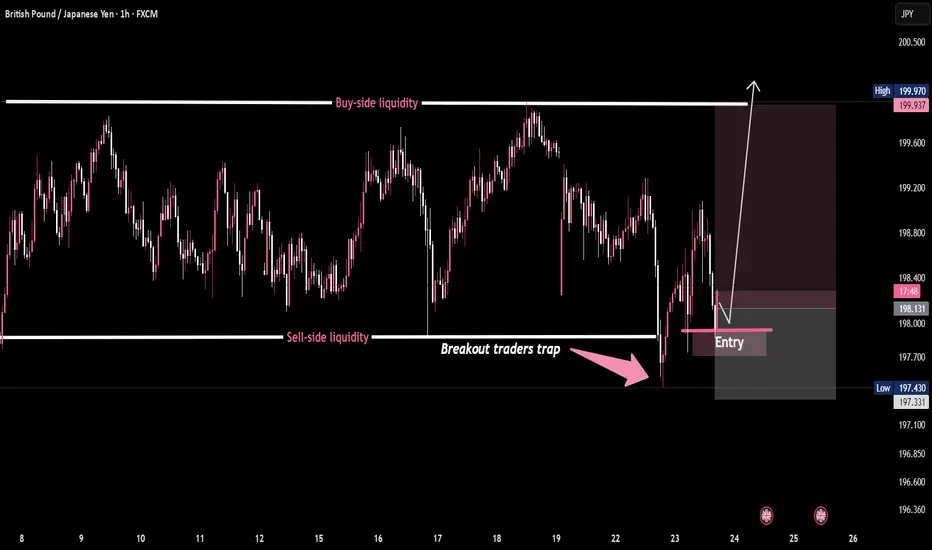
GBP/JPY - Classic Breakout Trap in PlayPrice nuked below range lows to sweep sell-side liquidity, trapping breakout sellers.
Smart money scooped it up. Entry reclaimed — now eyeing buy-side liquidity above 🎯
This is how the game is played:
1️⃣ Liquidity grab
2️⃣ Breakout trap
3️⃣ Reclaim & reverse
4️⃣ Target resting orders up top 🚀
📈 GBP/JPY – Classic Breakout Trap in Play 🧠💥
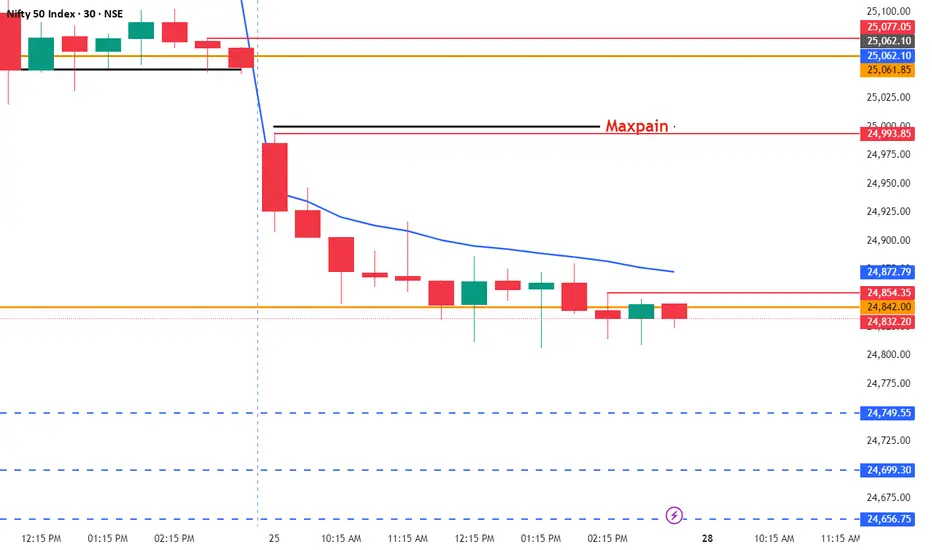
Monday Gap down ProbabilityAs market sentiments are negative where smallcap and midcap tumbles possible gap down after weekend , positive bias after breaking 25062 level till then market showing bearish movement
Fart Ichimoku Breakout Test📈 Checking bullish signals on the chart
✅ Positive signs:
- The price is stable above the cloud and the candles show the strength of buyers.
- Indicators such as RSI and trading volume are in a good position.
- The cloud broke with the body
First profit limit 1/451
Second profit limit 1/551
Limit of loss 1/320

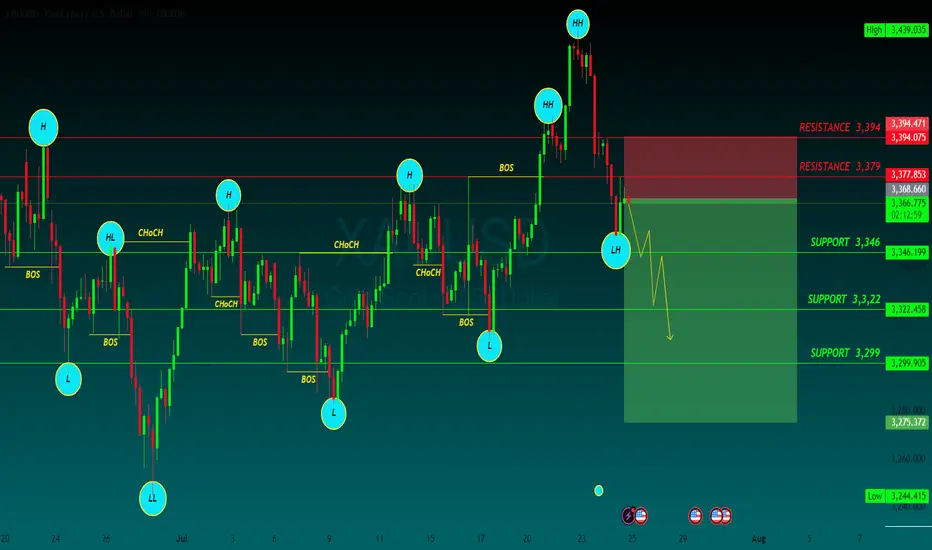
GOLD SELLGold price bears retain control amid fading safe-haven demand, rebounding USD
US President Donald Trump announced late Tuesday that his administration had reached a trade deal with Japan. Furthermore, reports that the US and the European Union are heading towards a 15% trade deal boost investors' confidence and weigh on the safe-haven Gold price for the second straight day on Thursday.
The markets do not expect an interest rate cut from the US Federal Reserve in July despite Trump's continuous push for lower borrowing costs. In fact, Trump has been attacking Fed Chair Jerome Powell personally over his stance on holding rates and repeatedly calling for the central bank chief's resignation.
Moreover, Fed Governor Chris Waller and Trump appointee Vice Chair for Supervision Michelle Bowman have advocated a rate reduction as soon as the next policy meeting on July 30. This keeps the US Dollar depressed near a two-and-a-half-week low and could offer some support to the non-yielding yellow metal.
Traders now look forward to the release of flash PMIs, which would provide a fresh insight into the global economic health and influence the safe-haven commodity. Apart from this, the crucial European Central Bank policy decision might infuse some volatility in the markets and drive the XAU/USD pair.
Meanwhile, the US economic docket features Weekly Initial Jobless Claims and New Home Sales data, which, in turn, would drive the USD and contribute to producing short-term trading opportunities around the commodity. Nevertheless, the fundamental backdrop warrants caution for aggressive traders.
SUPPORT 3,346
SUPPORT 3,322
SUPPORT 3,399
RESISTANCE 3,394
RESISTANCE 3,379
MRNA Approaching Trend Shift After Multi-Month DeclinePotential trend flip on the Moderna Chart for the first time since May 2024. I use a default doubled cloud on the daily timeframe 18/52/104/26. I find this to be superior to the default cloud on both backtesting and forward testing over the past decade on any chart.
Ideal bullish entry conditions occur on the cloud system when all four conditions are met:
Price above cloud
Bullish cloud
Bullish tenkan and kijun cross (TK)
Lagging span above price and above cloud (LS)
The doubled cloud settings are meant to decrease noise and increase signal, because of this I ignore the lagging span entirely and have never used the lagging span for entry criteria. We are approaching sufficient entry conditions with a bullish kumo breakout (price above cloud) and kumo twist (bullish cloud).
The target zone is merely based on the 50% retracement of high to low of the multi-month down trend, see: Dow Theory. Additional upside can be seen if the trend remains intact. Trailing stop losses via Williams Fractals and keeping an eye out for bearish divergences are both key to position management for this strategy.
Stop loss considerations for this idea is a combination of price below cloud and new lower lows. There is not a strongly defined level here at the moment but 31, 27 and 25 would all be considerations for reduction or closing of the position.
Interesting that this TA setup occurs in the setting of heavy anti-vaccine rhetoric from the current administration as well as severe weakness in the healthcare sector generally.
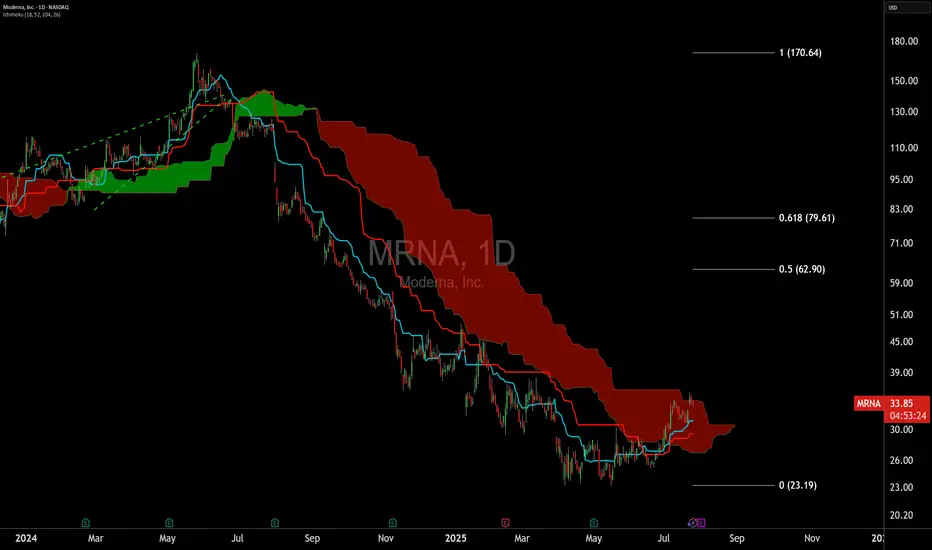
Chart Analysis on the SilverYou can follow us for more Analysis(Images and Videos) with Precise definition of the Financial Market.ENJOY!!!

Ethereum gains momentum: SEC green light and Banks ShiftEthereum gains momentum: SEC green light and JPMorgan’s historic shift
By Ion Jauregui – Analyst at ActivTrades
Ethereum once again takes center stage in financial markets after a week full of positive signals: on one hand, the long-awaited clarification of its regulatory status by the SEC; on the other, the unexpected opening of JPMorgan to cryptocurrencies. All this in a context of growing institutional interest and corporate adoption.
Washington clears the path: ETH is a commodity
The chairman of the SEC, Paul Atkins, has resolved one of the biggest uncertainties in the crypto ecosystem: Ethereum will not be treated as a security, but as a commodity. In other words, it falls outside the scope of the SEC’s strictest regulations and is placed on the same level as bitcoin from a regulatory standpoint. This shift, which ends years of ambiguity, comes just as Ethereum spot ETFs begin to gain traction. On July 16 alone, these products recorded a net inflow of $726 million, reflecting strong demand from large investors. By way of explanation:
Security: A financial instrument representing a share in a company or a credit, such as a stock or bond. It is subject to financial market regulation (such as the SEC in the U.S.), especially regarding transparency, registration, and investor protection.
Commodity: A standardized tradable good, often raw, such as oil, gold... or bitcoin, according to regulators. It does not imply any ownership rights in a company and is not subject to the strict regulation applied to securities, but is instead overseen by other agencies like the CFTC.
JPMorgan breaks with the past and moves closer to cryptocurrencies
Jamie Dimon, CEO of JPMorgan and until recently a staunch critic of bitcoin, has made an unexpected move: the bank is studying the possibility of offering loans backed by cryptocurrencies like BTC and ETH. The system would allow clients to obtain liquidity in dollars without selling their crypto assets, by depositing them as collateral.
The bank would not directly custody these assets but would delegate that function to specialized providers such as Coinbase Custody. Although still in an exploratory phase, this represents a radical change in the relationship between big banking and the crypto world.
Trump Media, Western Union and Polymarket stoke the crypto narrative
It’s not just banks that are positioning themselves. Trump Media & Technology Group (TMTG) confirmed a $2 billion investment in bitcoin, making it the fifth publicly traded company with the largest BTC holdings in the world. The company is also preparing the launch of its own token on Truth Social, its social network.
Meanwhile, Western Union is exploring the use of stablecoins to improve the efficiency of international transfers, while Polymarket is studying the launch of its own stablecoin or a partnership with Circle (USDC). All this is happening after the recent approval of the GENIUS Act, which for the first time regulates these types of assets in the U.S.
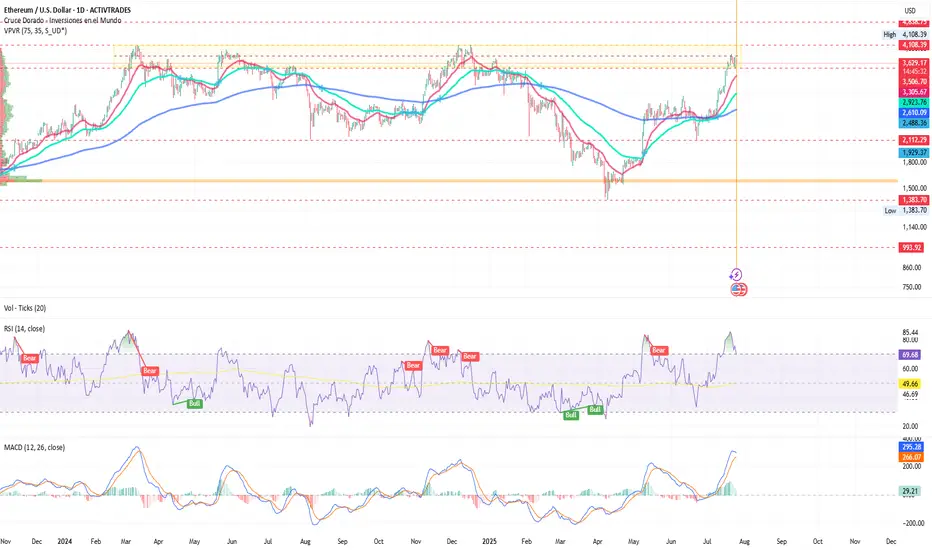
ETH/USD analysis: Beginning of a new bullish phase?
On the charts, Ethereum has responded to the macro and political environment with sustained recovery since April, entering a partial consolidation phase during several months this year. After holding the support level around $2,579, and since the golden cross on the 10th of this month, it has consolidated a price expansion leading it to test a new consolidation zone around $3,500. ETH now aims for more ambitious levels that could push the commodity towards recent highs of $3,857.67 and potentially break through to $4,000.
Currently, the price is within a range it has tested for the fourth time. If it fails to break out, we could see a pullback towards $2,700 or even a return to previous supports at $2,112 and the long-term point of control at $1,586.
Key support: $2,579
Immediate resistance: $3,857.67 (recent highs)
Target zone: $3,850 – $4,000 if a clean breakout occurs
Danger zone: Below $2,880, bearish pressure could return
Ethereum ready to make the leap
With the SEC’s legal backing, a recent surge in volume, the rise of spot ETFs, and the shift in traditional banking led by JPMorgan, Ethereum is cementing its role as a strategic asset in the new financial era, ready to lead the next phase of crypto adoption. This time, with Wall Street watching closely. Ethereum appears ready to play a leading role in the next stage of integration between traditional and digital finance — and it seems that big banks are betting heavily on ETH.
Ethereum is no longer in bitcoin’s shadow. Today, it stands as a key player in bridging traditional finance and the digital future.
*******************************************************************************************
The information provided does not constitute investment research. The material has not been prepared in accordance with the legal requirements designed to promote the independence of investment research and such should be considered a marketing communication.
All information has been prepared by ActivTrades ("AT"). The information does not contain a record of AT's prices, or an offer of or solicitation for a transaction in any financial instrument. No representation or warranty is given as to the accuracy or completeness of this information.
Any material provided does not have regard to the specific investment objective and financial situation of any person who may receive it. Past performance and forecasting are not a synonym of a reliable indicator of future performance. AT provides an execution-only service. Consequently, any person acting on the information provided does so at their own risk. Political risk is unpredictable. Central bank actions can vary. Platform tools do not guarantee success.
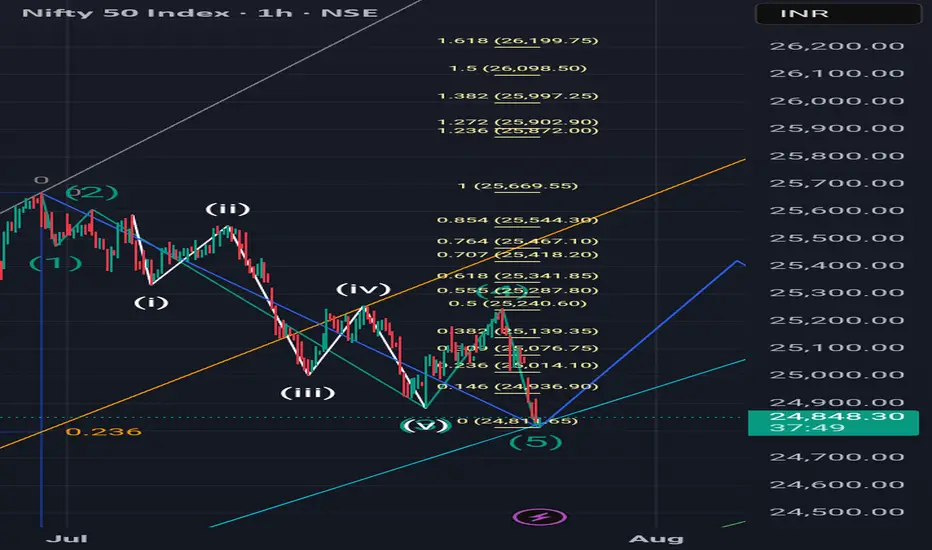
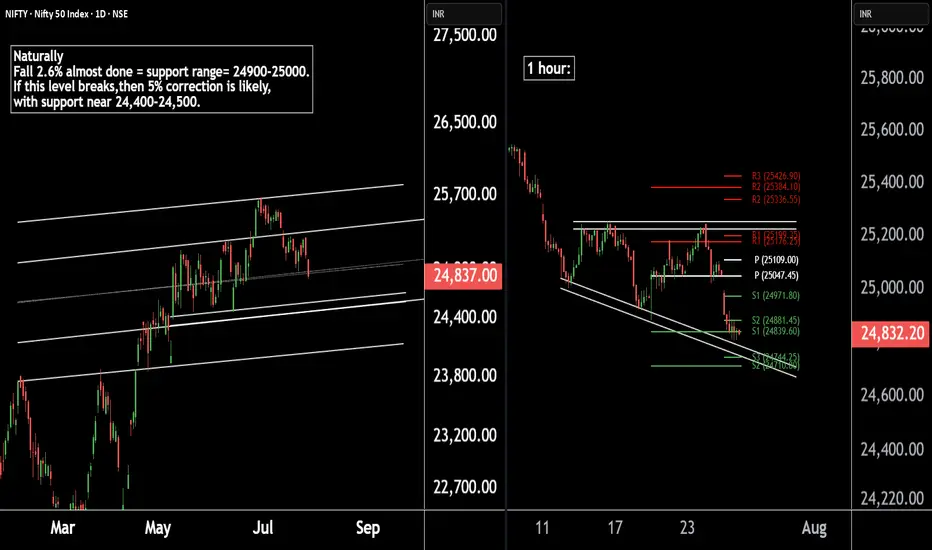
Nifty 50 Update | Technical Levels MappedThere are two chart of Nifty50.
Nifty 50 is trading within a well-defined parallel channel. As part of its natural corrective phase, a potential decline of around 5% cannot be ruled out, with key support anticipated near the 24,400–24,500 zone.
Nifty is forming a broadening wedge pattern on the 1-hour timeframe, with crucial support around 24,740. Additionally, both the weekly and monthly pivot supports are aligned in the 24,740–24,710 zone, reinforcing the significance of this level.
If this level sustain then we may see higher prices in Nifty50.
Thank You !!
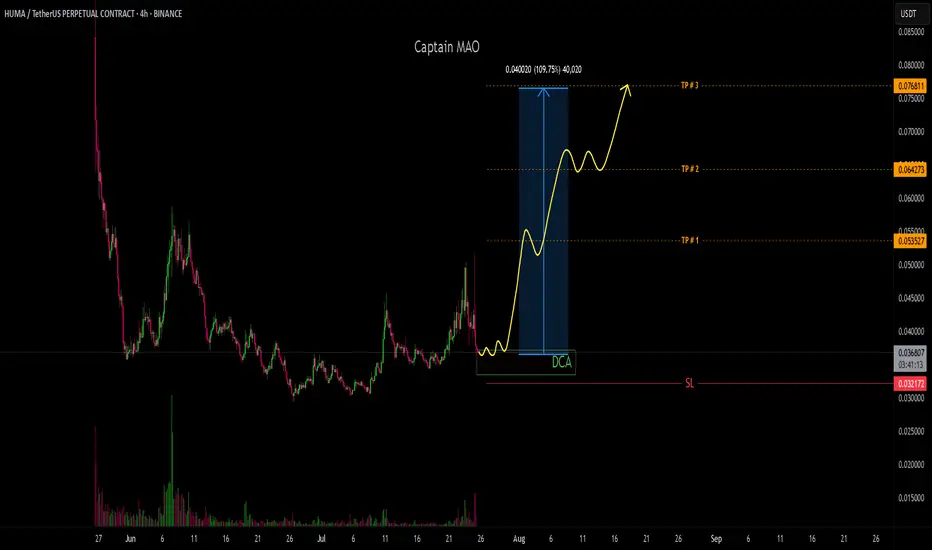
HUMA/USDT +100%The $0.03 zone has acted as a key reversal point for HUMA/USDT, marking the bottom of a significant trend shift. Since then, the price has been printing higher highs (HH) and higher lows (HL) a clear indication of a strong bullish structure in development.
After reaching a local top at $0.05 price is now undergoing a healthy correction, offering a potential buy opportunity within the green box zone. This pullback could act as a springboard for the next impulsive leg toward the $0.07–$0.077 target zone.
7/25: Key Levels to Watch Closely for Next Week's TradingGood evening, everyone!
Due to health reasons, I had to take a short break from updates — thank you all for your understanding and support.
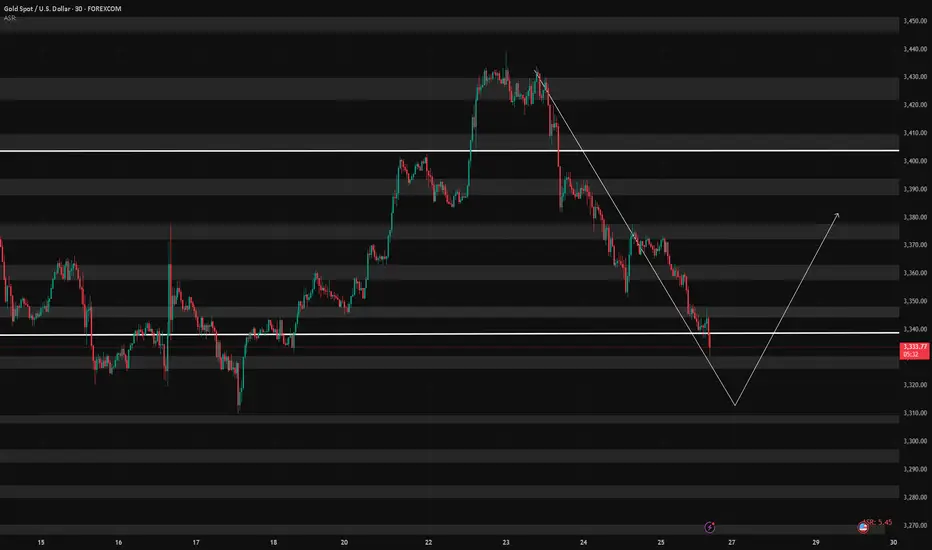
This week, gold rallied to the 3440 level, forming a double-top pattern, and has since entered a phase of consolidation with a downward bias, currently retracing back to the key 3337-332 support area.
While a short-term rebound is possible from the 30-minute chart perspective, the weekly structure is not favorable to the bulls. On the daily chart, price has once again reached the MA60 support, and is currently forming three consecutive bearish candles, which suggests that bearish momentum may continue.
Unless there is significant bullish news next week, the market may remain under pressure. Key levels to monitor:
Upside resistance zones: 3343, 3352, 3358, 3366, 3372, 3378, and 3386–3392
Downside support zones: 3337, 3332, 3323, 3312
If the weekly chart breaks down, watch for: 3300 psychological level and 3260 (weekly MA20)
Additionally, during this week's decline, a price gap has been left between 3395–3398. If the market starts to rebound on the 2-hour chart, there is a chance this gap will be filled. However, this area also serves as strong resistance, and any approach toward it could result in heavy selling pressure. Caution is advised in the event of a sharp rally.
I'm still recovering and unable to monitor the markets for extended periods. Once my health improves, I’ll resume regular updates. In the meantime, feel free to leave any questions, and I’ll do my best to respond. Thanks again for your continued support, and I wish everyone success and strong profits in the market!
GOLD (XAUUSD): Bullish Move Ahead?!
I think that Gold is going to rise soon.
The price is now entering a strong demand area
based on a horizontal support and a rising trend line.
The price may pull back to 3376 level.
❤️Please, support my work with like, thank you!❤️
I am part of Trade Nation's Influencer program and receive a monthly fee for using their TradingView charts in my analysis.

link buy midterm"🌟 Welcome to Golden Candle! 🌟
We're a team of 📈 passionate traders 📉 who love sharing our 🔍 technical analysis insights 🔎 with the TradingView community. 🌎
Our goal is to provide 💡 valuable perspectives 💡 on market trends and patterns, but 🚫 please note that our analyses are not intended as buy or sell recommendations. 🚫
Instead, they reflect our own 💭 personal attitudes and thoughts. 💭
Follow along and 📚 learn 📚 from our analyses! 📊💡"

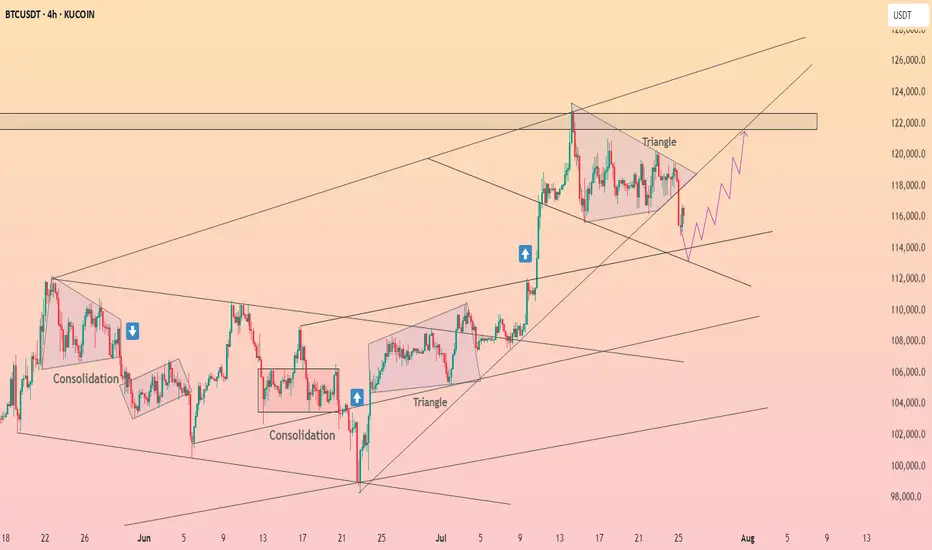
Bitcoin is correcting ┆ HolderStatBINANCE:BTCUSDT compresses inside a triangle between $132K and $137K. Breakout above $137K could initiate a run toward $143K. Breakdown exposes $132K. Watch for decisive move.
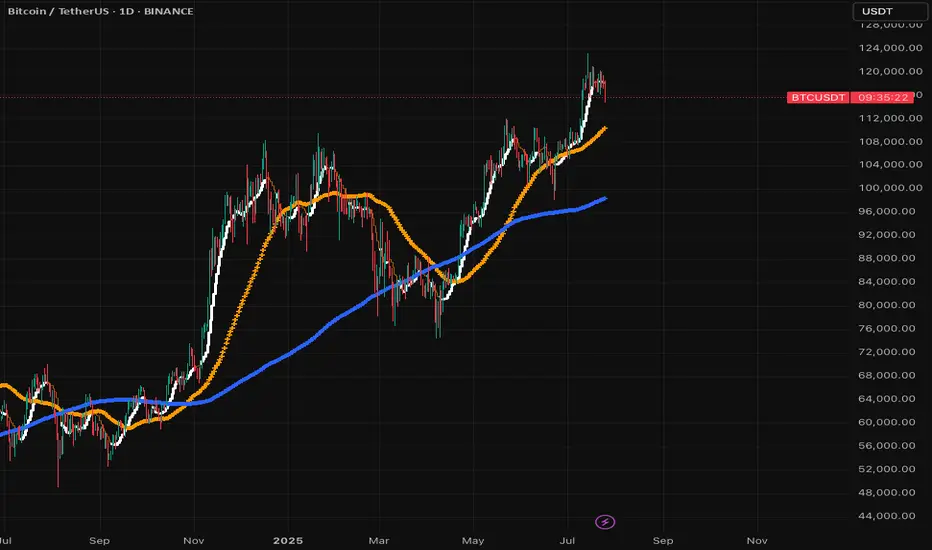
BTC dropping like a brick....bound to happen sooner or laterHard drops follow big spikes. Happens every time, just look back in time. But this time it's different? Maybe to some extent, but as long as there are short term profit takers and insane volatility this trend will continue. Only 2 cents is to not SHORT SELL. You will only contribute to the potential squeeze and will lose money. If you're up now, your priority should be to retain value and sell before it goes down to it's next support level which is under 100k! Maybe it does or not, but the dips do happen and with automated trading bots it could hit more aggressively and faster. If anything, but the dip when there's sufficient support. Best of luck!
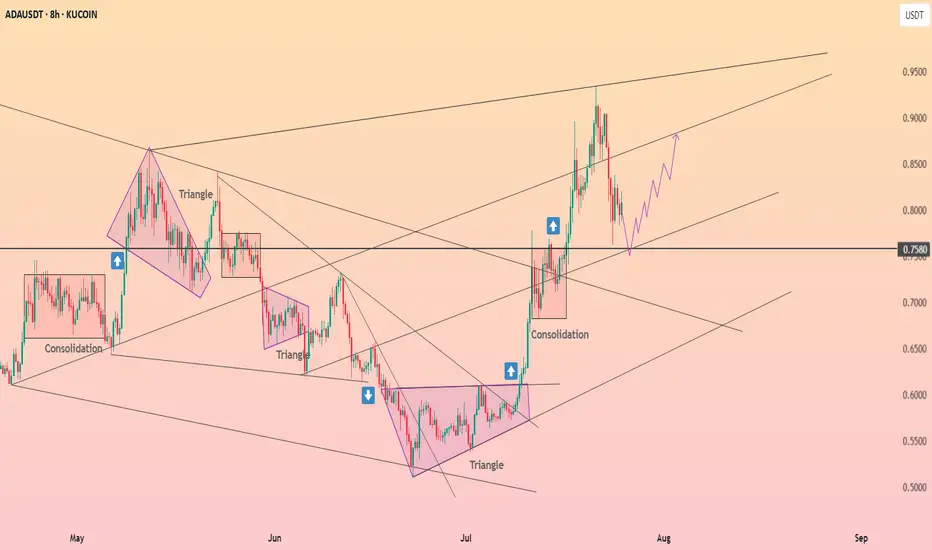
Cardano held above $0.76 ┆ HolderStatBINANCE:ADAUSDT is compressing under $0.44 with support from $0.418. Breakout from wedge structure may target $0.462. If $0.418 breaks, downside risk opens to $0.40. Watch for volatility.
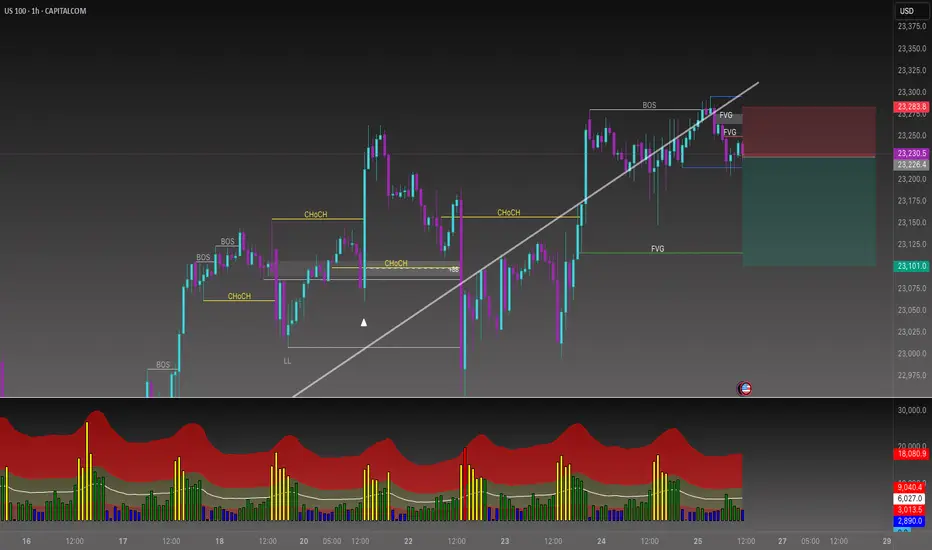
Do you want to keep buying NAS100?📉 Sell-Side Bias Activated
After PEPPERSTONE:NAS100 confirming the trend shift with a clean Break of Structure (BOS) and a strong rejection from the FVG (Fair Value Gap) zone, price failed to hold above 23,275.
This move validated the liquidity sweep and imbalance fill. Multiple FVGs stacked above suggest premium pricing and further downside potential.
🧠 I’m now watching for continuation setups toward discount zone. Especially below 23,100 and possibly targeting the lower FVG region.
This is a classic smart money play, manipulation, BOS, FVG retest, and selloff.
🔻Bias: Bearish
🎯 Target: Liquidity pools below 23,100
🛑 Invalidated above 23,280 (structure reclaim)