Trend Analysis

PEPE last season alive?🔥 The alt season is beginning on the market. Many alts are yielding tens and even hundreds of percent per day. But there are also those among them from whom we clearly expected more.
And I'm talking about old memes like Doge, PEPE, SHIB, and others.
Over the past month, PEPE has grown by only 60%. Is everything really that bad? Let me explain:
1️⃣ The latest growth impulse formed a divergence with the price in terms of volume. Throughout the growth over the last 4 months, purchase volumes continued to decline. This signals a waning interest in PEPE as the price rises.
2️⃣ Money Flow also shows a near-total lack of new liquidity. Fresh money is not flowing into the asset, and even now, in such an euphoric phase, PEPE's liquidity indicator is in the neutral zone.
3️⃣ PEPE has formed a local lower high and has already deviated from resistance at $0.00001439. It has already corrected by 6% today. This shows that there is currently no liquidity in the asset to drive the price higher.
4️⃣ GAP was formed at the levels of $0.00001241 - $0.00001027. And as we know, 99% of GAPs close sooner or later.
Nevertheless, we see high levels of interest at lower prices. When the fifth 0 appears. However, these zones can also change quickly in the event of a major correction of the entire market, and no other correction will bring the asset to such prices in the short term.
📌 Conclusion:
Right now, old memes really do look sad. Thousands of new memes are created every day that can give big returns, and people are asking themselves, “If I buy a meme with no value, why should I buy an old one?”
🔔 So, at current prices, PEPE is clearly of no interest to anyone. But, as is usually the case, once such coins fall below a certain price, whales will take positions and start pushing them up. Everyone will suddenly notice how undervalued this wonderful coin was.
So, for those who want to buy, I advise you to relax, you are not missing out on anything. And there will definitely be better prices for buying.
And stay in tune by subscribing, for more insightful ideas!

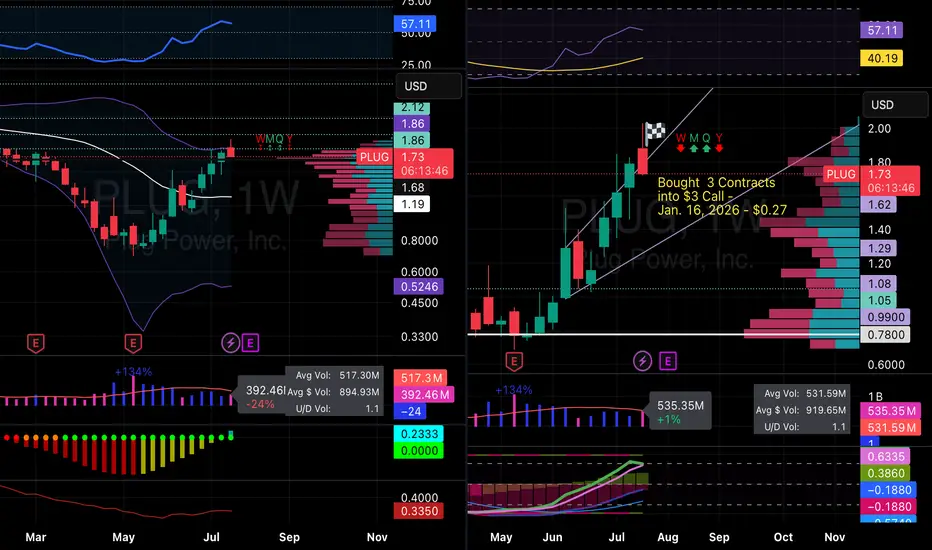
Plugged InIn looking at the money flow for NASDAQ:PLUG , I see the EMAs 8 day and 21 day crossing into a new uptrend. The RSI is still below the overbought territory. The weekly is down with volume pouring in to get ready for the next leg. Sellers are slowing with the MACD. Looking ahead the money in the past has flowed into PLUG in the winter, therefore winter contracts look well priced and primed for the future growth based upon today's information. Let's see where it goes.
Remember do your own due diligence and research. Past performance doesn't equal future performance.
GBPUSD LONGTERM BUYWe have H4 BUY range
Followed by SELL range (retracement)
SELL range turn to BUY range.
I expect to buy around 1.3410 (After confirmation = PRICE REJECTION)
TP: 1.3787 (Between there I will have small BUY AND CLOSE trade)

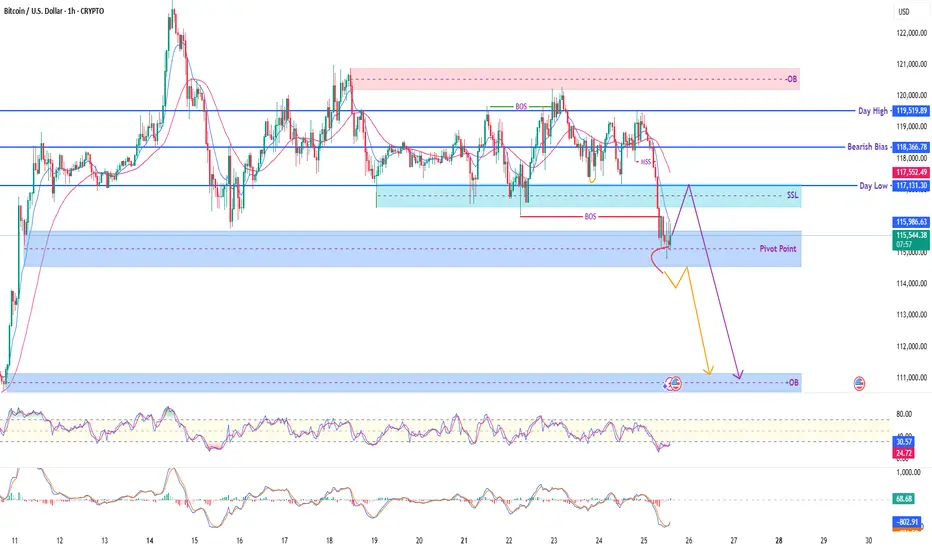
Bitcoin / USD – 1H Smart Money Outlook🔹 Current Price: $115,549
🔹 Key Zones:
🔴 Supply OB (Resistance): $119,500 – $121,000
🔵 Demand OB (Target Zone): $111,000 – $112,000
🔻 Bearish Bias: Below $118,366
⚠️ Pivot Point: $115,987
🔹 Day Low: $117,131 | Day High: $119,519
🧠 Market Structure Overview:
❌ BOS + MSS indicates internal weakness
🔁 Price rejected key resistance (OB) and shifted structure bearish
🔹 SSL (Sell-Side Liquidity) near $117,000 likely to be targeted
📉 Expected Scenario:
Retracement to SSL / Pivot → Continuation Drop
Possible minor bullish pullback but overall structure favors downside
📊 Indicators:
RSI: Bearish divergence zone (30.70)
MACD: Bearish momentum building
Price trading below EMA
✅ Bias: Bearish
🕰️ Timeframe: 1H
🎯 Plan: Look for short setups on retracement toward SSL / OB
Flag ReversalWe might see this guy use this flag reversal to push down, we are currently at the sell side of the trend and we want to believe that the pair is going to push down even more

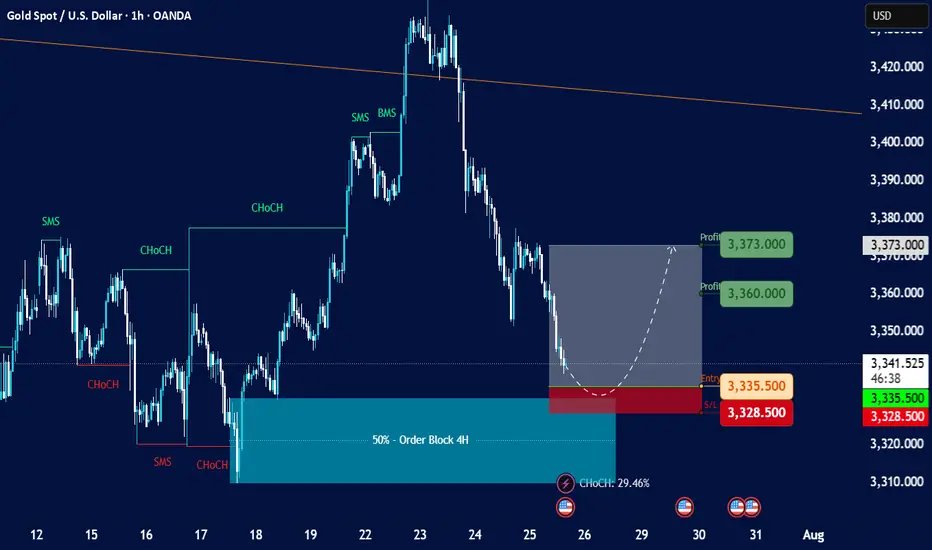
Gold Spot / U.S. Dollar (XAU/USD) with a 1-hour timeframeOverall Trend and Market Structure:
The chart displays a mix of bullish and bearish movements, but recent price action (from around July 23rd onwards) shows a significant downturn after a peak.
There are "SMS" (Structural Market Shift) and "ChoCH" (Change of Character) labels, indicating shifts in market structure. Initially, there were bullish shifts, but the recent price action suggests a potential bearish shift or at least a significant retracement.
A large "50% - Order Block 4H" is highlighted in blue, which acted as support and led to a strong upward move previously.
Current Price Action and Setup:
The current price is around 3,340.670.
There's a proposed short-term trading setup, indicated by:
Entry: 3,335.500 (red dashed line)
Stop Loss (SL): 3,328.500 (red shaded area)
Profit Targets (TP):
3,360.000 (green shaded area, "Profit 3,360.000")
3,373.000 (green shaded area, "Profit 3,373.000")
The setup is highlighted with a gray shaded area, indicating the potential path of price for this trade. It appears to be a long (buy) setup, anticipating a bounce from the current levels.
The "CHOCM: 29.46%" at the bottom suggests some kind of indicator or calculation related to market character.
Key Observations and Considerations:
Previous Bullish Momentum: The price rallied strongly after touching the "50% - Order Block 4H" around July 17-18, reaching a high near 3,430.
Recent Bearish Retracement: Since July 23rd, the price has pulled back significantly from its peak, almost revisiting the higher levels of the previous order block.
Potential Support: The proposed entry point for the long trade (3,335.500) is within a zone that previously acted as support or a level from which price bounced. It's also near the top of the "50% - Order Block 4H" area, suggesting this could be a retest or a bounce from a key support zone.
Risk-Reward: The setup shows a relatively tight stop loss compared to the potential profit targets, which is generally favorable for risk management.
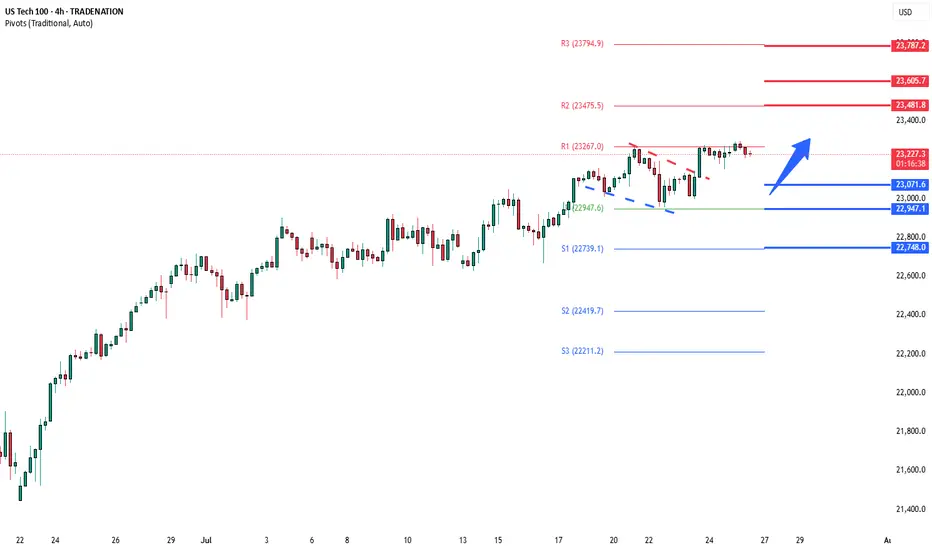
NSDQ100 pushing to new ATH?Thursday was a slightly positive session for equities, with the NASDAQ 100 rising +0.18% to close at a fresh record high, driven by strong economic data. However, overall market action was subdued, with the S&P 500’s trading range the narrowest since February (0.35%).
Notably, the equal-weighted S&P 500 fell -0.33%, highlighting underlying weakness outside mega-cap tech.
A key drag on the NASDAQ came from Tesla (-8.20%), which slumped after disappointing earnings. This weighed on the Magnificent 7, which declined -0.21% despite gains in the other six members.
On the macro front, the US dollar strengthened as Donald Trump downplayed his dispute with Fed Chair Jerome Powell, though continued to pressure the Fed on interest rates. Meanwhile, the FCC approved Paramount’s merger with Skydance, signaling a green light for M&A activity in media despite political tensions.
Conclusion – NASDAQ 100 Trading View:
The NASDAQ 100 remains technically bullish, setting new highs amid resilient economic data. However, breadth is weakening, and headline risk—especially around earnings (e.g., Tesla)—could trigger short-term volatility. Traders should stay long with caution, watching for sector rotation or profit-taking near highs, and monitor Fed-related rhetoric for macro-driven moves.
Key Support and Resistance Levels
Resistance Level 1: 23480
Resistance Level 2: 23600
Resistance Level 3: 23790
Support Level 1: 23070
Support Level 2: 22950
Support Level 3: 22750
This communication is for informational purposes only and should not be viewed as any form of recommendation as to a particular course of action or as investment advice. It is not intended as an offer or solicitation for the purchase or sale of any financial instrument or as an official confirmation of any transaction. Opinions, estimates and assumptions expressed herein are made as of the date of this communication and are subject to change without notice. This communication has been prepared based upon information, including market prices, data and other information, believed to be reliable; however, Trade Nation does not warrant its completeness or accuracy. All market prices and market data contained in or attached to this communication are indicative and subject to change without notice.
CELH Eyes Upside Momentum as Consolidation TightensCelsius Holdings, Inc. ( NASDAQ:CELH ) has shown a notable recovery from its early 2025 lows, steadily climbing and recently consolidating around the $46 level. The stock is currently trading above both the short-term (red) and mid-term (blue) moving averages, which are sloping upward—indicating bullish momentum.
The recent price action reveals a tight consolidation just below the previous local highs around $47–$48. If CELH can decisively break above this resistance zone with increased volume, it may trigger a short-term breakout and open room toward the $52–$55 range, even $60.
Conversely, if the stock fails to break above resistance and falls below the $43–$44 support area (near the moving averages), it could trigger a short pullback toward the $40 level.
Key Levels to Watch:
Resistance: $47.50–$48.00
Support: $43.00–$44.00
Breakout Target: $52.00–$55.00 / extended $60
Momentum remains positive, but confirmation through volume and follow-through price action is essential for any breakout to sustain.

GBPCAD: Growth & Bullish Continuation
The price of GBPCAD will most likely increase soon enough, due to the demand beginning to exceed supply which we can see by looking at the chart of the pair.
Disclosure: I am part of Trade Nation's Influencer program and receive a monthly fee for using their TradingView charts in my analysis.
❤️ Please, support our work with like & comment! ❤️

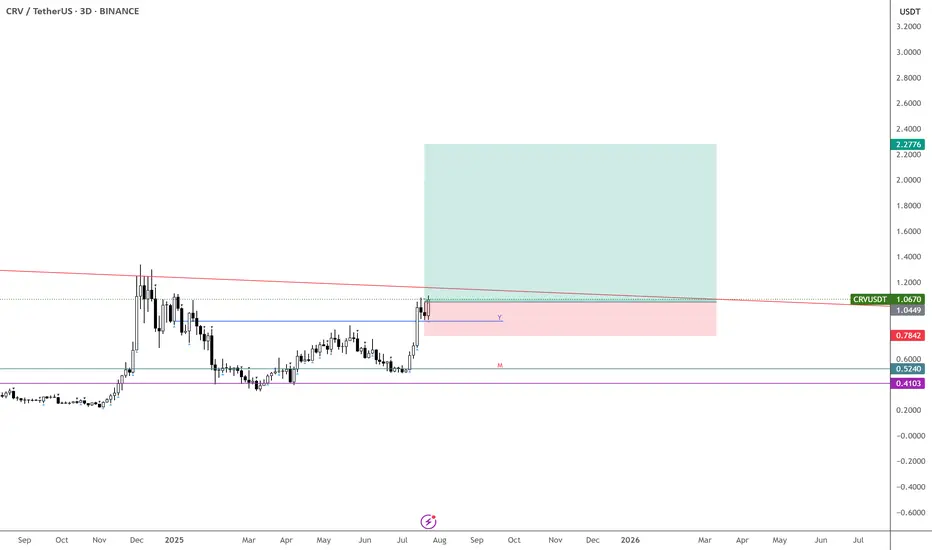
CVR – Ready to Run, Monthly Confirmation In
Tons of strength showing on $CVRUSDT—expecting continuation from here and even more once the trendline breaks.
The monthly candle is confirming the move, pointing to a potential 6-month uptrend. Looks like this one is finally ready for the run we’ve been waiting for.
Buying here and stacking more around 90c if given the chance.
First target: above $2.
BINANCE:ENAUSDT may have gotten away—but this one won’t.
US30: Local Bearish Bias! Short!
My dear friends,
Today we will analyse US30 together☺️
The in-trend continuation seems likely as the current long-term trend appears to be strong, and price is holding below a key level of 44,774.9 So a bearish continuation seems plausible, targeting the next low. We should enter on confirmation, and place a stop-loss beyond the recent swing level.
❤️Sending you lots of Love and Hugs❤️

Cardano (ADA) Just Flipped Bullish — Next Stop: $0.9373?ADAUSDT is currently displaying a strong bullish structure on the 4-hour chart, bouncing from a critical support zone near $0.7774–$0.7315. After a healthy retracement, the pair appears to be regaining momentum, forming a potential higher low, which aligns with the continuation of the broader uptrend that started earlier this month.
Recent price action confirms that buyers are stepping in at key zones previously marked by blue “B” labels, and sell-side pressure seems to be weakening after the last swing top around $0.9373. The support zones, marked with dotted green lines, have held well, and the current structure suggests a rebound toward the previous high.
The most recent small leg up shows the formation of a bullish engulfing setup near $0.78, which could serve as a launch point toward the higher resistance. The candlesticks are also showing longer lower wicks — a sign that buyers are defending lower levels aggressively. With price currently floating near $0.81, there’s a good upside window available.
Here’s the trading setup based on the chart:
• Entry: Around $0.8106 (current price zone)
• Take Profit (TP): $0.9373 (previous swing high — +18.23%)
• Stop Loss (SL): $0.7315 (invalidates higher low structure — -7.73%)
• Risk-Reward Ratio: 2.36R (favorable for swing positioning)
If ADA can reclaim the $0.85 zone with strong candle closures, it would signal bullish continuation. Momentum indicators like RSI or MACD (not shown) would likely confirm the shift, especially if divergence was forming on recent dips.
Until ADA breaks below $0.7315, the bullish bias remains intact. The formation of higher lows and increasing buying interest at dynamic supports adds weight to the long setup. Price reclaiming the $0.85 zone may trigger a fast rally to $0.93, and possibly beyond if market-wide sentiment remains risk-on.

Eurousd techinical analysis.Eurousd techinical analysis next move posibale at h1 time frame not finchinal advice.

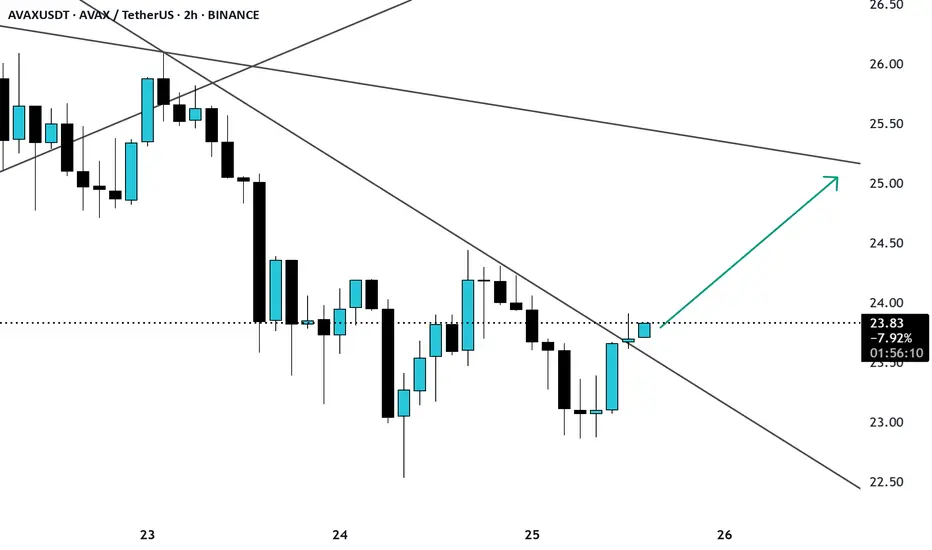
AVAX break of trendline resistance AVAX/USDT is showing a strong breakout attempt on the 2H timeframe, breaking above a descending trendline after multiple rejections from the $23.00 zone.
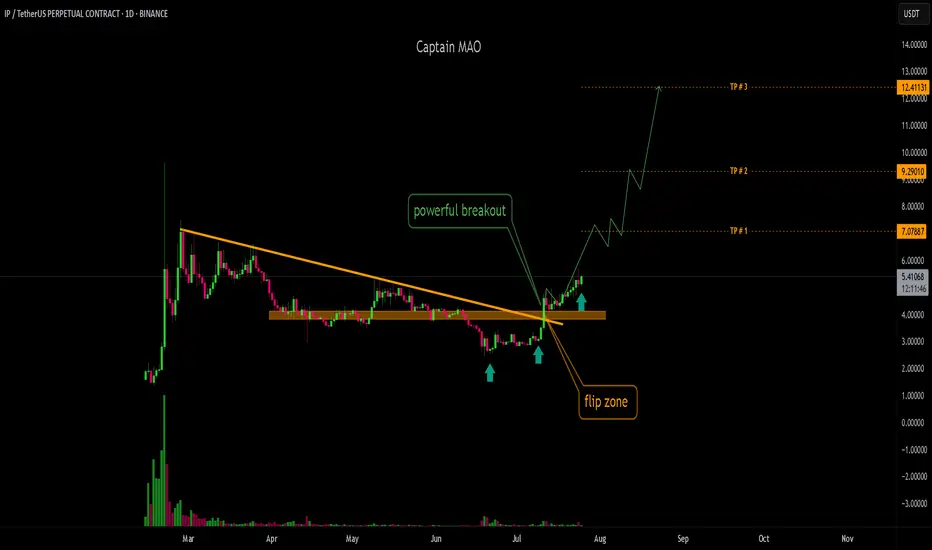
IP/USDT - Continuation P/USDT has formed a solid base support in the $2.60–$2.80 zone over the 20 days, showing strong accumulation. Recently, it broke out of the key $3.30 resistance with significant buying pressure and volume, signaling bullish intent. More importantly, it also broke above a 140 day descending trendline, a major shift in structure. With this clean breakout and confirmation, IP is now looking primed for an upward continuation and potential trend reversal.
DUSK/USDTOn June 12, 2025, DUSK/USDT broke down below the key $0.06 support in a final liquidity grab, shaking out weak hands. Since then, the price has been in clear accumulation, forming a solid base below the $0.06 zone. On July 8, 2025, strong buyers aggressively stepped in, reclaiming the $0.06 level marking the first stage of a potential trend reversal.
Currently, price is holding firmly above this reclaimed zone, showing strength and readiness for a parabolic move as bullish momentum builds up.

XAU/USD (Gold vs US Dollar) 1-hour technical analysis:📉 Support Zones:
3,312.35 – 3,300.00: Strong demand zone (marked in green) – this is your “buy” zone.
3,326.00 – 3,341.27: Intermediate support level, but may not hold under pressure.
📈 Resistance Zones:
3,359.40 – 3,373.04: Near-term resistance.
3,402.78: Key resistance from previous structure high.
🔁 Price Prediction Path:
The hand-drawn path suggests:
Short-term choppy consolidation or fakeouts.
A potential drop into the green demand zone.
Buy opportunity near 3,312 if a reversal signal appears.
Expected bullish reversal toward 3,359+.
📊 Volume Analysis:
Volume spikes near previous demand confirm strong buying interest.
Recent volume tapering indicates a slowdown in selling pressure.
✅ Potential Trade Setup:
Buy Limit: Around 3,312.00 – 3,305.00
Stop Loss: Below 3,300.00
Take Profit: 3,359.00 – 3,373.00
Risk/Reward Ratio: Favorable if entry is timed with confirmation (e.g., bullish engulfing, double bottom, or volume spike).

DOGE 30m – Trendline Break + Bearish Divergence = Clean ReversalThis DOGE 30-minute chart offered a textbook reversal sequence:
Price was riding a clean ascending trendline with support from moving averages and strong bullish structure. But things shifted fast.
We saw:
– A clear MACD bearish divergence (momentum fading as price pushed higher)
– A trendline break and lower high, signaling loss of bullish control
– Former support flipped into resistance, confirming the structure shift
– Price now consolidating near the last major demand zone
If this zone breaks, expect continuation lower. If it holds, this could become a temporary bounce area — but momentum is clearly in the bears’ hands for now.
Zoom out for confluence and track price behavior around this zone for your next move.
#DOGE #CryptoTrading #TechnicalAnalysis #MACD #ReversalSetup #TrendlineBreak #SupportResistance #QuantTradingPro

Ethereum Analysis + Market Overview 🚀 Ethereum Analysis + Market Overview 🚀
Before diving into Ethereum, let’s quickly review the overall market conditions 👇👇👇
(For a more detailed market analysis, you can check my previous post, I’ll link it below.)
---
🔹 Analysis style:
Reviewing previous highs/lows breakouts in the mid-term (MWC - 4H).
Entries based on momentum & volume.
---
♦️ USDT.D
Support: 4.22
Max expected correction: 4.51
If 4.51 breaks upward, this could push us toward short positions.
---
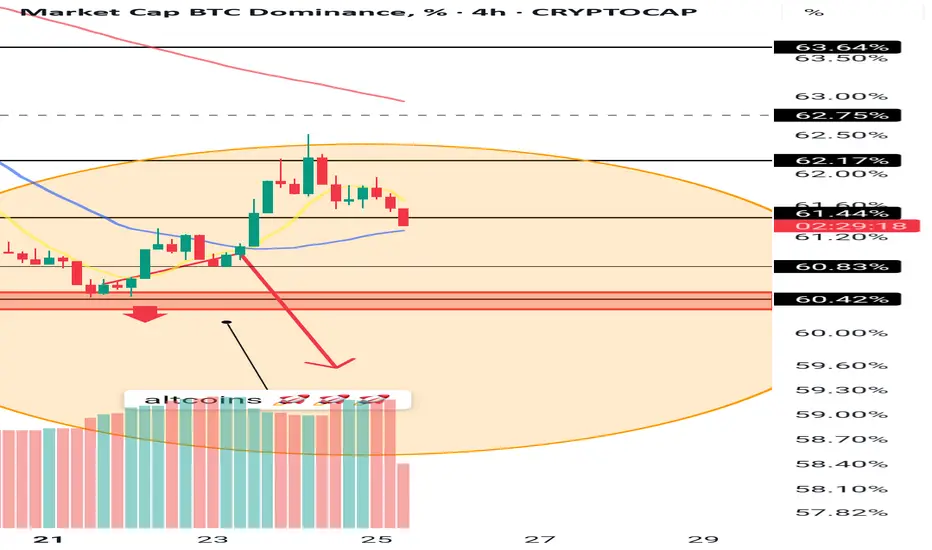
♦️ BTC.D
Yesterday’s levels & analysis still remain valid.
Remember, on HWC (1D), after the recent downtrend, there’s only been one bullish candle.
For altcoins to rally: BTC.D must drop below 61.6 → 60.83 → 60.42.
Otherwise, if BTC.D grows (bearish for alts), 62.17 is the key resistance to watch.
---
♦️ TOTAL (Crypto Market Cap)
Must break 3.91 to confirm a bullish trend.
Early signal: 3.85 (1H timeframe).
---
♦️ TOTAL2 (Altcoin Market Cap)
Early bullish signal: 1.48
Confirmation level: 1.55
---
♦️ ETH (Ethereum)
Ethereum has shown strong support around 3500, despite the 48-hour drop, which reflects solid buying activity.
Additionally, positive whale news is increasing.
Early & risky trigger: 3653 (1H) – already broken.
Next potential entries:
3750 (1H)
3833 (4H)
Preferred entry: 3750, as it allows a tighter & safer stop-loss.
Beware: Fake breakout probability around 3833 is high.
Stop-loss for all 3 levels: 3455.
---
🔸 Entry Strategy:
If volume & momentum increase → place a stop-buy order on the exchange.
If volume is weak → wait for confirmed breakout above 3750.
---
♦️ ETH.D
The chart is fully bullish.
If ETH hits 3750, an early long position could be taken.
---
💎 Follow me & hit 🚀 for more real-time updates and setups!
---

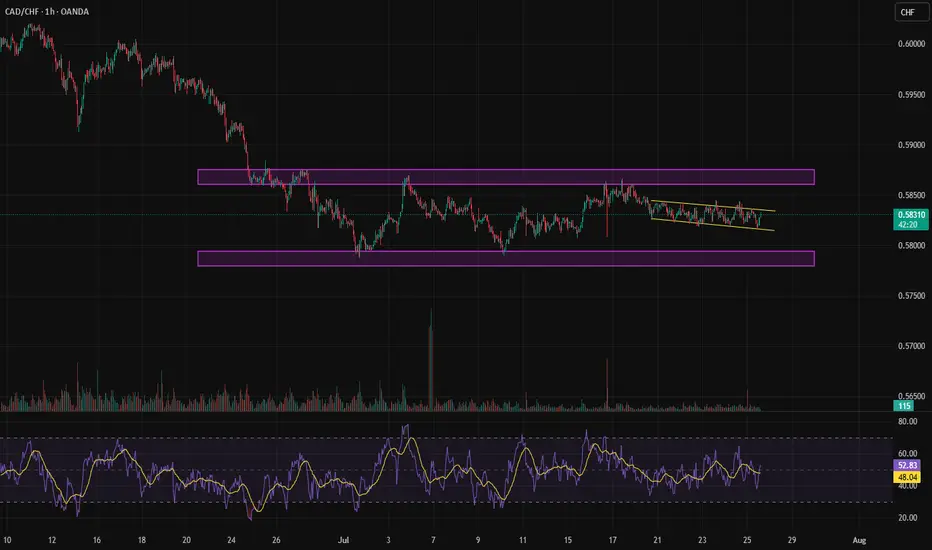
Close to breaking out of the range.After nearly 31 days, a consolidation has formed within the range, which could signal either a buy or sell opportunity.
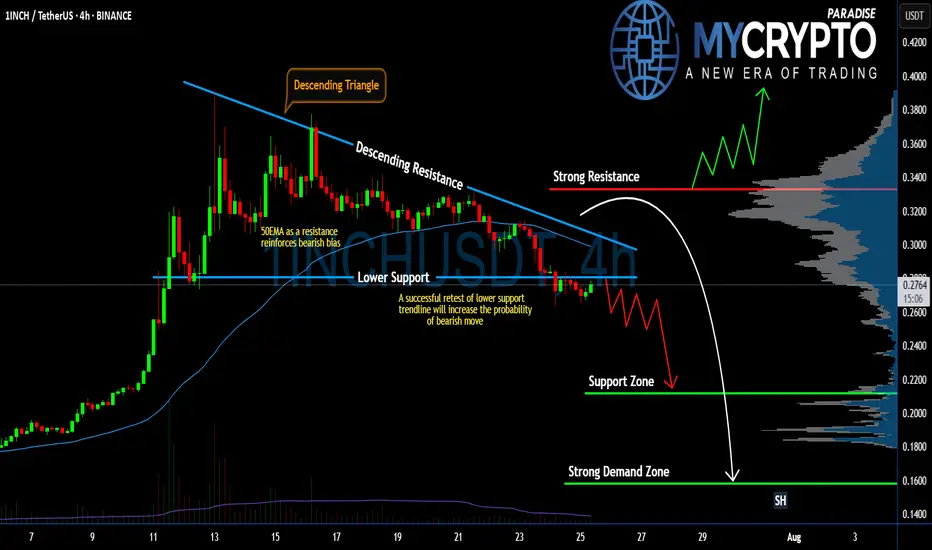
#1INCH Setup Favors Bears | Can Bears Pull it Down Further? Yello Paradisers! Are you prepared for what might be the next big move on #1INCHUSDT? The #1INCHNetwork is flashing clear warning signs:
💎#1INCH is currently trading inside a Descending Triangle, a pattern that historically favors bears. The price has broken down the lower support and is coming to retest it. If #INCHUSD retests the lower support and doesn't enter the descending triangle, the probability of the bearish pressure will increase.
💎The 50 EMA is acting as a strong dynamic resistance, reinforcing the bearish bias. Every attempt to reclaim higher levels has been rejected, and as long as we remain capped below the descending resistance, bulls are at a clear disadvantage.
💎A successful retest of the lower support trendline will significantly increase the probability of a breakdown. If this triangle finally breaks to the downside, we should be watching the $0.2116 support zone as the first key level to catch any temporary reaction.
💎But the real danger — and opportunity for patient traders — lies lower. If $0.2116 fails, the next strong demand zone sits at $0.1582, which could be the level where real buyers finally step back in. Until then, any bullish scenario remains invalid unless the price breaks and closes above the strong resistance at $0.3332.
Trade smart, Paradisers. This setup will reward only the disciplined.
MyCryptoParadise
iFeel the success🌴
Market Analysis – Key Levels to Watch!
🔥 Market Analysis – Key Levels to Watch! 🔥
❗️The market is unstable, and fear is visible – but let’s break down what’s next!
♦️ Recap of Yesterday’s Analysis:
✅ We discussed the potential altcoin rally – but only if BTC.D and USDT.D confirm.
✅ We also warned about fake breakouts in alts.
Over the last 24 hours, many altcoins spiked on the 1H timeframe, but due to low volume & weak momentum, and no confirmation from BTC.D & USDT.D, a fake breakout occurred.
🟢 Current Market Outlook:
The best move right now is to wait for BTC.D and USDT.D reactions to the key levels I’ll highlight below.
If the market turns bullish & BTC dominance drops, coins like ADA, DOGE, XRP, BNB, SOL, SUI, ETH will be on my radar.
👉 I’ll try to analyze a few of these coins before the next potential move and share trade setups. 🚀 Stay tuned!
♦️ BTC (Bitcoin)
• Sellers have pushed price into buyer micro-zones.
• Key support: 111
• Two bullish scenarios:
1️⃣ Price hits 111, ranges for a while, then breaks the range top upward → long setup.
2️⃣ A sharp bullish candle forms. If BTC.D drops on the same move, I’ll look for alts near previous highs for potential entries.
♦️ USDT.D
• Support: 4.22
• Max correction: 4.51
• If this level breaks upward → short setups will be in play.
♦️ BTC.D
• Yesterday’s analysis is still valid.
• After the recent downtrend on 1D (HWC), there’s only one bullish candle.
• For alts to rally: BTC.D must break 61.6 → 60.83 → 60.42 downward.
• If BTC.D rises instead, watch 62.17 as a critical level for altcoin drop scenarios.
♦️ TOTAL (Crypto Market Cap)
• Needs to break 3.91 to confirm bullish momentum.
• Early signal: 3.85 (1H timeframe).
♦️ TOTAL2 (Altcoin Market Cap)
• Early bullish signal: 1.48
• Strong confirmation: 1.55
💎 Follow me & hit 🚀 if you want real-time updates before the next big move!