USDJPY Under Pressure! SELL!
My dear subscribers,
My technical analysis for USDJPY is below:
The price is coiling around a solid key level - 147.83
Bias - Bearish
Technical Indicators: Pivot Points High anticipates a potential price reversal.
Super trend shows a clear sell, giving a perfect indicators' convergence.
Goal - 147.34
My Stop Loss - 148.12
About Used Indicators:
By the very nature of the supertrend indicator, it offers firm support and resistance levels for traders to enter and exit trades. Additionally, it also provides signals for setting stop losses
Disclosure: I am part of Trade Nation's Influencer program and receive a monthly fee for using their TradingView charts in my analysis.
———————————
WISH YOU ALL LUCK
Trend Analysis

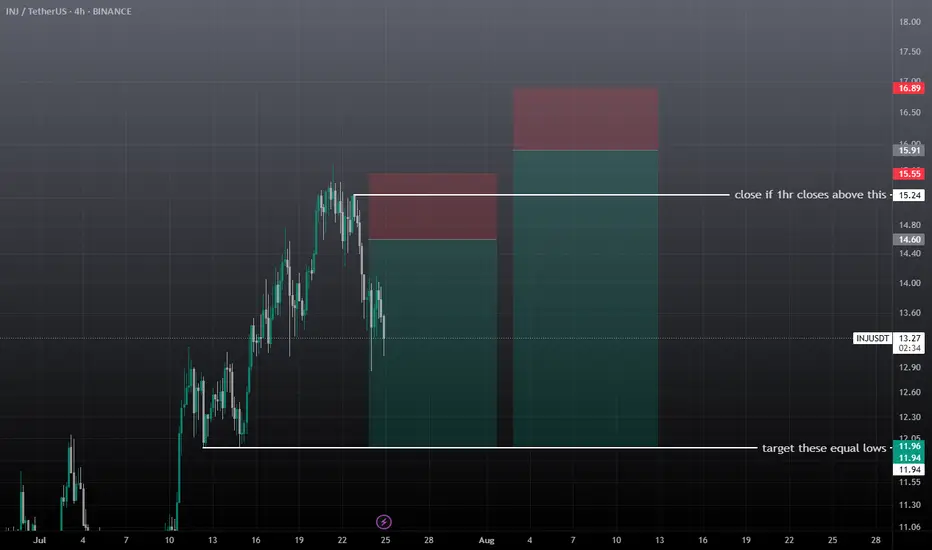
inj swing short setupWait for the entry, don't take it at current market price, entry can take time. There are two short setups forming on injusdt, after achieving the first entry if 1hr closes above the mentioned zone then close trade before sl, and then take the 2nd short setup, if tp achieves first then don't take the trade wait for the new setup.
SAHARAUSDT Forming Bullish PennantSAHARAUSDT is currently forming a bullish pennant pattern, a continuation pattern that often signals the resumption of an upward trend after a brief consolidation. This pattern, combined with strong volume support, is a positive technical indicator suggesting the potential for a significant breakout. Traders are now watching for a confirmed move above the pennant resistance, which could propel the price to new short-term highs. Based on the pattern’s breakout projection, an 80% to 90%+ gain seems realistic in the coming sessions.
SAHARA has been gaining traction among investors due to its unique ecosystem and expanding real-world applications. With increased social media buzz and rising transaction volumes, sentiment around the project appears to be shifting toward the bullish side. This renewed investor interest could act as a fundamental catalyst to support the anticipated technical breakout.
Furthermore, the overall structure of SAHARAUSDT shows consistent higher lows forming into the apex of the pennant, reflecting growing buying pressure. The breakout from this structure, especially with increasing volume, typically indicates a strong follow-through move. With broader market momentum aligning and attention turning back to micro-cap altcoins, SAHARA may stand to benefit from speculative capital rotation.
With the chart structure supporting bullish continuation and volume confirming underlying demand, SAHARAUSDT is shaping up to be a strong candidate for aggressive upside potential. It's a setup that technical traders and short-term swing investors may want to keep close on their radar.
✅ Show your support by hitting the like button and
✅ Leaving a comment below! (What is You opinion about this Coin)
Your feedback and engagement keep me inspired to share more insightful market analysis with you!

BTC / USD Daily ChartHello traders. This chart is for leveraged Bitcoin traders. Anyone freaking out about what Bitcoin will do should know that this dip now is only about a 10% dip or so from the ATH. We could easily shake out all the long positions in profit by revisiting the area marked on the chart. These temporary dips are for buying, not for getting taken out. Never forget that in order for you to win a trade using a leveraged account, someone or some entity must lose a trade. So it's better to try and ride the wave and trade the trend than to think we can outsmart algolorithmic stop loss hunting programs designed to take your profits. Better to DCA Bitcoin and Ethereum than to take chances of blowing your account on a perfect, yet volatile asset like BTC. Big G gets my thanks. Be well and trade the trend. Happy Friday.

Crypto market review [UPD]: set-ups in BTC and alt-coinsMade a quick video going over some of the setups I see developing in Bitcoin and a few altcoins I personally track and trade.
Thank you for your attention and I wish you successful trading decisions!
If you’d like to hear my take on any other coin you’re following — feel free to ask in the comments (just don’t forget to boost the idea first 😉).

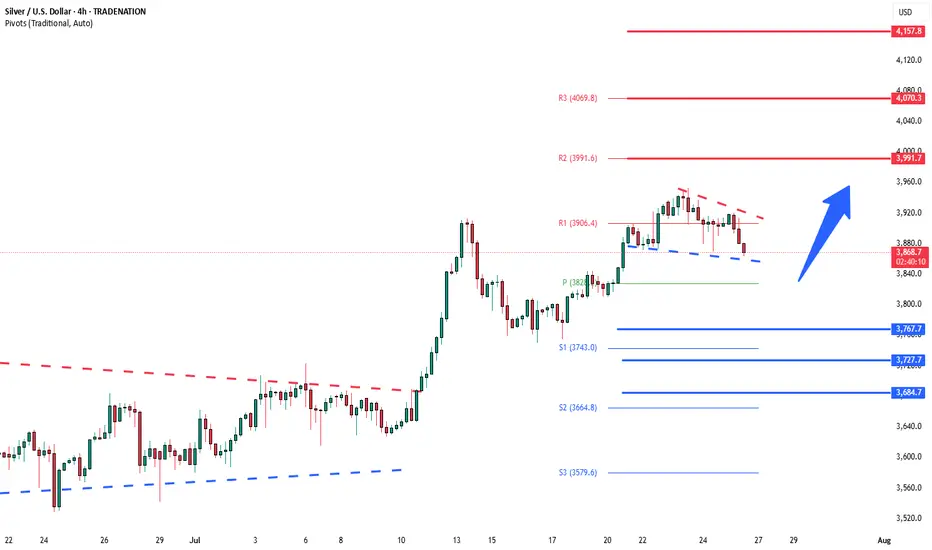
Silver bullish sideways consolidation The Silver remains in a bullish trend, with recent price action showing signs of a continuation breakout within the broader uptrend.
Support Zone: 3686 – a key level from previous consolidation. Price is currently testing or approaching this level.
A bullish rebound from 3686 would confirm ongoing upside momentum, with potential targets at:
3814 – initial resistance
3865 – psychological and structural level
3920 – extended resistance on the longer-term chart
Bearish Scenario:
A confirmed break and daily close below 3686 would weaken the bullish outlook and suggest deeper downside risk toward:
3645 – minor support
3590 – stronger support and potential demand zone
Outlook:
Bullish bias remains intact while the Silver holds above 3686. A sustained break below this level could shift momentum to the downside in the short term.
This communication is for informational purposes only and should not be viewed as any form of recommendation as to a particular course of action or as investment advice. It is not intended as an offer or solicitation for the purchase or sale of any financial instrument or as an official confirmation of any transaction. Opinions, estimates and assumptions expressed herein are made as of the date of this communication and are subject to change without notice. This communication has been prepared based upon information, including market prices, data and other information, believed to be reliable; however, Trade Nation does not warrant its completeness or accuracy. All market prices and market data contained in or attached to this communication are indicative and subject to change without notice.
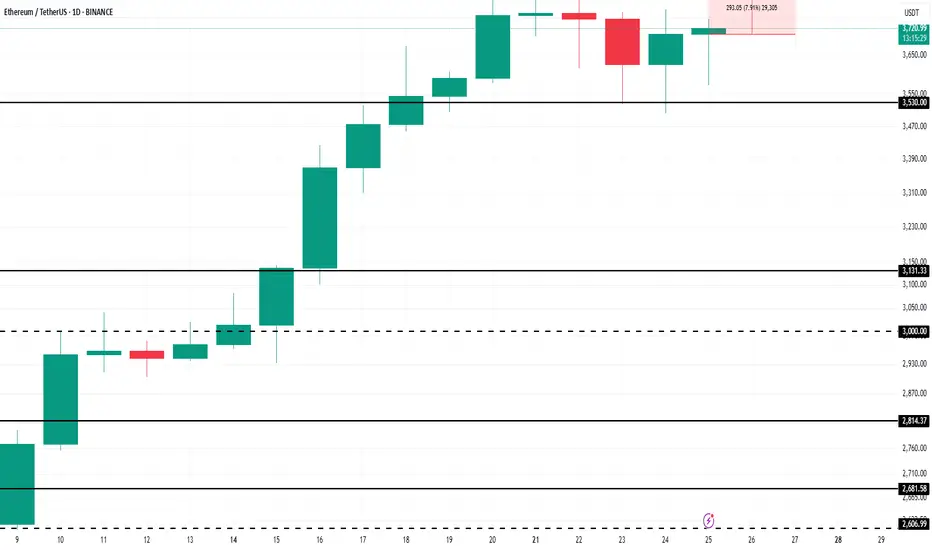
Ethereum’s $4,000 Target Alive as Historic Rally Signs EmergeBINANCE:ETHUSDT is currently trading at $3,680, just 9% away from the critical $4,000 resistance that many investors have been waiting for over the past seven months. The altcoin is expected to continue its upward momentum despite the recent consolidation, with the potential to breach the $4,000 mark soon.
Looking at broader technical indicators, the NUPL (Net Unrealized Profit/Loss) suggests that BINANCE:ETHUSDT is poised for a significant rally . The NUPL indicator, when reaching a threshold of 0.5, traditionally signals a pause in the uptrend, followed by a sharp rally.
$ BINANCE:ETHUSDT is currently nearing this threshold , which, in the past, has marked the beginning of powerful upward price action.
As long as BINANCE:ETHUSDT remains above its key support levels, the price is likely to surge toward $4,000 . If Ethereum can maintain its momentum, a breach of $4,000 could act as a catalyst for further gains.
However, should unforeseen selling pressure arise, $BINANCE:ETHUSDTprice could slip below the $3,530 support level. In such a scenario, Ethereum may fall to $3,131, invalidating the current bullish outlook. The key will be maintaining support and capitalizing on the retail-driven surge.
BTCUSD | Long | Volume Confirmation (Jul 25, 2025)BTCUSD | Long | Breakout Momentum & Volume Confirmation (Jul 25, 2025)
1️⃣ Quick Insight:
Bitcoin is showing strong bullish momentum after breaking out of its triangle pattern with volume. The move looks set to continue, and we may see higher levels if momentum holds.
2️⃣ Trade Parameters:
Bias: Long
Stop Loss: $109k (risk-adjusted "invisible" stop)
TP1: $121k (partial take profit)
TP2: $131k (final target if momentum extends)
3️⃣ Key Notes:
Short-term, price could test $96k before reaching higher targets.
Longer-term outlook points to potential upside between $112k–$120k if structure holds.
Watching reaction closely around the $109k area as it will determine if the uptrend stays intact.
I expect the pump phase to potentially wrap up around October 20, 2025.
S&P 500 is also at key levels, and its direction could influence Bitcoin’s momentum.
💬 What are your targets for Bitcoin? 140k? 180k? 240k? Drop your thoughts below!
"Please LIKE 👍, FOLLOW ✅, SHARE 🙌 and COMMENT ✍ if you enjoy this idea! Also share your ideas and charts in the comments section below! This is best way to keep it relevant, support us, keep the content here free and allow the idea to reach as many people as possible."
Disclaimer: This is not financial advice. Always do your own research. This content may include enhancements made using AI.

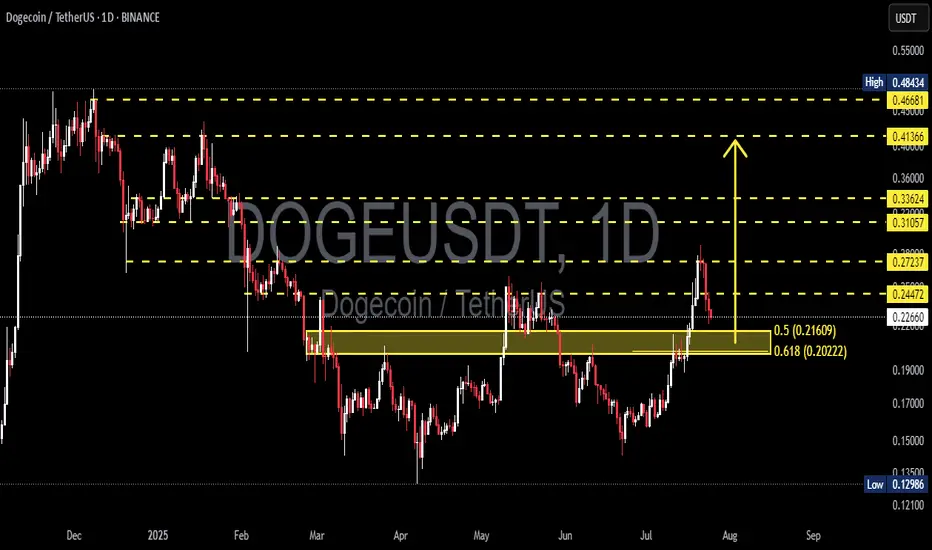
DOGEUSDT at a Make-or-Break Level: Bounce or a Breakdown?📉 Overview:
After a strong rally from the $0.13 zone to a recent local high of $0.272, DOGE is now undergoing a healthy correction. The price has retraced to a critical Fibonacci Golden Pocket zone (0.5–0.618) between $0.21609 and $0.20222 — historically one of the most powerful zones for market reactions.
This area also aligns with a previous resistance zone that is now being retested as support — a classic SR Flip (Support/Resistance Flip).
---
📌 Key Technical Structure:
🔸 Support & Demand Zone (Golden Pocket):
$0.21609 (Fib 0.5) and $0.20222 (Fib 0.618) – key retracement levels of the recent bullish swing.
Acts as a confluence zone with horizontal support from prior consolidation.
🔸 Major Resistance Levels:
$0.24472 – immediate resistance to reclaim.
$0.27237 – recent high and a major supply zone.
$0.31057, $0.33624 – historical distribution zones.
$0.41366 – breakout confirmation zone for a full trend reversal.
---
🧠 Market Psychology & Patterns:
Breakout & Retest: DOGE recently broke out from a long-term range and is now retesting the breakout zone.
Potential Bull Flag or Descending Channel: Current pullback resembles a flag or bull pennant — both continuation patterns if confirmed with volume.
---
✅ Bullish Scenario (Bounce):
If DOGE holds the Golden Pocket ($0.216–$0.202) and prints a strong bullish reversal candle:
A bounce may push price back to $0.244, and if reclaimed, back to $0.272.
A confirmed breakout above $0.272 with volume could lead to:
Mid-term targets: $0.310 → $0.336 → $0.413 → $0.466.
📈 Confirmation: Daily candle close above $0.244 with rising volume.
---
❌ Bearish Scenario (Breakdown):
If price fails to hold above $0.202 and breaks below with daily close:
It signals invalidation of the bullish structure and possible reversal.
Downside targets:
$0.186 – short-term support.
$0.150 – psychological support.
$0.129 – Year-to-date low (YTD Low).
This would also form a Lower High – Lower Low structure indicating a shift to a bearish trend.
---
🔍 Volume & Momentum Clues:
Watch for volume spikes near $0.202–$0.216.
Strong green candle + volume = likely reversal.
Weak reaction or breakdown on low volume = potential continuation downward.
---
🎯 Trader Playbook:
Signal Action Target
Bounce from $0.216–$0.202 Long Entry $0.244 – $0.272
Daily close below $0.202 Short / Avoid Longs $0.186 → $0.150
Breakout above $0.272 w/ volume Breakout Entry $0.31 → $0.336 → $0.41+
---
🏁 Conclusion:
DOGE is currently at a critical inflection point. The Golden Pocket zone will likely determine whether bulls are accumulating for another leg up or bears are about to reclaim control.
💡 This is a time for strategy, not prediction. Wait for confirmation before committing to either direction. The market is speaking — all we have to do is listen.
---
📊 Chart Summary:
Timeframe: Daily (1D)
Pattern: Breakout Retest + Fibonacci Retracement + Bull Flag
Structure: Higher High – looking for Higher Low confirmation
#DOGEUSDT #Dogecoin #CryptoTA #GoldenPocket #AltcoinAnalysis #FibonacciTrading #BreakoutSetup #BullishContinuation #BearishReversal
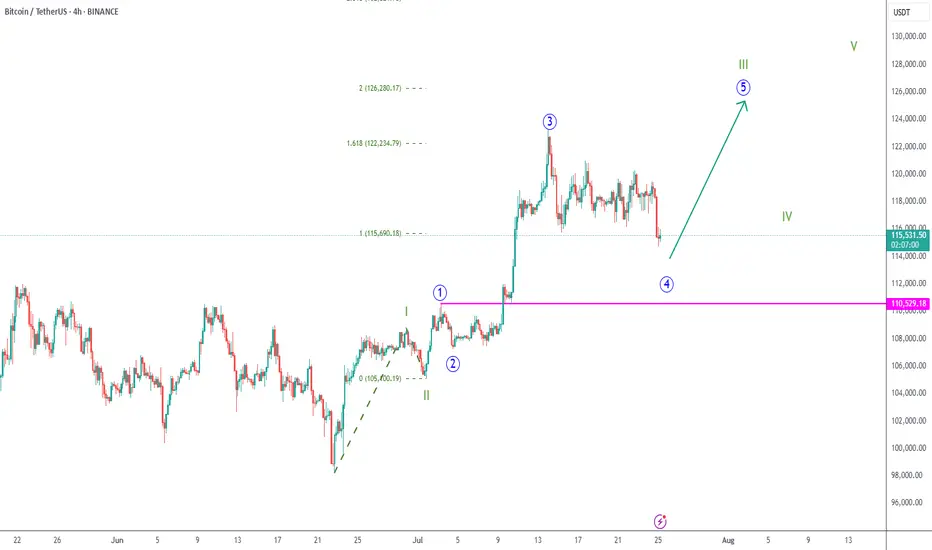
BTC 4H Chart Uptrend
➡️ My wave count considers we're now in blue wave 4, and this corrections should finish soon.
➡️ The 125k round number is an interesting target for green wave III.
➡️ This scenario is valid as long as we stay above blue 1 top (at 110.529).
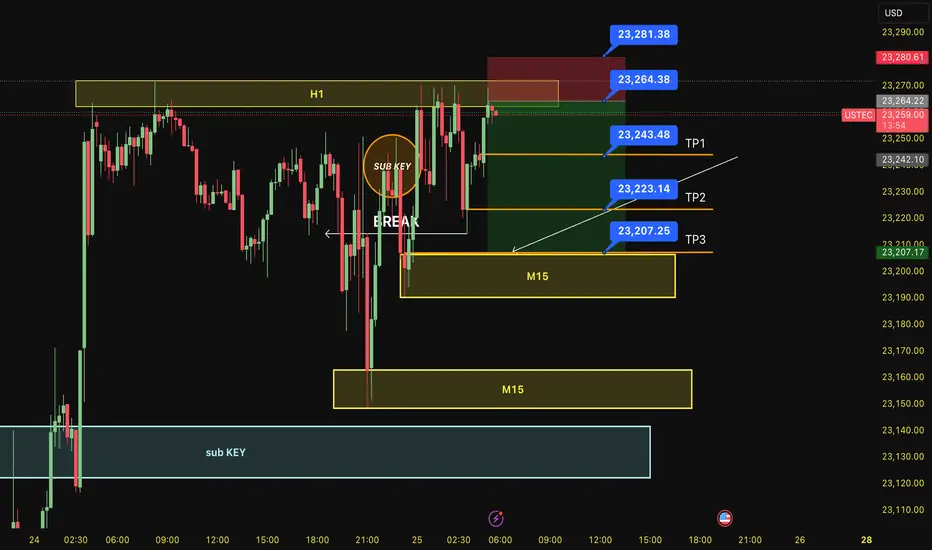
SELL USTEC 25.7.2025Reversal trade order: SELL at H1~M15 (all-time high - ATH)
Type of entry: Limit order
Reason:
- The price breakout the sub key of M15, confirming it will hit the main key M15.
- There is a key H1 support at the entry point.
Note:
- Management of money carefully at the price of bottom of M15 (23,343)
Set up entry:
- Entry sell at 23,264
- SL at 23,281
- TP1: 23,243
- TP2: 23,223
- TP3: 23,207
Trading Method: Price action (No indicator, only trend and candles)
Bitcoin (BTC): OrderBook is Hinting To $115K Bounce | Thoughts?Bitcoin has recently broken the $116K local neckline zone and reached the $115K area, which has been at our attention due to huge orders sitting there.
What we are thinking is that this zone will be a good bounce area, which should lower the price to $120K.
Either way, this zone is important, so keep an eye on it!
Swallow Academy

Terra classic Lunc usdt Daily analysis
Time frame 4hours
Risk rewards ratio =2 👈
Target = 0.000083 $
Double benefit in short time is good for traders

AMD: Potential Mid-Term Reversal from Macro SupportPrice has reached ideal macro support zone: 90-70 within proper proportion and structure for at least a first wave correction to be finished.
Weekly
As long as price is holding above this week lows, odds to me are moving towards continuation of the uptrend in coming weeks (and even years).
1h timeframe:
Thank you for attention and best of luck to your trading!

Bitcoin Btc usdt Daily analysis
Time frame daily
If btc can't break the green uptrend line strongly I guess it drops to 87$
But if btc can continue it's sharp way , my target is 170 $

GBPJPY Is Very Bearish! Sell!
Please, check our technical outlook for GBPJPY.
Time Frame: 7h
Current Trend: Bearish
Sentiment: Overbought (based on 7-period RSI)
Forecast: Bearish
The market is trading around a solid horizontal structure 199.004.
The above observations make me that the market will inevitably achieve 198.074 level.
P.S
Please, note that an oversold/overbought condition can last for a long time, and therefore being oversold/overbought doesn't mean a price rally will come soon, or at all.
Disclosure: I am part of Trade Nation's Influencer program and receive a monthly fee for using their TradingView charts in my analysis.
Like and subscribe and comment my ideas if you enjoy them!

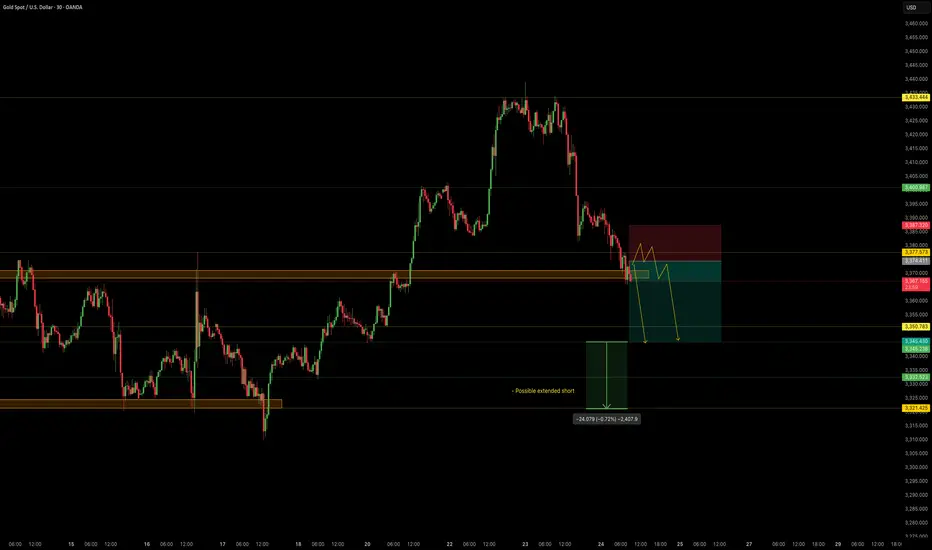
NordKern - XAUUSD InsightNordKern | Simplified Insight OANDA:XAUUSD – Short Opportunity Ahead
Gold is now near our important level at 3370, offering a shorting opportunity considering recent events and technical action.
Gold Price Decline – What's Behind It?
In the last two sessions (July 23–24), gold has retreated strongly owing to a set of global as well as market-specific circumstances:
1. Trade Deal Optimism
Advances in U.S.–Japan and U.S.–EU trade discussions lessened worldwide uncertainty, decreasing demand for gold as a safe-haven.
2. Higher U.S. Yields
Higher Treasury yields are rendering non-yielding assets such as gold less appealing, adding to downward pressure.
3. Technical & Profit-Taking
Following a recent rally, gold was exposed to selling. Stop-loss and profit-taking triggers hastened the fall.
Summary of Key Drivers
U.S. Trade Deals: Reduced geopolitical risk
Higher Treasury Yields: Decreased gold's relative attractiveness
Technical Selling: Enhanced the downward trend
Trade Setup – Bearish Bias
Entry : 3374.4
Stop Loss : 3387.3
Take Profit : 3345.4
Extended Target : 3322
Key Notes:
- Trade Deal Optimism: U.S.–Japan and U.S.–EU agreements eased global tensions, reducing demand for gold as a safe-haven asset.
- Yield Pressure: Rising U.S. Treasury yields made gold less attractive compared to interest-bearing alternatives.
- Technical Selling: Profit-taking and stop-loss triggers accelerated the decline after gold’s recent rally.
This setup remains tactically driven. Manage risk carefully and monitor for any renewed political shifts.
#3,377.80 Resistance remains strongMy position: I have Bought Gold many times above #3,400.80 benchmark however as it got invalidated, I Bought #3,390.80 again late U.S. session and closed my set of Buying orders on #3,395.80 nearby extension. I left one runner (#3,390.80 entry point) with Stop on breakeven expecting Asian session to recover #3,400.80 benchmark, however it was closed on break-even as Gold extended Selling sequence. I will continue Selling every High's on Gold and if #3,357.80 gives away, expect #3,352.80 and #3,342.80 contact points to be met.
As expected Gold delivered excellent #3,372.80 and especially #3,365.80 - #3,352.80 Selling opportunities throughout yesterday's session which I utilized to it's maximum. I have also Bought Gold on late U.S. session with #3,372.80 as an entry point / however since Gold was ranging, I closed my order on break-even and met Gold below #3,352.80 benchmark this morning personally on my surprise (I did expected #3,377.80 to be invalidated to the upside).
Technical analysis: Gold’s Price-action is performing well below both the Hourly 4 chart’s and Daily chart’s Resistance zones for the cycle. Selling direction of today’s session is directly correlated with Fundamentals leaving the scene which found Sellers near the Intra-day #3,377.80 Resistance and most likely DX will close the Trading week in green, however struggling to make Bullish comeback and if #3,327.80 - #3,342.80 reverses the Selling motion, Gold’s Daily chart’s healthy Technicals which preserved core uptrend values. If the Price-action gets rejected at #3,352.80 - #3,357.80 Resistance zone, then further decline (under conditions where I will have more information with U.S.’s session candle) is possible and cannot be ruled out. Notice that at the same time and manner, Bond Yields are on consecutive Selling spree as well which Fundamentally has a diagonal correlation with Gold. The slightest uptrend continuation there, should add enormous Selling pressure on Gold.
My position: I am Highly satisfied with recent results and will take early weekend break (no need to Trade more). If however you decide to Trade today, Sell every High's on Gold / no Buying until Monday's session (my practical suggestion).

USDCAD SELL TRADEOpportunity to sell on USDCAD
ENTRY: 1.36800
STOP LOSS: 1.37000
TAKE PROFIT: 1.36100
Note: Higher Timeframe Zone level
Support turn to Resistance
Comment your opinion pls.
For Account Management. Contact me on X @shajudeakinoba1 Good Proift Splitting

Are old PEPE meme dead?🔥 The alt season is beginning on the market. Many alts are yielding tens and even hundreds of percent per day. But there are also those among them from whom we clearly expected more.
And I'm talking about old memes like Doge, PEPE, SHIB, and others.
Over the past month, PEPE has grown by only 60%. Is everything really that bad? Let me explain:
1️⃣ The latest growth impulse formed a divergence with the price in terms of volume. Throughout the growth over the last 4 months, purchase volumes continued to decline. This signals a waning interest in PEPE as the price rises.
2️⃣ Money Flow also shows a near-total lack of new liquidity. Fresh money is not flowing into the asset, and even now, in such an euphoric phase, PEPE's liquidity indicator is in the neutral zone.
3️⃣ PEPE has formed a local lower high and has already deviated from resistance at $0.00001439. It has already corrected by 6% today. This shows that there is currently no liquidity in the asset to drive the price higher.
4️⃣ GAP was formed at the levels of $0.00001241 - $0.00001027. And as we know, 99% of GAPs close sooner or later.
Nevertheless, we see high levels of interest at lower prices. When the fifth 0 appears. However, these zones can also change quickly in the event of a major correction of the entire market, and no other correction will bring the asset to such prices in the short term.
📌 Conclusion:
Right now, old memes really do look sad. Thousands of new memes are created every day that can give big returns, and people are asking themselves, “If I buy a meme with no value, why should I buy an old one?”
🔔 So, at current prices, PEPE is clearly of no interest to anyone. But, as is usually the case, once such coins fall below a certain price, whales will take positions and start pushing them up. Everyone will suddenly notice how undervalued this wonderful coin was.
So, for those who want to buy, I advise you to relax, you are not missing out on anything. And there will definitely be better prices for buying.
And stay in tune by subscribing, for more insightful ideas!

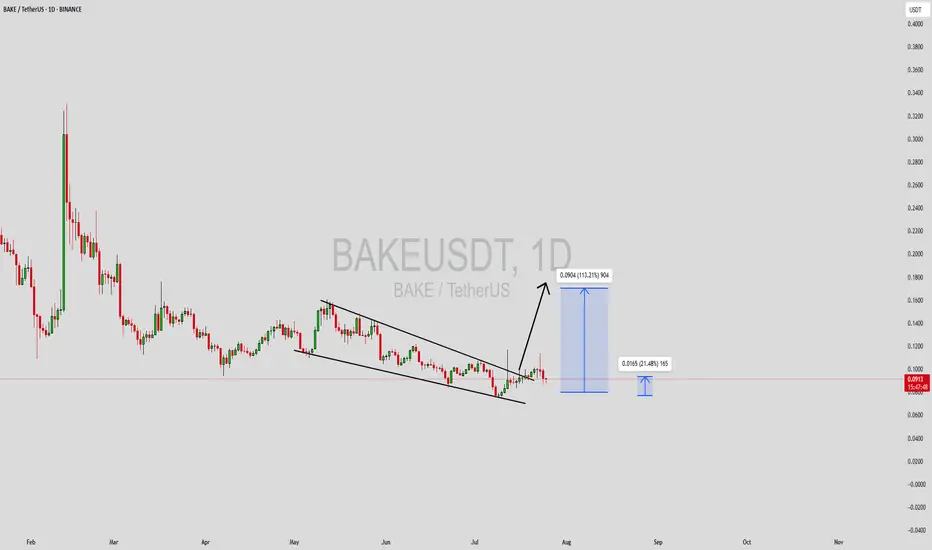
BAKEUSDT Forming Falling WedgeBAKEUSDT is presenting an interesting breakout scenario after forming a clean falling wedge pattern on the daily chart. Falling wedges are typically bullish reversal patterns, especially when confirmed by a breakout with volume. In this case, the wedge appears to be breaking to the upside, supported by a noticeable uptick in buying volume. Technical projections are pointing toward a potential price increase of 90% to 100%+, making this setup a valuable opportunity for swing traders and momentum investors.
BAKE (BakeryToken) remains an integral part of the DeFi and NFT landscape, particularly within the Binance Smart Chain ecosystem. Its utility, paired with renewed market attention and increased community engagement, could act as a fundamental driver behind this projected upward move. With the crypto market gradually rotating back into altcoins, BAKE could benefit from speculative capital flowing into undervalued DeFi assets.
Traders should keep a close watch on key resistance breakouts and continuation volume patterns. A confirmed daily candle close above the wedge resistance would further validate the bullish breakout thesis. Additionally, historical price action shows that BAKE has the potential to move sharply once momentum kicks in, offering a favorable risk-to-reward setup.
Overall, the technicals align well with rising investor sentiment. If the broader crypto environment stays supportive, BAKEUSDT could see a strong recovery rally in the short to mid term.
✅ Show your support by hitting the like button and
✅ Leaving a comment below! (What is You opinion about this Coin)
Your feedback and engagement keep me inspired to share more insightful market analysis with you!
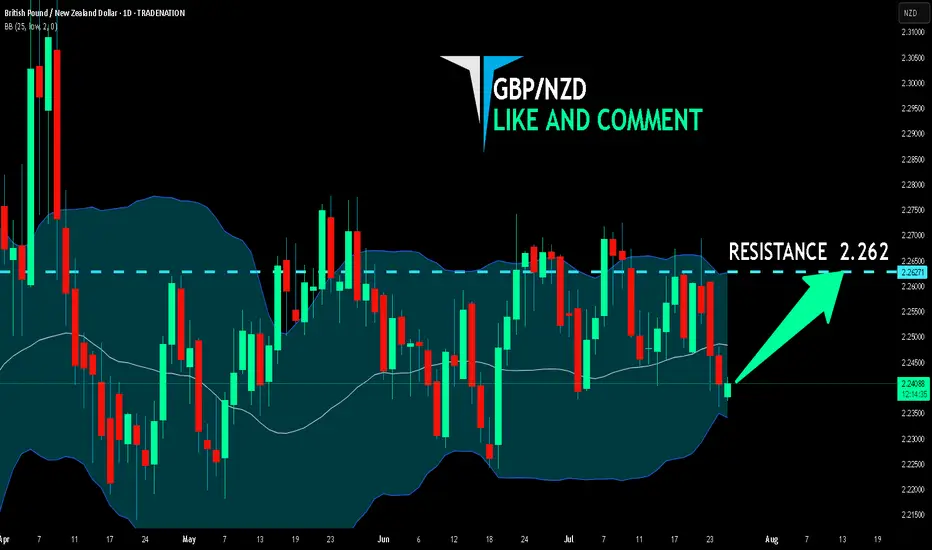
GBP/NZD BEST PLACE TO BUY FROM|LONG
Hello, Friends!
We are going long on the GBP/NZD with the target of 2.262 level, because the pair is oversold and will soon hit the support line below. We deduced the oversold condition from the price being near to the lower BB band. However, we should use low risk here because the 1W TF is red and gives us a counter-signal.
Disclosure: I am part of Trade Nation's Influencer program and receive a monthly fee for using their TradingView charts in my analysis.
✅LIKE AND COMMENT MY IDEAS✅