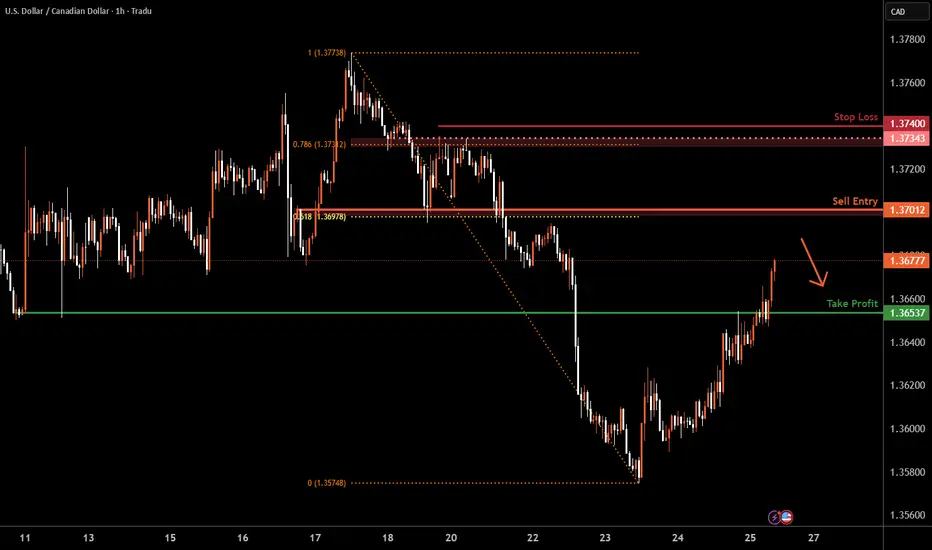
USD/CAD H4 | Potential bearish reversalUSD/CAD is rising towards an overlap resistance and could potentially reverse off this level to drop lower.
Sell entry is at 1.3701 which is an overlap resistance that aligns with the 61.8% Fibonacci retracement.
Stop loss is at 1.3740 which is a level that sits above the 78.6% Fibonacci retracement and an overlap resistance.
Take profit is at 1.3653 which is a pullback support.
High Risk Investment Warning
Trading Forex/CFDs on margin carries a high level of risk and may not be suitable for all investors. Leverage can work against you.
Stratos Markets Limited (tradu.com ):
CFDs are complex instruments and come with a high risk of losing money rapidly due to leverage. 66% of retail investor accounts lose money when trading CFDs with this provider. You should consider whether you understand how CFDs work and whether you can afford to take the high risk of losing your money.
Stratos Europe Ltd (tradu.com ):
CFDs are complex instruments and come with a high risk of losing money rapidly due to leverage. 66% of retail investor accounts lose money when trading CFDs with this provider. You should consider whether you understand how CFDs work and whether you can afford to take the high risk of losing your money.
Stratos Global LLC (tradu.com ):
Losses can exceed deposits.
Please be advised that the information presented on TradingView is provided to Tradu (‘Company’, ‘we’) by a third-party provider (‘TFA Global Pte Ltd’). Please be reminded that you are solely responsible for the trading decisions on your account. There is a very high degree of risk involved in trading. Any information and/or content is intended entirely for research, educational and informational purposes only and does not constitute investment or consultation advice or investment strategy. The information is not tailored to the investment needs of any specific person and therefore does not involve a consideration of any of the investment objectives, financial situation or needs of any viewer that may receive it. Kindly also note that past performance is not a reliable indicator of future results. Actual results may differ materially from those anticipated in forward-looking or past performance statements. We assume no liability as to the accuracy or completeness of any of the information and/or content provided herein and the Company cannot be held responsible for any omission, mistake nor for any loss or damage including without limitation to any loss of profit which may arise from reliance on any information supplied by TFA Global Pte Ltd.
The speaker(s) is neither an employee, agent nor representative of Tradu and is therefore acting independently. The opinions given are their own, constitute general market commentary, and do not constitute the opinion or advice of Tradu or any form of personal or investment advice. Tradu neither endorses nor guarantees offerings of third-party speakers, nor is Tradu responsible for the content, veracity or opinions of third-party speakers, presenters or participants.
Trend Analysis
SYNUSDT Forming Falling WedgeSYNUSDT is currently exhibiting a falling wedge pattern, a classically bullish structure that often precedes a breakout to the upside. This setup forms when price action contracts between two downward-sloping trend lines, indicating a slowing of selling momentum and the potential for a strong reversal. As SYNUSDT trades within this narrowing range, increasing investor interest and a notable uptick in volume suggest that a breakout could be on the horizon.
A falling wedge pattern, when supported by good volume, often signals accumulation by smart money ahead of a bullish reversal. With SYN (Synapse) being a prominent player in the cross-chain interoperability and bridging space, the project continues to attract both retail and institutional attention. The expected gain of 290% to 300% aligns with previous breakout behaviors seen from similar wedge patterns in SYN’s trading history. As the crypto market gradually recovers from recent volatility, assets with solid use cases and active development teams are likely to outperform—and SYN fits that profile.
Technical indicators such as RSI and MACD are showing early signs of a reversal, supporting the bullish bias. A confirmed breakout above the upper trendline with a sustained volume increase could trigger a swift rally, reclaiming previous resistance zones and offering traders an attractive risk-to-reward ratio. The 4H and daily charts suggest momentum is building, which makes this a key watchlist candidate in the short term.
With its real-world utility in DeFi infrastructure and increasing partnerships, SYN is becoming a cornerstone for multichain liquidity transfers. SYNUSDT may be poised for a meaningful upward move if this falling wedge pattern completes successfully.
✅ Show your support by hitting the like button and
✅ Leaving a comment below! (What is You opinion about this Coin)
Your feedback and engagement keep me inspired to share more insightful market analysis with you!

Bitcoin/TetherUS (BTC/USDT) on a 4-hour timeframeOverall Trend & Price Action:
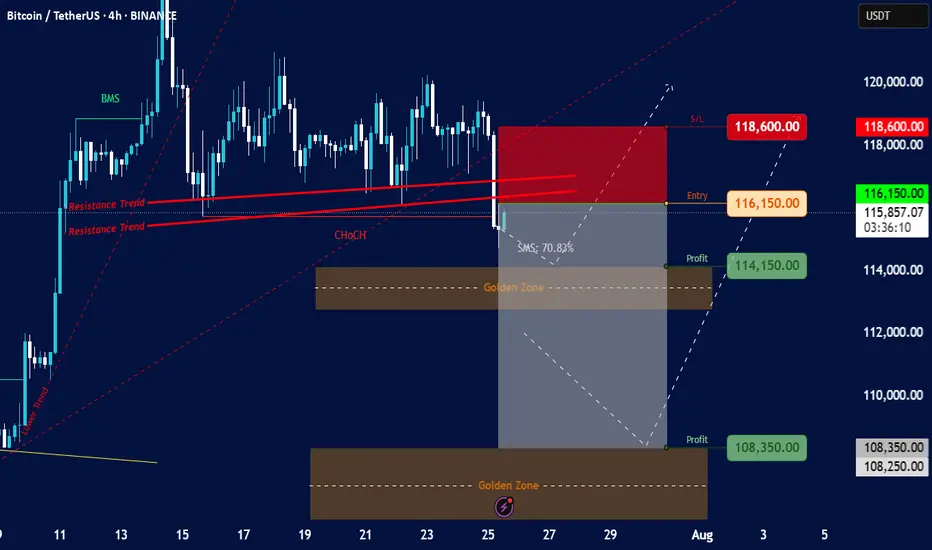
Prior Uptrend: The chart shows a clear uptrend leading up to around July 15th, marked by an "Order Trend" line (dashed green).
Break of Market Structure (BMS): A "BMS" (Break of Market Structure) label is visible, suggesting a significant shift in market dynamics, likely indicating the end of the previous uptrend or a strong pullback.
Consolidation/Distribution: After the initial uptrend, the price appears to have entered a period of consolidation or potential distribution between approximately $115,000 and $120,000.
Resistance Trends: Several "Resistance Trend" lines (red) are drawn, indicating areas where the price has faced selling pressure. A recent breakdown below these resistance lines is evident.
Change of Character (ChoCH): A "ChoCH" label is present, which often signifies a change in the prevailing market sentiment or trend, confirming the shift away from the strong bullish momentum.
Current Price & Trading Setup:
Current Price: The current price is around $115,849.44.
Proposed Entry: The chart suggests an "Entry" point at $116,150.00. This is positioned just above the current price and within a potential retest zone of the broken resistance.
Stop Loss (S/L): The "S/L" is set at $118,600.00, indicating a risk management level if the trade goes against the intended direction.
Profit Targets (Profit):
First Profit Target: $114,150.00, located just above the first "Golden Zone."
Second Profit Target: $108,350.00, situated within the second "Golden Zone."
Golden Zones: Two "Golden Zones" (brown shaded areas) are identified, which are typically areas of significant support/demand or Fibonacci retracement levels where price is expected to react. The current setup seems to target these zones for profit-taking.
SMS: 70.83%: This "SMS" value (likely referring to "Smart Money Score" or a similar metric) of 70.83% suggests a strong bearish bias or conviction in the current setup.
Interpretation & Potential Strategy:
The analysis suggests a bearish trading setup for BTC/USDT.
The presence of BMS, ChoCH, and the breakdown below resistance trends indicate a potential shift from bullish to bearish sentiment or a significant correction.
The proposed short entry at $116,150.00 aims to capitalize on further downward movement.
The profit targets align with identified "Golden Zones," suggesting that these are anticipated areas of support where the bearish momentum might temporarily stall or reverse.
The significant "SMS" value reinforces the bearish outlook.
Risks & Considerations:
Reversal from Golden Zones: While profit targets are set at Golden Zones, these are also potential areas for price reversals if strong buying interest emerges.
False Breakout/Breakdown: The market can always surprise, and a re-entry above the stop-loss level would invalidate the current bearish setup.
Market Volatility: Cryptocurrency markets are highly volatile, and rapid price movements can occur.
News Events: Unforeseen news or macroeconomic events could significantly impact price action.
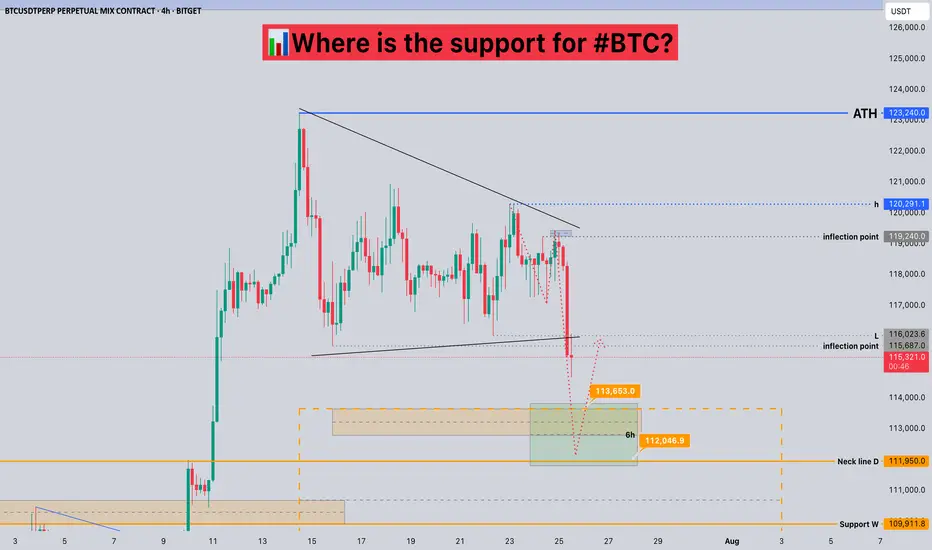
Where is the support for #BTC?📊Where is the support for #BTC?
🧠From a structural perspective, we did not stabilize after breaking through the inflection point of 119240, but broke down quickly. According to the current structure, the short-term support area is 112000-113700.
➡️From a morphological perspective, we failed to successfully break through the h point, but chose to break down, so we need to be vigilant about further pullbacks!
🤜If you like my analysis, please like 💖 and share 💬
BITGET:BTCUSDT.P
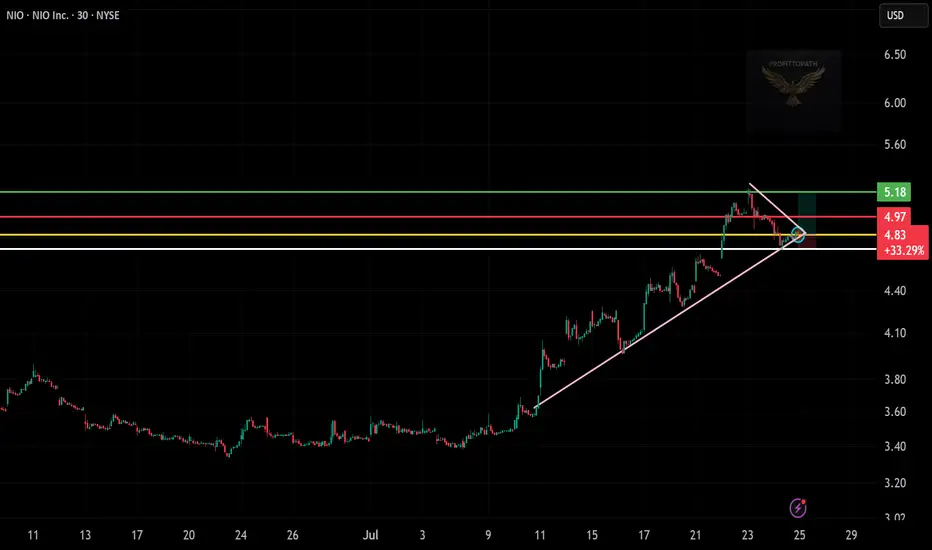
NIO Setup Looks Strong – Watch This Move!
Pattern: Bullish breakout from descending wedge
Entry Zone: Around $4.83–$4.97
Stop Loss: Just below $4.70 (trendline + horizontal support)
Target: $5.18 (green resistance level)
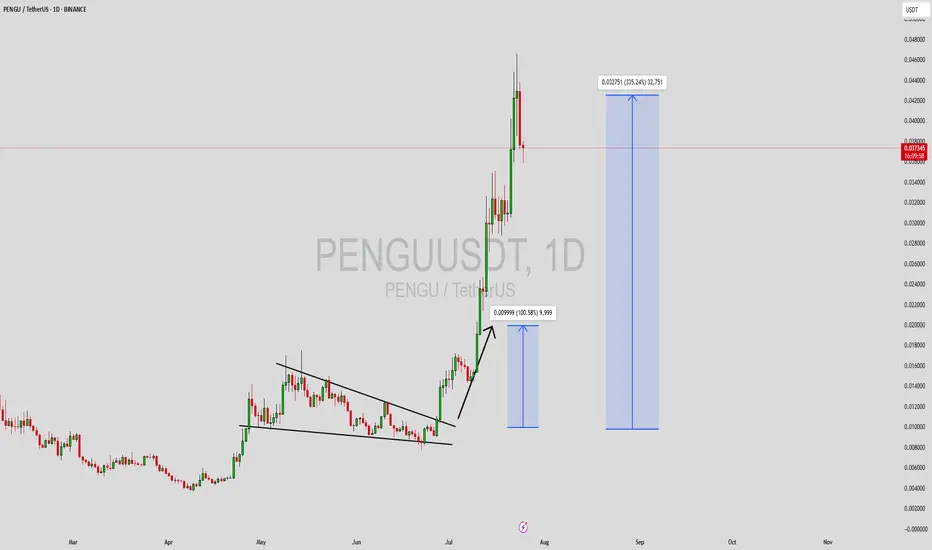
PENGUUSDT Forming Falling WedgePENGUUSDT has recently formed a classic falling wedge pattern on the chart—a well-known bullish reversal structure that often precedes explosive upward price movements. As the wedge narrows and consolidates, it typically signals a decline in selling pressure, preparing for a significant breakout. In PENGU's case, this technical setup, paired with increasing volume, points toward a potentially massive upside of 300% to 350% or more, making it one of the most closely watched low-cap altcoins right now.
This crypto project has been attracting fresh investor interest across various social platforms and trading forums, signaling growing awareness and community engagement. The technical pattern aligns with recent shifts in market sentiment, and volume confirmation during the breakout would provide further confidence to traders. Historically, such setups in meme and low-cap community tokens have led to sharp rallies once momentum builds up, particularly when backed by enthusiastic investor sentiment.
Market conditions currently favor altcoin breakouts, and PENGU appears to be positioning itself for a parabolic move. Traders looking for high-risk, high-reward plays may find this pair especially attractive, given the technical clarity and strong accumulation signals seen at current levels. The confluence of pattern breakout, solid volume, and social buzz could create a perfect storm for significant upside.
As always, risk management is key, but the setup offers a compelling technical opportunity worth watching closely in the coming days. A confirmed breakout above resistance could kickstart the rally and attract further retail and speculative flow.
✅ Show your support by hitting the like button and
✅ Leaving a comment below! (What is You opinion about this Coin)
Your feedback and engagement keep me inspired to share more insightful market analysis with you!
Bull Trap Confirmed: GBPUSD's 8% Rally Faces ExhaustionLets Face it we had a great 6 months already clocking 60%+ Returns already.
And after sitting ducks for almost 2 months now we finally have a trade.
- Its a very self explanatory chart
- Trading at resistance
- Head & Shoulder pattern
And the best part the right shoulder is still yet to be formed! My favourite type of entry.
1.It gives a better risk reward ratio (1:7 expected)
2.Better Entry (No long red candles)
3. And even if the pattern fails it we may still reach the neck line which is target 1.
Entry Criteria
- A Red candle at the entry Line Marked
- Stoploss Above the Entry Candle
Target 1- 1.3361
Target 2- 1.3252
Target 3- 1.3169
Keep Your Risk Reward Intact! Not An investment Advice

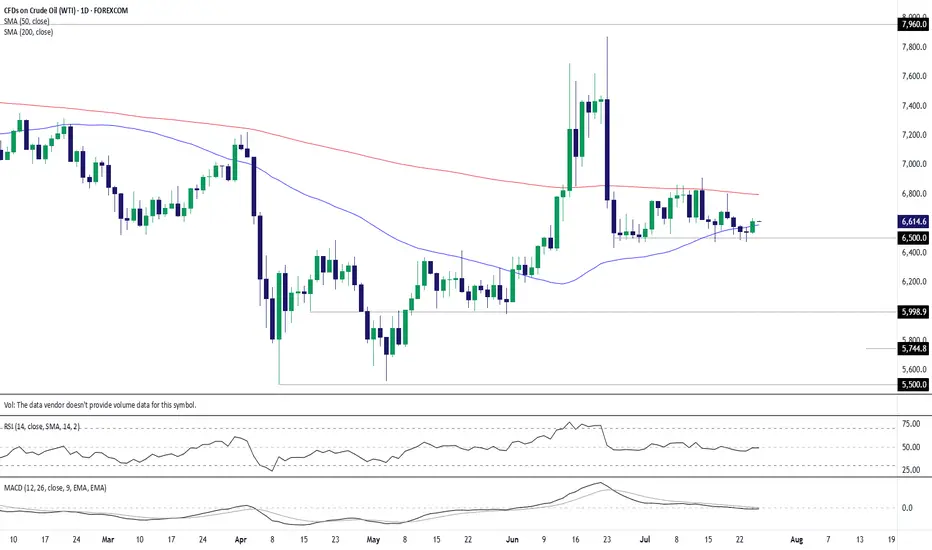
WTI crude: $65 floor holds again as bulls test 50-day MAAfter nine failures to break and close beneath $65 per barrel over the past month, you have to wonder how much longer bears will persist in attempting to take out the level. Following a nice pop higher on Thursday, completing a morning star pattern and closing above the 50-day moving average, it may be time for WTI bulls to have their day in the sun.
For those eyeing long setups, positions could be initiated above the 50-day moving average with a stop beneath for protection against reversal.
As for potential targets, the contract had little luck breaking cleanly above the 200-day moving average earlier this month, making it screen as a suitable level. It’s found just below $68 per barrel today.
Good luck!
DS
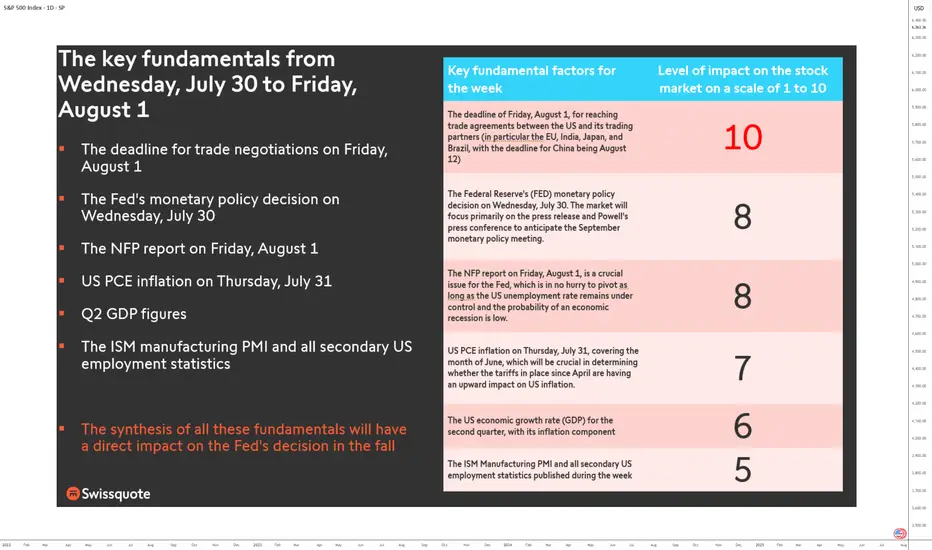
FUNDAMENTALS: THE WEEK OF TRUTH IS COMING!This is a high-stakes, high-pressure week for markets as the final days of July approach. Between Wednesday, July 30, and Friday, August 1, all the market-moving fundamentals are concentrated in a three-day window. It’s a stress test for the U.S. equity market: either it extends its bullish trend, or it enters a much-needed consolidation phase.
Three days. No more. Catalysts are so tightly packed they could shake even the steadiest traders. We’re looking at a full-spectrum stress test—monetary, economic, and geopolitical. Why so crucial? Because every major macro driver is converging in an ultra-condensed timeframe: the trade deal deadline with U.S. partners, the Fed’s policy decision, GAFAM earnings, PCE inflation, the NFP jobs report, Q2 GDP figures, and key technical barometers—all as we enter the seasonally weaker August-September period.
1) Wednesday, July 30 – The Monetary Moment of Truth
The week opens with a critical event: the Fed’s monetary policy meeting. It’s not just about rates, but forward guidance. The market stands at a crossroads. Either the Fed signals a dovish pivot for late 2025, and risk appetite returns—or it delays action, and the S&P 500, already stretched (Shiller PE Ratio back to end-2021 levels), enters a correction.
At the same time, GAFAM kick off their earnings season. U.S. tech remains the market’s beating heart. If these giants disappoint, the sector will drag down the entire market. Remember, tech accounts for 35% of the S&P 500’s weight.
2) Thursday, July 31 – PCE Inflation Decides the Direction
Next up is the Fed’s preferred inflation metric: core PCE. A critical indicator. If inflation ticks up, the autumn rate-cut narrative falls apart. Add in the second estimate of Q2 GDP and earnings from the next GAFAM batch, and Thursday becomes a pivotal day for the S&P 500. The key question: will core PCE inflation rebound, possibly influenced by tariff impacts?
3) Friday, August 1 – The Verdict: NFP and Trade Talks
NFP jobs report + trade negotiation deadline = explosive combo. By Friday, markets will have priced in the Fed, inflation, and earnings. What’s left? U.S. labor. Weak numbers could revive recession fears. Strong ones might push back the Fed’s easing timeline.
Also on the radar: trade talks. The August 1 deadline could spike volatility. And let’s not forget the China-specific deadline on Tuesday, August 12.
Conclusion: No Room for “TACO”
There’s no margin for error. No room for “TACO” (Trump Always Chickens Out). This market must deliver across the board—or the current overvaluation will be left with no safety net. The July 30 week is a true fundamental stress test. And the consequences will be swift.
DISCLAIMER:
This content is intended for individuals who are familiar with financial markets and instruments and is for information purposes only. The presented idea (including market commentary, market data and observations) is not a work product of any research department of Swissquote or its affiliates. This material is intended to highlight market action and does not constitute investment, legal or tax advice. If you are a retail investor or lack experience in trading complex financial products, it is advisable to seek professional advice from licensed advisor before making any financial decisions.
This content is not intended to manipulate the market or encourage any specific financial behavior.
Swissquote makes no representation or warranty as to the quality, completeness, accuracy, comprehensiveness or non-infringement of such content. The views expressed are those of the consultant and are provided for educational purposes only. Any information provided relating to a product or market should not be construed as recommending an investment strategy or transaction. Past performance is not a guarantee of future results.
Swissquote and its employees and representatives shall in no event be held liable for any damages or losses arising directly or indirectly from decisions made on the basis of this content.
The use of any third-party brands or trademarks is for information only and does not imply endorsement by Swissquote, or that the trademark owner has authorised Swissquote to promote its products or services.
Swissquote is the marketing brand for the activities of Swissquote Bank Ltd (Switzerland) regulated by FINMA, Swissquote Capital Markets Limited regulated by CySEC (Cyprus), Swissquote Bank Europe SA (Luxembourg) regulated by the CSSF, Swissquote Ltd (UK) regulated by the FCA, Swissquote Financial Services (Malta) Ltd regulated by the Malta Financial Services Authority, Swissquote MEA Ltd. (UAE) regulated by the Dubai Financial Services Authority, Swissquote Pte Ltd (Singapore) regulated by the Monetary Authority of Singapore, Swissquote Asia Limited (Hong Kong) licensed by the Hong Kong Securities and Futures Commission (SFC) and Swissquote South Africa (Pty) Ltd supervised by the FSCA.
Products and services of Swissquote are only intended for those permitted to receive them under local law.
All investments carry a degree of risk. The risk of loss in trading or holding financial instruments can be substantial. The value of financial instruments, including but not limited to stocks, bonds, cryptocurrencies, and other assets, can fluctuate both upwards and downwards. There is a significant risk of financial loss when buying, selling, holding, staking, or investing in these instruments. SQBE makes no recommendations regarding any specific investment, transaction, or the use of any particular investment strategy.
CFDs are complex instruments and come with a high risk of losing money rapidly due to leverage. The vast majority of retail client accounts suffer capital losses when trading in CFDs. You should consider whether you understand how CFDs work and whether you can afford to take the high risk of losing your money.
Digital Assets are unregulated in most countries and consumer protection rules may not apply. As highly volatile speculative investments, Digital Assets are not suitable for investors without a high-risk tolerance. Make sure you understand each Digital Asset before you trade.
Cryptocurrencies are not considered legal tender in some jurisdictions and are subject to regulatory uncertainties.
The use of Internet-based systems can involve high risks, including, but not limited to, fraud, cyber-attacks, network and communication failures, as well as identity theft and phishing attacks related to crypto-assets.
MARA: shoulders done, now walk toward the targetOn the daily chart, MARA completed a textbook inverse Head & Shoulders reversal with a clear breakout above the descending trendline. A corrective pullback followed, and the price is now heading into the key buy zone at 15.21–15.77 - aligning with the 0.72 and 0.79 Fibonacci retracements, and the upper boundary of the broken channel. This is the area to watch for a potential continuation of the bullish impulse.
Volume on the breakout was above average, confirming strong buyer interest. The EMAs are trending below the price, supporting the upward structure. The first target is located at 21.57 (previous resistance), with a potential extension to 28.77 (Fibonacci 1.618).
Fundamentally, MARA remains highly correlated with BTC and crypto sentiment. As interest returns to crypto-related assets due to ETF flows and possible Fed easing, mining stocks like MARA gain attention. Recent reports also show improved production efficiency and lowered costs - a tailwind for bulls.
Tactically, the best setup would be a confirmed reaction from the buy zone — whether a strong candlestick formation, volume surge, or reclaim of a key level. If that happens, aiming for 21.57 and 28.77 becomes a solid plan.
The pattern played out - now it's time for the market to walk the talk.

Bitcoin’s Epic Run from 80K to 120K: What’s Next for BTC?Yo traders, it’s Skeptic from Skeptic Lab! 🩵 Diving into Bitcoin’s wild ride from 80K to 120K—breaking down the key supports, resistances, and what’s next for BTC.
From the $76k bounce to smashing $110K, we’re eyeing the $120K PRZ. Will it correct or keep soaring? Check the video for the full scoop! Drop your thoughts or coin requests in the comments, boost if it vibes & Let’s grow together!

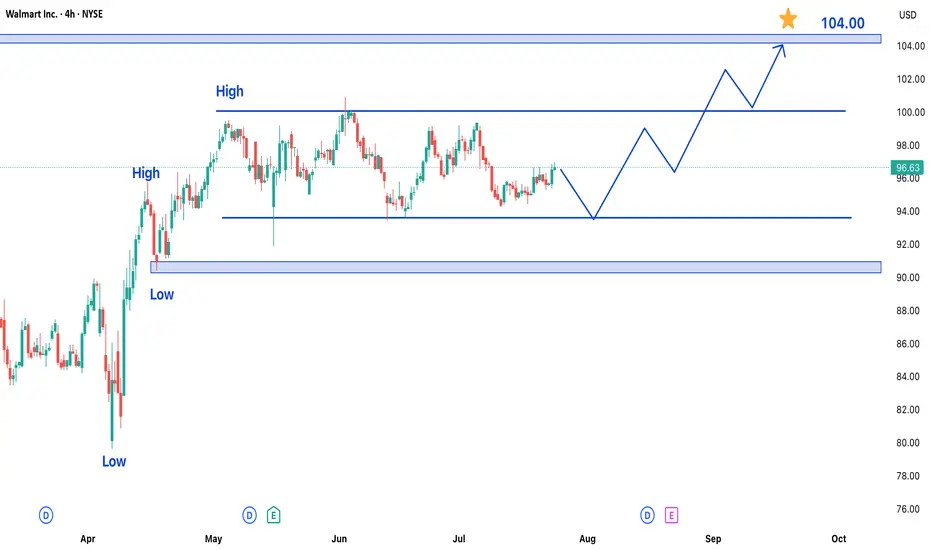
Walmart Stock Trading in Bullish Trend – Upside Potential AheadWalmart Inc. (WMT) shares are currently exhibiting a bullish trend, maintaining upward momentum over recent trading sessions. While the stock has been consolidating in a range over the past few days, the broader outlook remains positive, suggesting potential for further gains in upcoming sessions.
Key Observations:
- Established Uptrend: Walmart's price action reflects sustained buying interest, keeping the stock in a bullish phase.
- Range-Bound Consolidation: Recent sideways movement indicates a temporary pause, often a precursor to the next directional move.
- Strong Support & Resistance Levels: The stock has formed clear reference points for traders to watch.
Price Projections:
- Upside Target at $105: A breakout above the current range could propel WMT toward the $105 resistance level, representing a significant upside opportunity.
- Key Support at $90: On the downside, the $90 level has emerged as a strong support zone. Any pullback is likely to find buying interest near this area.
Market Implications:
1. Bullish Continuation Likely: The consolidation within an uptrend typically resolves in the direction of the prevailing trend—in this case, upward.
2. Breakout Potential: A decisive move above the recent range high could accelerate buying momentum toward $105.
3. Risk Management Consideration: While the bias is bullish, a drop below $90 would signal weakening momentum and potentially invalidate the near-term upside scenario.
Trading Strategy:
- Entry: Consider long positions on a confirmed breakout above the range, or on dips near $90 support.
- Stop Loss: A close below $90 would suggest a trend reversal, warranting exit from bullish positions.
- Target: $105 serves as the primary upside objective, with interim resistance levels to monitor along the way.
Final Thoughts:
Walmart’s stock appears poised for further gains, with $105 as the next key target. Traders should watch for a breakout from the current range while keeping an eye on the $90 support level for risk management. As always, confirmation through price action and volume will be crucial for validating the bullish thesis.
SANDUSDT Breaks Major Downtrend – Golden Pocket Retest!
Technical Analysis:
SAND/USDT has successfully broken out of a descending trendline that had been capping the price since late 2024. The breakout occurred with increased volume, signaling strong buyer interest.
Following the breakout, price rallied and is now retesting a key support zone, which includes:
A demand zone (yellow box) between 0.2748 - 0.2885, aligning with the Fibonacci Golden Pocket (0.618 - 0.5)
A solid horizontal support around 0.2913
Fibonacci retracement levels are clearly defined:
0.3126
0.3467
0.4010
0.5417
Up to major resistance near 0.9384
---
Bullish Scenario 🟢:
If the price holds above the Golden Pocket zone and prints bullish confirmation (such as a bullish engulfing or hammer candlestick), then further upside potential is likely:
1. Initial targets: 0.3126 and 0.3467
2. Mid-range targets: 0.4010 and 0.5417
3. Long-term potential: 0.6981 and possibly the major resistance at 0.9384
Stronger confirmation would come from a daily candle closing above 0.3126.
---
Bearish Scenario 🔴:
If price breaks below the 0.2748 zone, it could indicate a failed breakout, potentially leading to:
1. Initial support: 0.2700
2. Deeper pullback zone: 0.2131 (previous low)
3. Potential fakeout of the trendline breakout
A daily close below 0.2748 would strongly validate the bearish setup.
---
Chart Pattern Overview:
Descending Triangle Breakout already confirmed
Price is now in the retest phase of the breakout
The Golden Pocket Fibonacci zone is the crucial point of trend continuation or reversal
---
Conclusion:
The breakout from the long-standing downtrend marks a strong shift in structure. However, a successful retest at the Golden Pocket will be key to confirming further bullish continuation. If buyers defend this zone, SAND is likely to print a higher low and resume its upward move.
#SANDUSDT #CryptoBreakout #AltcoinAnalysis #TechnicalAnalysis #FibonacciLevels #TrendlineBreakout #GoldenPocket #BullishSetup #BearishSetup

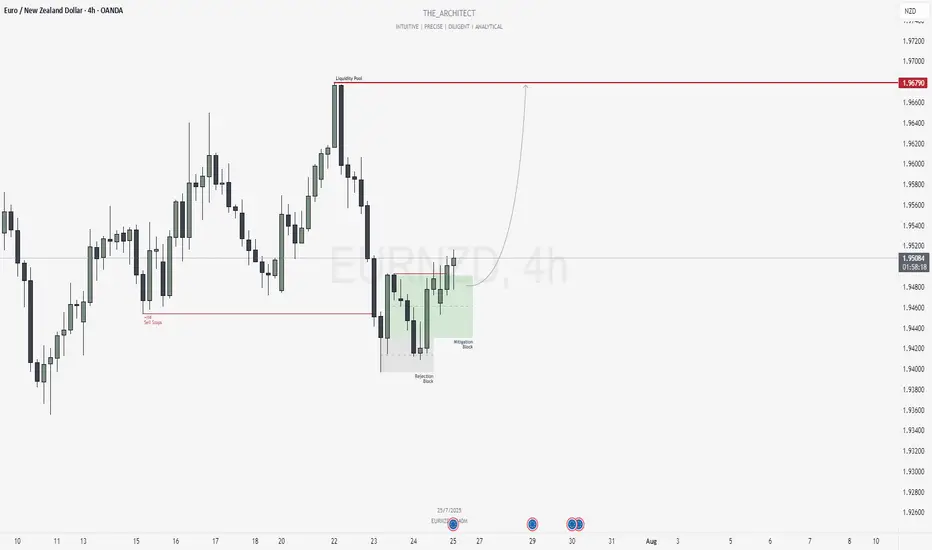
EURNZD: Bullish Shift and Institutional Re-Entry from SupportGreetings Traders,
In today’s analysis of EURNZD, we observe that institutional order flow on the H4 timeframe has recently shifted bullish. This alignment now provides us with a clear bias to seek buying opportunities in line with the predominant higher timeframe trend.
Higher Timeframe Context:
The weekly timeframe is currently delivering bullish order flow. With the recent bullish market structure shift (MSS) on the H4, we now have confluence across both timeframes, which strengthens our confidence in seeking long setups on lower timeframes.
Key Observations on H4:
Sell Stop Raid & Structural Rejection: Price action recently swept sell-side liquidity, a typical behavior indicating institutional order pairing. Following this, price attempted to move lower but failed to break the previous low, instead being supported by a Rejection Block. This led to a bullish market structure shift—our key signal of trend continuation.
Mitigation Block Entry Zone: Price has since retraced into a Mitigation Block—an area where previous institutional selling occurred. The purpose of this pullback is to mitigate earlier positions and initiate fresh buying orders. This now becomes our zone of interest for potential confirmation entries towards the upside.
Trading Plan:
Entry Strategy: Look for lower timeframe confirmation entries within the H4 Mitigation Block.
Target: The objective is to target the H4 liquidity pool residing at premium prices, aligning with the discount-to-premium delivery model.
For a detailed market walkthrough and in-depth execution zones, be sure to watch this week’s Forex Market Breakdown:https://www.tradingview.com/chart/EURNZD/BZC9xW1L-July-21-Forex-Outlook-Don-t-Miss-These-High-Reward-Setups/
As always, remain patient and disciplined. Wait for confirmation before executing, and manage your risk accordingly.
Kind Regards,
The Architect 🏛️📈
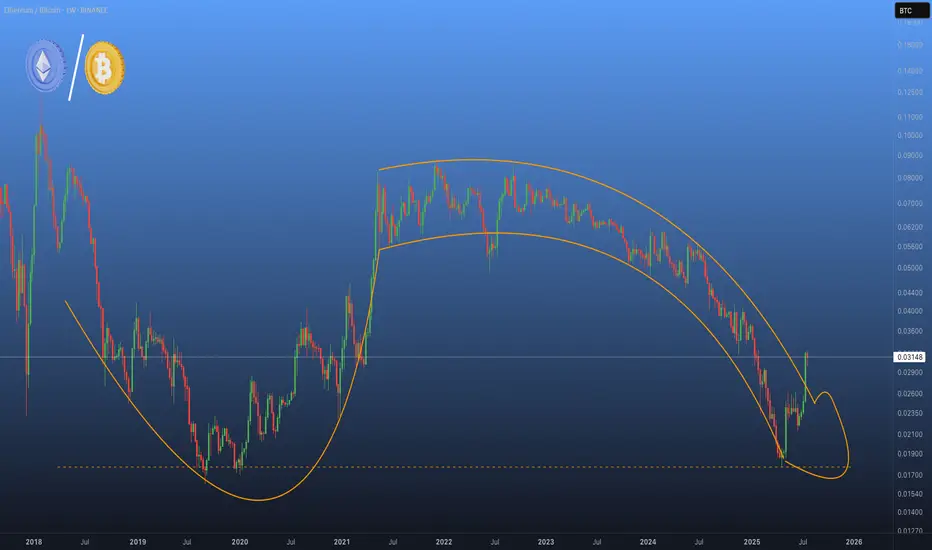
Ethereum is breaking out !The ETH/BTC chart looks like #Ethereum has been suffering from impotence for years… 🍆
But judging by the shape, this breakout isn’t just a Bullish signal — it’s the early sign of a massive altcoin erection. 🚀
⚠️ Side effects may include: rapid growth and uncontrollable pumps.
Keep children and weak hands away from the charts !
BTC USDT ANALYSIS CRYPTOCAP:BTC is currently correcting after a long bull ride and knowing your entry level as a trader is very important. Look at this chart and make informed decision

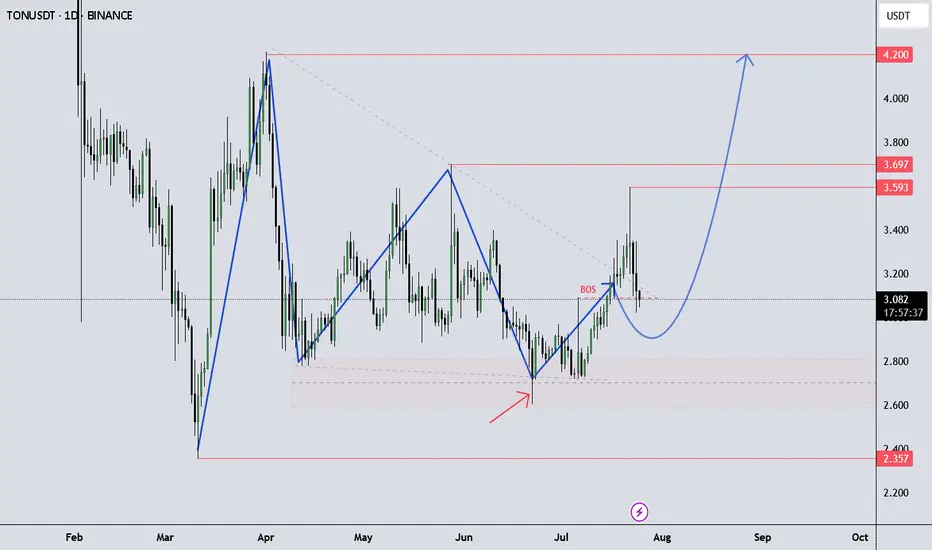
TONUSDT continue up!Looking for an Impulse Up – TONUSDT Outlook
TONUSDT is showing momentum to the upside as it continues its current structure, possibly developing another impulsive leg.
It’s important to follow your own trading plan and maintain proper risk-reward (RR) discipline.
This idea is shared for educational purposes only to support your learning.
Got questions? Feel free to drop them in the comments!
BTC New Upodate (4H)This analysis is an update of the analysis you see in the "Related publications" section
We previously stated that Bitcoin lacks the strength to move upward, and we expect the price to soon reach the green zone (114K-112K).
The price is now dropping toward this zone, which is the rebuy area.
The process of reaching the green zone has been and still is somewhat time-consuming, and during this time, it may repeatedly mislead beginners.
For risk management, please don't forget stop loss and capital management
Comment if you have any questions
Thank You

ETH analysis (1H)A trendline has been broken, and a resistance zone has formed on the chart. As long as Ethereum fails to hold above the red zone, the price may experience a drop.
The green box can be considered the target.
If the price stabilizes above the red zone and a daily candle closes above the invalidation level, this analysis will be invalidated.
For risk management, please don't forget stop loss and capital management
Comment if you have any questions
Thank You

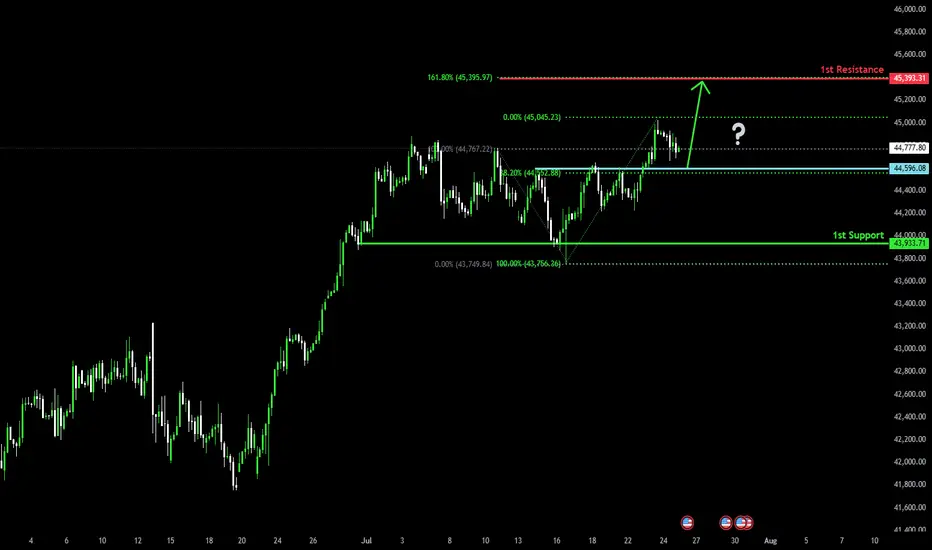
Bullish bounce off pullback support?Dow Jones (US30) is falling towards the pivot and could bounce to the 161.8% Fibonacci resistance.
Pivot: 44,596.08
1st Support: 43,933.71
1st Resistance: 45,393.31
Risk Warning:
Trading Forex and CFDs carries a high level of risk to your capital and you should only trade with money you can afford to lose. Trading Forex and CFDs may not be suitable for all investors, so please ensure that you fully understand the risks involved and seek independent advice if necessary.
Disclaimer:
The above opinions given constitute general market commentary, and do not constitute the opinion or advice of IC Markets or any form of personal or investment advice.
Any opinions, news, research, analyses, prices, other information, or links to third-party sites contained on this website are provided on an "as-is" basis, are intended only to be informative, is not an advice nor a recommendation, nor research, or a record of our trading prices, or an offer of, or solicitation for a transaction in any financial instrument and thus should not be treated as such. The information provided does not involve any specific investment objectives, financial situation and needs of any specific person who may receive it. Please be aware, that past performance is not a reliable indicator of future performance and/or results. Past Performance or Forward-looking scenarios based upon the reasonable beliefs of the third-party provider are not a guarantee of future performance. Actual results may differ materially from those anticipated in forward-looking or past performance statements. IC Markets makes no representation or warranty and assumes no liability as to the accuracy or completeness of the information provided, nor any loss arising from any investment based on a recommendation, forecast or any information supplied by any third-party.
BITCOIN IS CREATING A SECRET PATTERN! (Huge move incoming?!)Yello paradisers! I'm describing to you what's going on with Bitcoin right now. We are creating a secret pattern that is forming, and once its neckline is reclaimed, we are going to have a huge movement.
In this video, I'm sharing with you the most important support and resistances on multiple time frames. We are describing Elliott wave theory wave count, and taking a look at candlestick patterns. We are talking about confirmations necessary for bullish and bearish cases. I'm explaining to you what the professional trading signals need for long-term profitability.
Some of the points are great risk-reward ratios. I'm talking about that in the video. One of them is taking only the highest probability trade setups, and having the patience and discipline to wait for them.
I'm talking about proper strategy which is needed, and systemology in your overall trading and how important it is. Here on TradingView, I'm describing to you the overall bias I have on Bitcoin right now.
Don't be a gambler. Don't try to get rich quick. Make sure that your trading is professionally based on proper strategies and trade tactics.

ETH-----Sell around 3690, target 3615 areaTechnical analysis of ETH contract on July 25:
Today, the large-cycle daily level closed with a small positive line yesterday, the K-line pattern was single negative and single positive, the price was at a high level, and the attached indicator was golden cross and running with shrinking volume. From the big trend, the current trend is in a weak trend, the price rebound is not strong and has not continued, the trend is prone to fall under pressure and test the low point downward, so the trend has changed; the short-cycle hourly chart yesterday hit a high in the US market and fell under pressure in the Asian morning. The current K-line pattern is continuous negative, the price is at a low level, and the attached indicator is dead cross running. It is highly likely that the decline will continue during the day. Yesterday's low point of 3500 is the position that needs to be paid attention to today. The current hourly chart resistance is near the 3695 area.
Today's ETH short-term contract trading strategy:
Sell in the 3690 area after the rebound, stop loss in the 3720 area, and target the 3615 area;

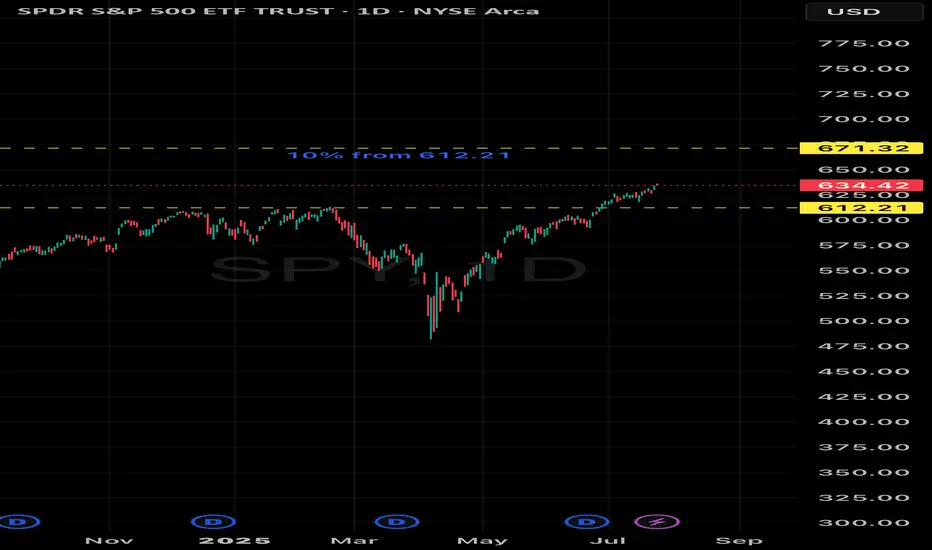
Spy ATH prediction by end of 2025 10% from 613 triple top ATH major major level. I think SPY see 672 before 2025 is over 🔮