HUBTOWNHUBTOWN giving trendline breakout with decent volumes. Support can be seen near 301-2 level. On upper side resistance may be nr 342-365. Stock has given around 80% return in last 1.5 months. So strong momentum is observed. Keep it on radar
Trend Analysis

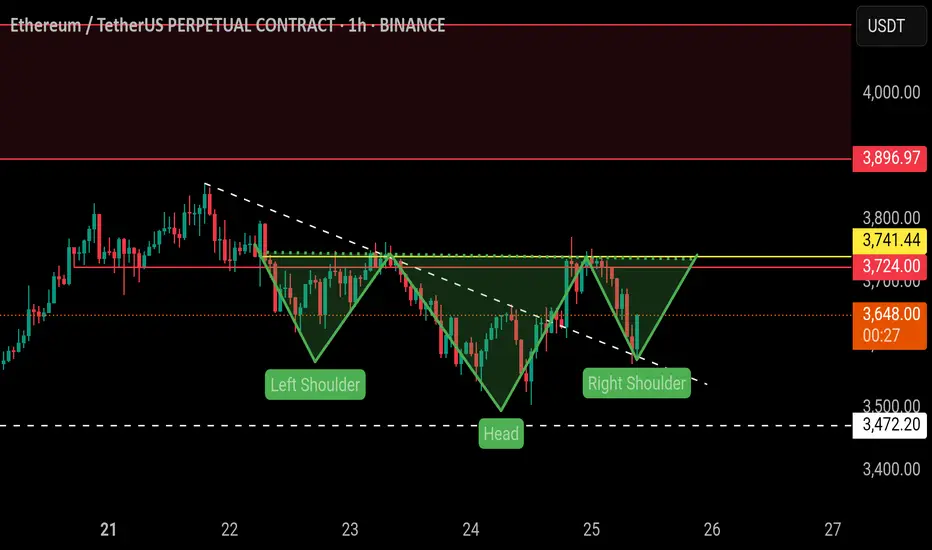
$ETH | Ready to fly (Inverted head and shoulders)BINANCE:ETHUSDT.P
On 1H TF, the price is forming inverted head and shoulders pattern, which is a strong bullish pattern.
The price has retested the trendline support and bounced back.
Expecting it to breakout above yellow line soon.
A breakout above the yellow line will be a bullish and pattern confirmation.
We can initiate a long entry from here.
Please do proper risk management and must use stop loss.
NFA, DYOR
BTC / USDT : Broke down and now going for retestBitcoin Analysis:
Bitcoin has broken down and is now retesting the support zone. As mentioned earlier, a shakeout can happen at any time, and this looks like the potential retest phase.
Bullish Scenario:
Reclaims Resistance: If BTC manages to break through the resistance after the retest, it will stabilize for the short term. This could lead to a move towards higher levels.
Bearish Scenario:
Failure to Break Resistance: If the retest fails and BTC can't reclaim the resistance, further downside could be expected.
Targets: Keep an eye on the CME gap at $114,000 and 92K as key levels to watch for potential price action.
Note:
Manage your risk carefully. The market is volatile, and a shakeout could happen anytime. If BTC fails to break resistance after retest, more pain may be ahead.

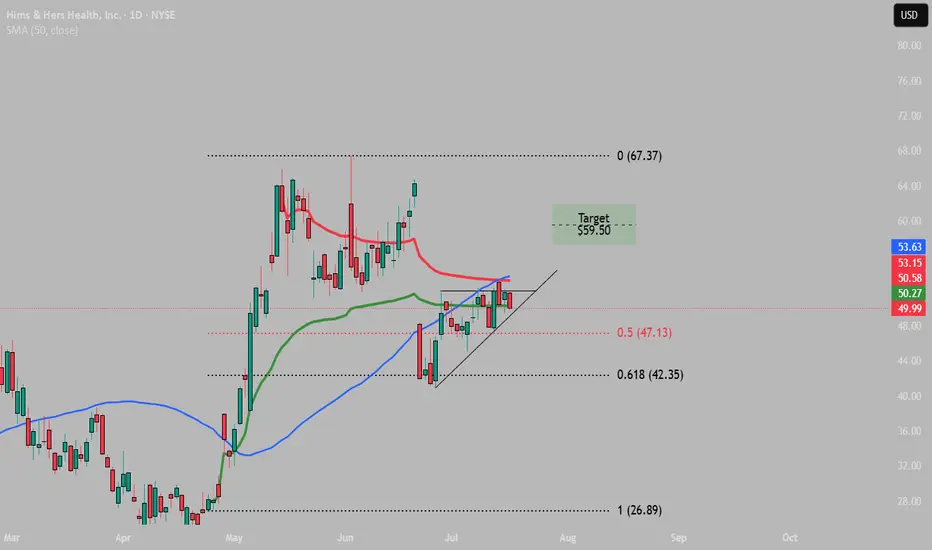
$HIMS Squeeze Time Frame: 1D
RSI : Neutral
MACD: Bullish Cross
Fib Levels: Retraced back to 61.8%
Target:
$59.50
Pattern invalidated of drop below 61.8% ($42.35) Fib level.
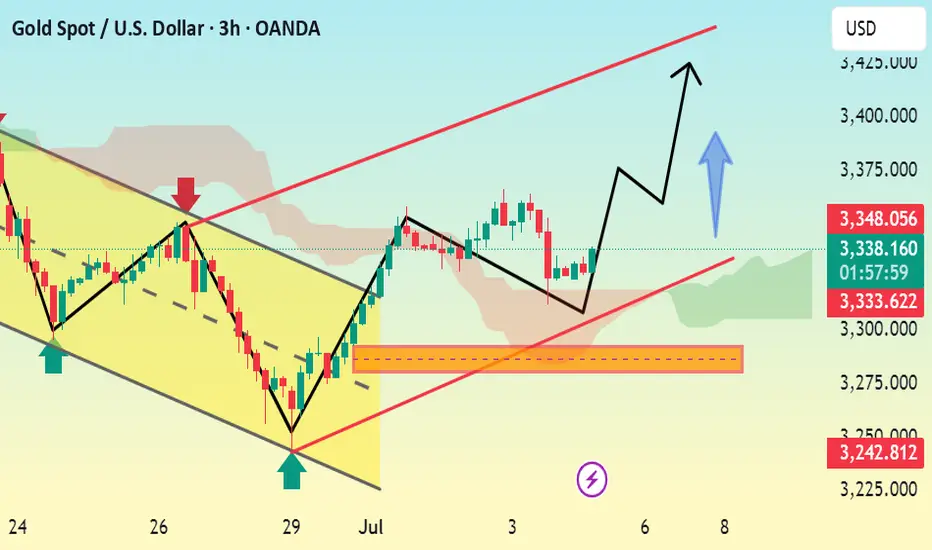
Gold - The clear top formation!🪙Gold ( TVC:GOLD ) just created a top formation:
🔎Analysis summary:
Over the past four months, Gold has overall been moving sideways. Following a previous blow-off rally of about +25%, this cycle is very similar to the 2008 bullish cycle. Bulls are starting to slow down which will most likely result in the creation of at least a short term top formation.
📝Levels to watch:
$3.000
🙏🏻#LONGTERMVISION
Philip - Swing Trader

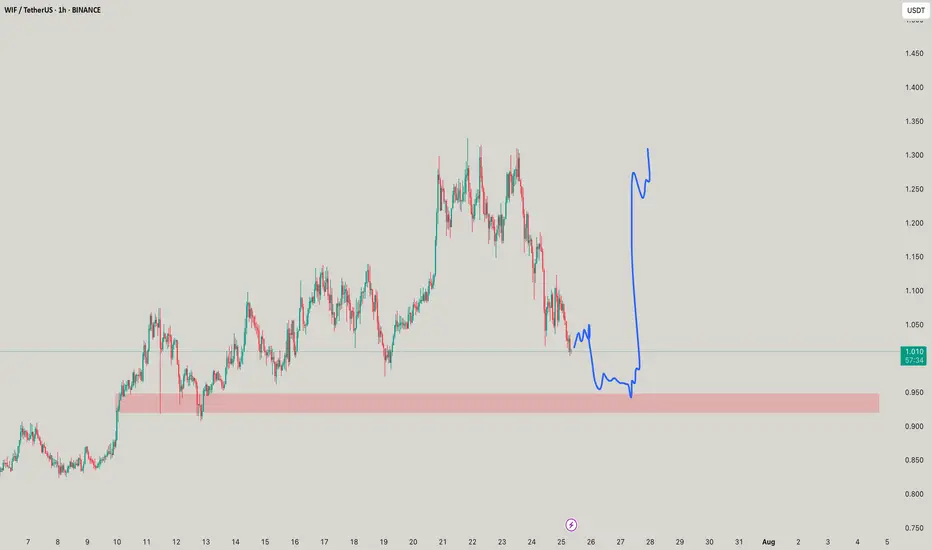
WIFFF your destiny!The patience is a game most fail, here you can get something which u cant expect!
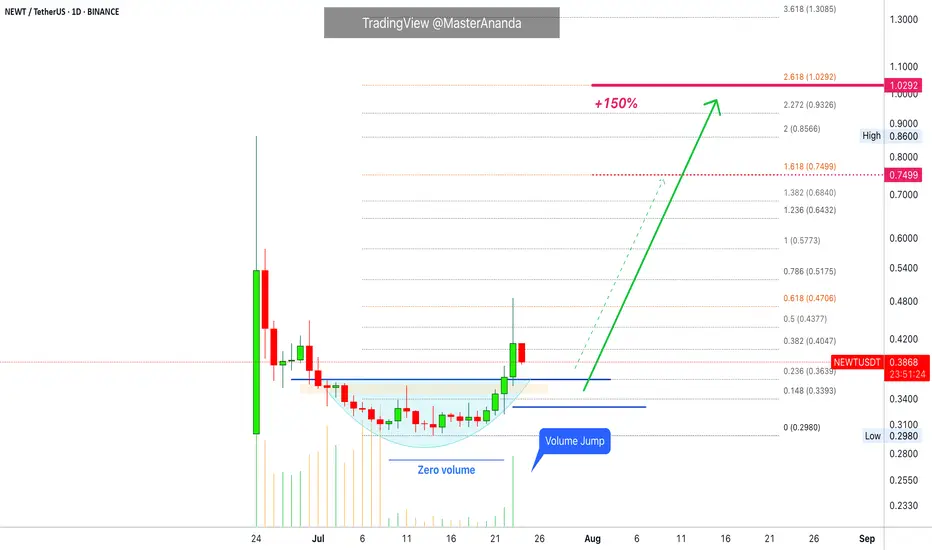
Newton Protocol · Volume Signal · 150% PP Short-TermI will show you now a successful choice on a volume signal as we look at Newton Protocol (NEWTUSDT) on the daily timeframe.
Notice how trading volume is flat while NEWTUSDT is producing a rounded bottom with the daily candles. It reads "zero volume" on the chart.
Now notice the strong "volume jump" today, 23-July, as soon as the action moves outside the rounded bottom, also a Fib. extension resistance. The strong jump confirms the start of a bullish advance. Our short-term target gives us 150% profits potential.
I will end this series soon and go back to our usual schedule.
These charts show the altcoins market being full of opportunities at this point in time. There is something for all types of market participants, active or passive traders. Risk lovers or risk averse. We are only getting started.
Your support is appreciated and all feedback is welcome.
Do you enjoy short-term trades?
Did you know, you can hold these pairs long-term once the bullish trend develops. Selling for profits is only optional, the market is set to grow until late 2025 or maybe into Q1 2026 or beyond.
The things that are happening worldwide in relation to Crypto are a first in the history of humanity. It is the first time that money is free from a tiny controlling monopoly. It is the first time in our history that you can create your own money. Decentralized finance. No middle men. The greatest financial and technological development in our history.
Namaste.
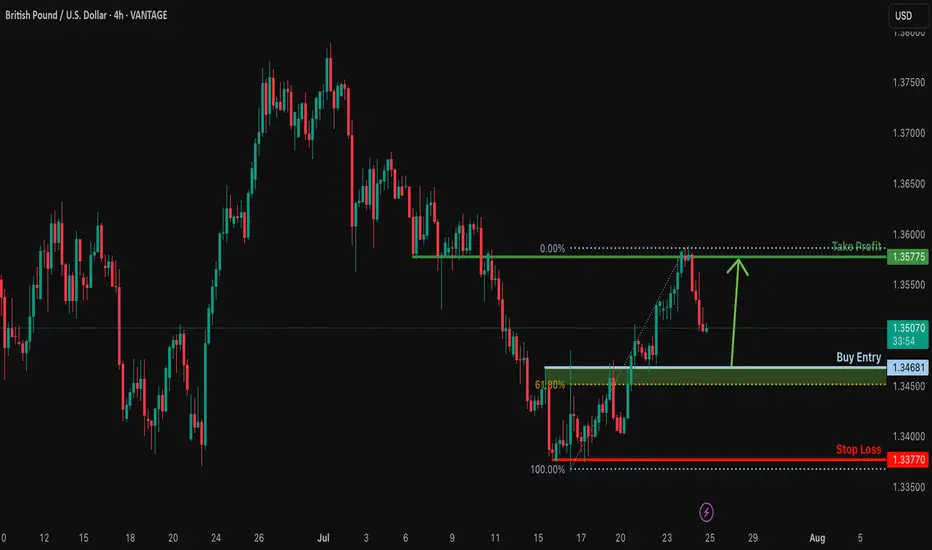
Bullish bounce for the Cable?The price is falling towards the suoprt level which is an overlap support that is slightly above the 61.8% Fibonacci retracement and could bounce from this level to our take profit.
Entry: 1.3468
Why we like it:
There is an overlap support that is slightly above the 61.8% Fibonacci retracement.
Stop loss: 1.3377
Why we like it:
There is a swing low support.
Take profit: 1.3577
Why we like it:
There is a pullback resistance.
Enjoying your TradingView experience? Review us!
Please be advised that the information presented on TradingView is provided to Vantage (‘Vantage Global Limited’, ‘we’) by a third-party provider (‘Everest Fortune Group’). Please be reminded that you are solely responsible for the trading decisions on your account. There is a very high degree of risk involved in trading. Any information and/or content is intended entirely for research, educational and informational purposes only and does not constitute investment or consultation advice or investment strategy. The information is not tailored to the investment needs of any specific person and therefore does not involve a consideration of any of the investment objectives, financial situation or needs of any viewer that may receive it. Kindly also note that past performance is not a reliable indicator of future results. Actual results may differ materially from those anticipated in forward-looking or past performance statements. We assume no liability as to the accuracy or completeness of any of the information and/or content provided herein and the Company cannot be held responsible for any omission, mistake nor for any loss or damage including without limitation to any loss of profit which may arise from reliance on any information supplied by Everest Fortune Group.
NASDAQ100 continue its strength due to the strong earning seasonFundamental:
USTEC (NASDAQ100) continues its strength, propelled by robust Alphabet (GOOG) earnings that buoyed technology companies. Cloud services recorded the largest growth at 32% YoY, primarily driven by AI. Concurrently, the company plans to allocate $85 bln to capital expenditure in 2025 for AI, an increase from $75 bln, signaling continued surging demand for AI infrastructure.
In addition, recent US economic data indicated strong consumption and optimism, with the July Services PMI expanding to 55.2 from 52.9 in the previous month. Initial Jobless Claims also fell to 217k, the lowest in 14 weeks, reinforcing optimism regarding the labor market, alongside stronger-than-expected Nonfarm Payrolls from early July.
Inflation data showed a minor impact from tariffs, and tariff negotiations have progressed favorably. Trade deals have been secured with Vietnam, Indonesia, Japan, and the Philippines, and potential trade agreements with the Eurozone and India are anticipated before the deadline.
Major earnings releases are slated for next week, including MSFT, META, and QCOM on July 30. AMZN and APPL's results the following day could provide a clearer picture of USTEC's overall earnings.
Meanwhile, USTEC's forward P/E currently stands at 27x, aligning with its 5-year average despite reaching a new record high, suggesting further upside potential.
Technical:
The index is trading above its EMAs, which are extending, signaling a continuation of the rally.
If USTEC sustains its momentum, the index may reach 24000 upon breaking above the potential resistance at 23400.
Conversely, a pullback near the swing high may suggest a retest of the support at 23000.

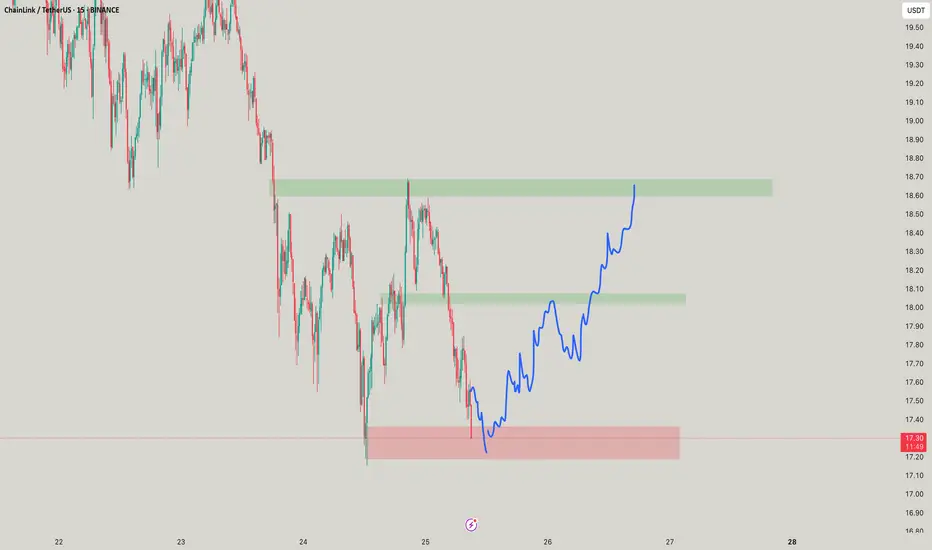
LINK your Idea! Its time!Buying at the right time is the best thing you can do and selling at the right time too! aint it?
BTC SHORT IDEA114500 is TP1
113 is TP2
BTC is in Price Discovery Mode...
New ATH was created recently.
500M Shorts were Liquidated at 122k Region.
All the dips are healthy.

[INTRADAY] #BANKNIFTY PE & CE Levels(25/07/2025)Bank Nifty is likely to start the session with a slight gap-down, hovering just below the 57,050–57,100 resistance zone. This zone has been acting as a critical barrier over the past sessions, and until it's breached, upside momentum may remain capped.
A strong bullish move can be anticipated above 57,050, where call option buying is favored. If Bank Nifty sustains this breakout, we can expect a continuation rally toward 57,250, 57,350, and 57,450+ levels. This would mark a short-term trend reversal and signal fresh bullish interest.
On the downside, weakness may resume if the index breaks below the 56,950 mark. A sustained move below this could trigger a quick correction targeting 56,750, 56,650, and 56,550- levels, offering good opportunities for put option buyers.

EURUSD - Short Term Setup Could Trigger MAJOR ReversalThis bounce is likely to be a connective wave into another wave down.
In the video I break down a classic algo driven liquidity sweep just above the 0.786 retracement.
This signals potential reversal.
Stop loss placement depends on how aggressive you want to be with margin.
Tighter risk gives more upside potential with defined exposure.
Invalidation of potential retracement failure swing @ $1.18.
If this unfolds on a higher timeframe, it could develop into a heavy-hitting move.
I'm layering shorts through this area, as discussed in the video.
Trade executed on Pepperstone CFD 👍.
This analysis is shared for educational purposes only and does not constitute financial advice. Please conduct your own research before making any trading decisions.

XAUUSD CHART PATTERN 2\HTrade Setup (Buy Position):
Entry Point: 3330
Target 1: 3380
Target 2: 3420
Stop Loss: 3290
Strategy Insight
You’re targeting a +50 pip move to Target 1 and +90 pip move to Target 2.
Risk is -40 pips from the entry (3330 → 3290).
Risk-Reward Ratio:
To Target 1: 1.25 : 1
To Target 2: 2.25 : 1
This is a moderately aggressive setup with a good reward potential.
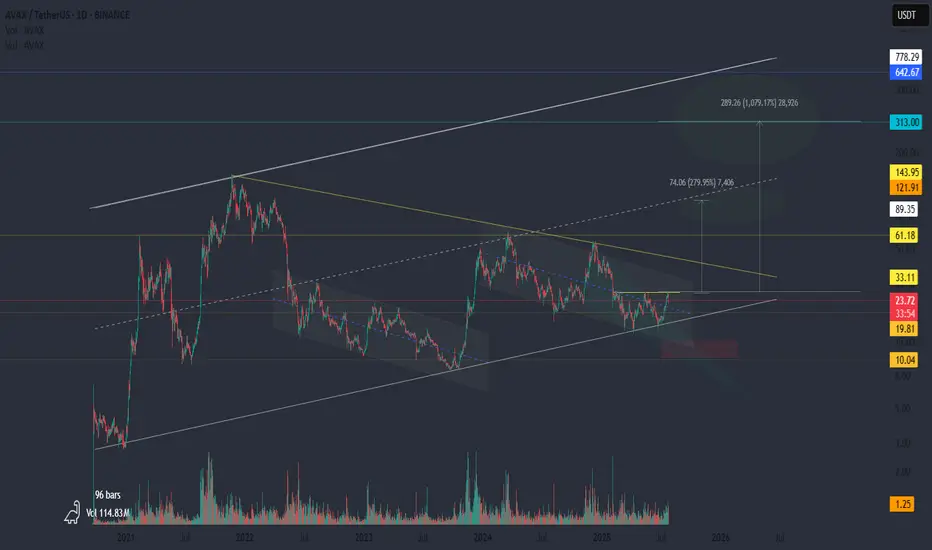
AVAX: A Quiet Rocket?This might be the calm before the cycle.
📍 All the liquidity is above.
Levels like 33 and 61 aren’t just resistance — they’re fuel. Clusters of short liquidations and forgotten limit orders are sitting right there. If we get a breakout, it could be sharp. And if there’s another pullback? Don’t panic. That would be the test — the shakeout before the move.
🚀 If the cycle kicks in, AVAX could be one of the silent leaders.
While the crowd is focused elsewhere, AVAX has been building quietly: structure, accumulation, time. The kind of setup that doesn’t scream hype, but whispers opportunity.
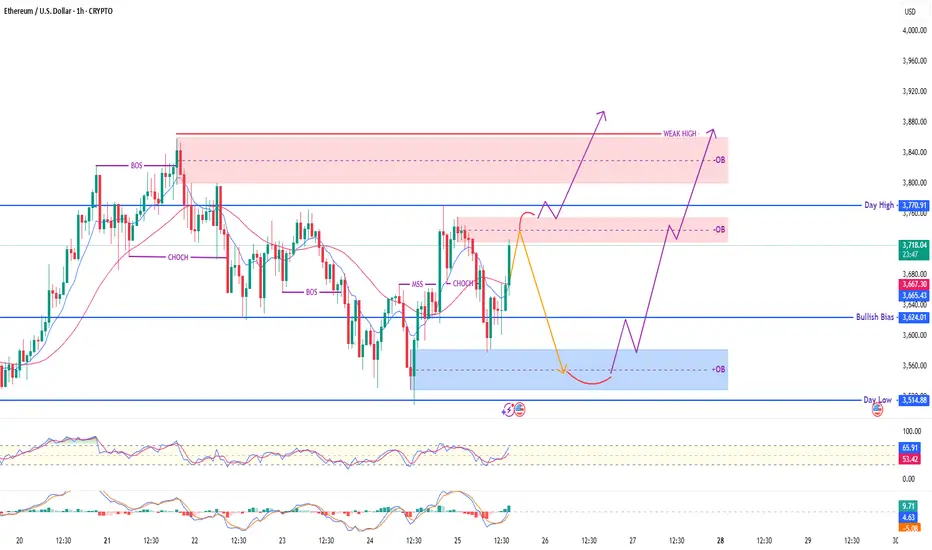
Ethereum / USD – 1H Smart Money Outlook🔹 Current Price: $3,718
🔹 Key Zones:
🔴 Supply Zone (OB): $3,770 – $3,850 (Weak High)
🔵 Demand Zone (OB): $3,540 – $3,600
⚠️ Bullish Bias Level: $3,624
🔹 Day High / Low: $3,770.91 / $3,514.88
🧠 Market Structure Overview:
✅ CHoCH → MSS confirmed bullish intent
✅ Price reclaimed structure above EMA
🔁 Price may react at supply zone, retrace to demand, then rally
📈 Scenario Outlook:
Bearish Rejection from OB Zone:
🔸 Price taps OB → drops to demand (blue zone)
🔸 Bullish reaction expected at deep discount zone
Direct Bullish Breakout:
🔸 Clean breakout above weak high → potential for trend continuation
🧠 Smart Money Notes:
BOS + CHoCH + MSS confirms internal liquidity shifts
OB zones respected repeatedly = high reaction probability
RSI overbought → short-term pullback likely
📊 Indicators:
RSI: 65.99 (Approaching overbought)
MACD: Bullish crossover
EMA Crossover: Bullish
✅ Bias: Bullish
🕰️ Timeframe: 1H
🔍 Strategy: Wait for discount entry or bullish breakout
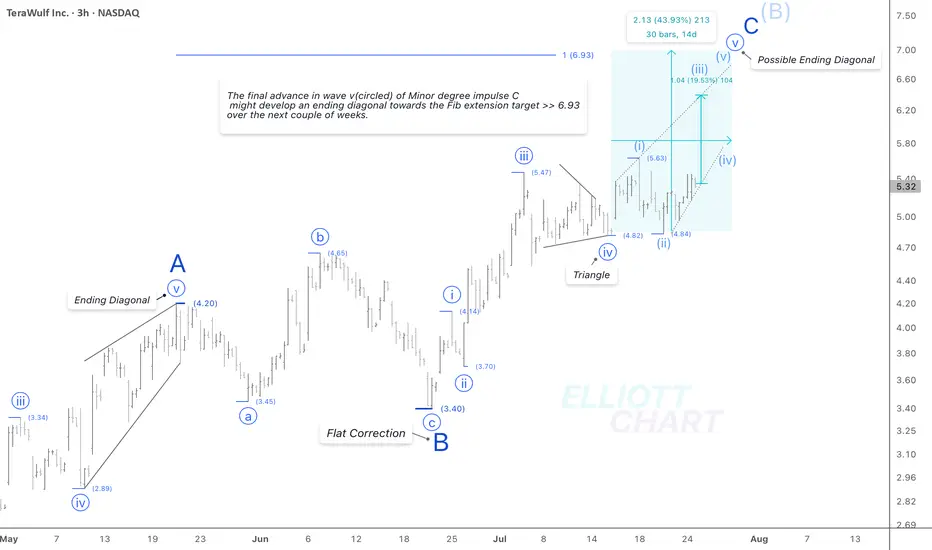
WULF / 3hWave Analysis >> While the current outlook on WULF remains consistent with previous analysis, the internal structure of wave v (circled) suggests the potential development of an ending diagonal in the final leg of Minor degree wave C.
Trend Analysis >> Upon completion of Minor degree wave C, the countertrend advance of Intermediate degree wave (B), which has been unfolding since April 9, is likely to give way to a decline in wave (C) of the same degree. This downtrend might begin in the coming days and potentially extend through the end of the year.
NASDAQ:WULF CRYPTOCAP:BTC BITSTAMP:BTCUSD MARKETSCOM:BITCOIN
#CryptoStocks #WULF #BTCMining #Bitcoin #BTC
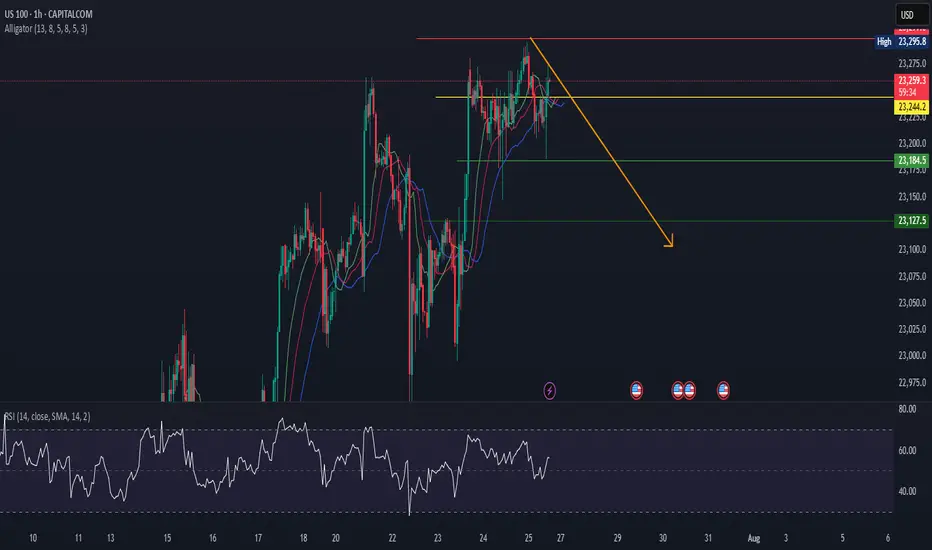
US100Us100 is in reversal MOde.
Big bearish divergence also shown in RSI.
Alligator alos indicates trend will go down from here.
we sell at CMP>
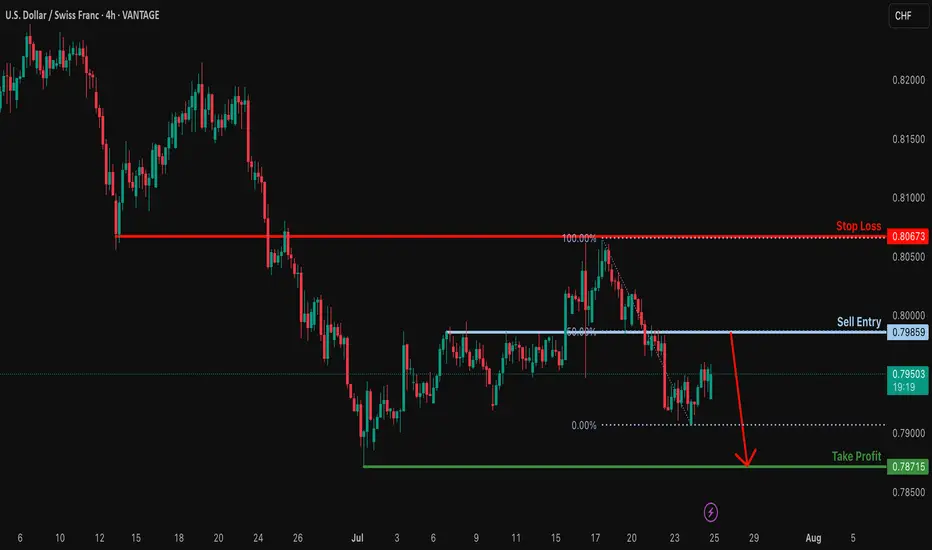
Bearish drop?USD/CHF is rising towards the resistance level which is an overlap resitance that lines up with the 50% FIbonacci retracement and could reverse from this level to our take profit.
Entry: 0.7985
Why we like it:
There is an overlap reistance that lines up with the 50% FIbonacci retraecment.
Stop loss: 0.8067
Why we like it:
There is an overlap resitance.
Take profit: 0.7871
Why we like it:
There is a swing low support.
Enjoying your TradingView experience? Review us!
Please be advised that the information presented on TradingView is provided to Vantage (‘Vantage Global Limited’, ‘we’) by a third-party provider (‘Everest Fortune Group’). Please be reminded that you are solely responsible for the trading decisions on your account. There is a very high degree of risk involved in trading. Any information and/or content is intended entirely for research, educational and informational purposes only and does not constitute investment or consultation advice or investment strategy. The information is not tailored to the investment needs of any specific person and therefore does not involve a consideration of any of the investment objectives, financial situation or needs of any viewer that may receive it. Kindly also note that past performance is not a reliable indicator of future results. Actual results may differ materially from those anticipated in forward-looking or past performance statements. We assume no liability as to the accuracy or completeness of any of the information and/or content provided herein and the Company cannot be held responsible for any omission, mistake nor for any loss or damage including without limitation to any loss of profit which may arise from reliance on any information supplied by Everest Fortune Group.
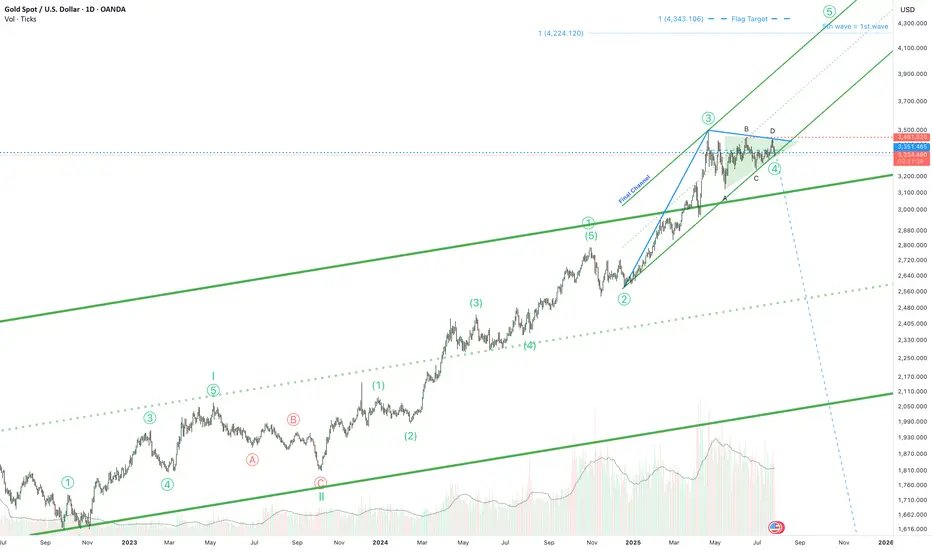
Gold is ready for the 5th wave!Hello! If you're following gold, here's some exciting news. The triangle correction phase that began in April is almost over. It's been a long journey, but we're almost there.
And guess what? The final phase is expected to reach around $4,300. But wait, there's more! The price is holding above the top of a long-term channel. This isn't just a random move; it could be a strong signal that the price could rise even higher than the $4,300 mark.
So, if you're following the gold market, keep your eyes peeled. Big moves could be just around the corner!
$XAUUSD: Macro InterconnectionsResearch Notes
Linking historic surface area and coordinates of consistent geometric expressions to document and learn more about the "texture" of self-organizing processes. The topology assumes that current price is a result of all history together that took to make the price end up where it is.
The fastest shortcut to figure out fractal hierarchy of waves and general direction is through Fractal wave marker .
Since angle of highs cycle is broken and price stayed above it for long time. That means it would be better to strip the chart starting from the lower levels, in order to get better coordinates for structural basis.
FWM helps to spot that distinctive part of broken waves that enables visual orientation in the rhythm. They manifest in its closest formative across cycles.
The angle that links the pattern through the time can have deterministic property, therefore we can use that direction for fibonacci channels to fill the gaps.
The fact that on log scale the bits from bullish phase of cycles contracted on price scale, I'd orientate with thin fibonacci channels (that is based on angle of lows of macro-cycle applied to previous ATH.
There are some other interconnection that are being tested.

"XAU/USD Hits Major Demand – Is a Relief Rally Brewing?"🟡 XAU/USD (Gold) – Demand Zone Rejection in Play | Bullish Correction Ahead?
Timeframe: 30-Minute | Date: July 25, 2025
Created by: AllyPipsExpert
Indicators: Ichimoku Cloud, BOS (Break of Structure), Dynamic S/R, Trendlines
---
🔍 Technical Analysis & Key Insights:
🔸 1. Market Recap – Distribution & Downtrend Confirmation:
After the Break of Structure (BOS) near 3385, gold confirmed a bearish reversal following the distribution phase at the top resistance zone around 3445–3460.
Bearish momentum was sustained by a descending trendline, paired with a bearish Kumo (Ichimoku cloud) crossover.
🔸 2. Major Zone Tagged – Key Demand Area Tested:
Price has now reached the critical demand block at 3320–3340, a zone that previously initiated bullish impulse on July 18–19.
The current bullish projection (in blue) reflects potential short-term recovery or correction phase, following oversold conditions and historical support strength.
🔸 3. Bullish Reversal Potential – Short-Term Retracement?
The blue arrow reflects a likely bullish retracement toward 3360–3380, aligning with trendline retest and potential Kumo rejection.
Expect sellers to re-enter if price retests former BOS/imbalance zone, creating scalp or swing sell setups on confirmation.
---
🔧 Confluences & Technical Highlights:
Confluence Point Description
Demand Zone Strong previous accumulation at 3320–3340
BOS Retest Area Key liquidity level now acting as resistance
Ichimoku Cloud Price below cloud = bearish bias maintained
Descending Trendline Reinforces bearish structure unless broken
Price Action Rejection wick at demand + potential short squeeze
---
🎯 Trade Outlook:
🧭 Bias: Short-Term Bullish Rebound → Long-Term Bearish Continuation
🟩 Support: 3320 – 3340
🟥 Resistance: 3360 – 3385 (BOS & Trendline zone)
🔁 Scenario: Bounce → Retest → Continuation lower (unless breakout confirmed)
---
📘 Why This Chart Could Be Featured:
✅ Multi-layered Analysis: BOS, zones, cloud, price action, and psychological zones used together.
✅ Forward-Looking: Projects the next logical market reaction instead of just explaining the past.
✅ Clean, Structured, Educational: Layout and visuals guide the viewer through logical trade steps.
✅ Value-Packed: Provides actionable levels and flexible scenarios — helpful to traders of all levels.

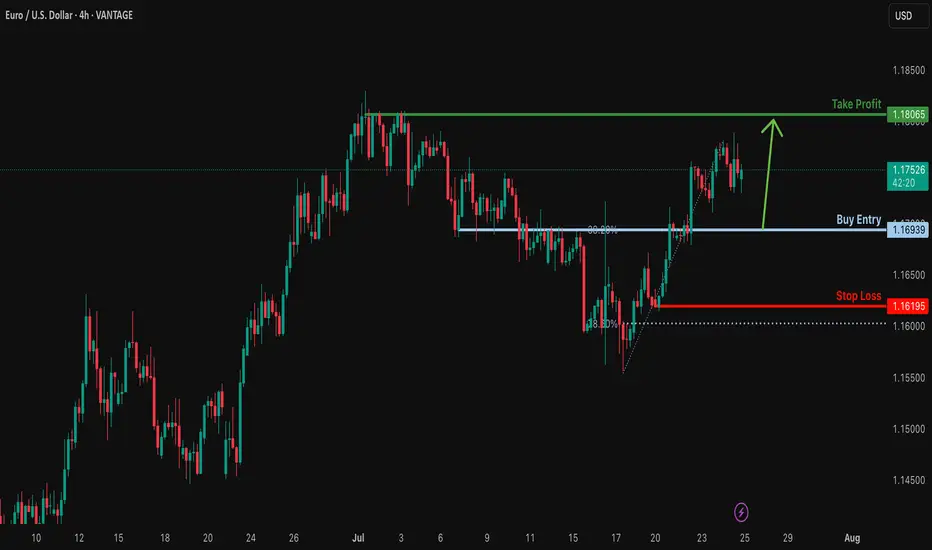
Bullish bounce off overlap support?EUR/USD is falling towards the support level, which is an overlap support that aligns with the 38.2% Fibonacci retracement and could bounce from this level to our take profit.
Entry: 1.1693
Why we like it:
There is an overlap support that lines up with the 38.2% Fibonacci retracement.
Stop loss: 1.1619
Why we like it:
There is a pullback support that is slightly above the 78.6% Fibonacci retracement.
Take profit: 1.1806
Why we like it:
There is a swing high resistance.
Enjoying your TradingView experience? Review us!
Please be advised that the information presented on TradingView is provided to Vantage (‘Vantage Global Limited’, ‘we’) by a third-party provider (‘Everest Fortune Group’). Please be reminded that you are solely responsible for the trading decisions on your account. There is a very high degree of risk involved in trading. Any information and/or content is intended entirely for research, educational and informational purposes only and does not constitute investment or consultation advice or investment strategy. The information is not tailored to the investment needs of any specific person and therefore does not involve a consideration of any of the investment objectives, financial situation or needs of any viewer that may receive it. Kindly also note that past performance is not a reliable indicator of future results. Actual results may differ materially from those anticipated in forward-looking or past performance statements. We assume no liability as to the accuracy or completeness of any of the information and/or content provided herein and the Company cannot be held responsible for any omission, mistake nor for any loss or damage including without limitation to any loss of profit which may arise from reliance on any information supplied by Everest Fortune Group.