HEI/USDT - Higher !!showing strong bullish price action, consistently printing higher highs and higher lows with aggressive buyer pressure. The structure indicates sustained momentum, and the current consolidation above recent support suggests strength.
marked the green box as a buy zone starting from the current market price, as this area aligns with previous S/R flip zone turned support. This provides a favorable entry for continuation toward the next key resistance levels.
SL : 0.32
Trend Analysis

$CHILLGUY Bounce Ahead? +33% Potential$CHILLGUY just bounced off the support in its rising wedge on the 4H chart.
If the trend holds, we could see a 33% move toward the $0.08938 zone.
But if it breaks below, the setup’s off, so watch closely and manage risk.
DYOR, NFA

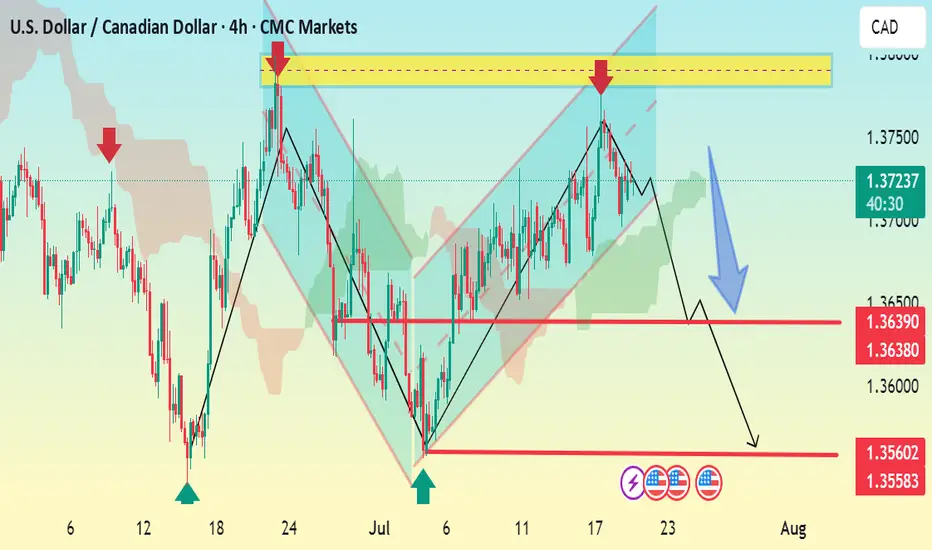
USDCAD 4H Bearish SetupThe USDCAD chart shows a clear bearish breakdown from the ascending channel. Price has broken below support near 1.3720, confirming a shift in structure.
Key Analysis:
Bearish Momentum: Break below the channel and current market structure signals downside pressure.
Immediate Resistance: 1.3725–1.3745 zone (yellow area) where price previously rejected.
Support Levels:
1.3639 / 1.3638: Short-term support — possible temporary bounce area.
1.3560: Main target — previous demand zone.
Trade Idea:
Sell below 1.3720
TP1: 1.3639
TP2: 1.3560
SL: Above 1.3750 (above resistance zone)
Summary:
Bias remains bearish as long as the price stays below 1.3725–1.3750 resistance zone. Confirmation of further downside expected on break below 1.3638.
Let me know if you want this as a signal format or turned into an image.
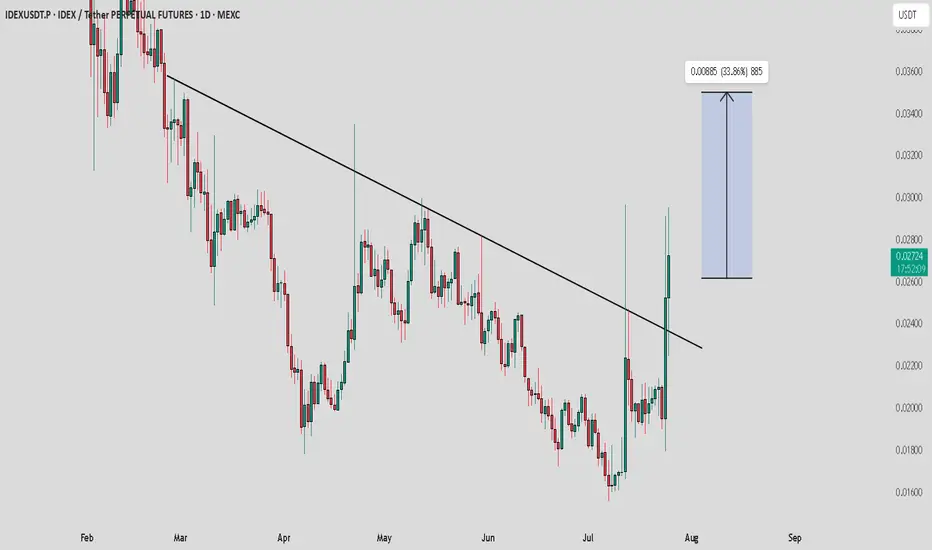
IDEX / USDT : looking bullish in choppy market situationThe overall market is not looking very strong right now, but IDEX is showing bullish potential. It's moving with strong volume and confirming its breakout with consistent bullish moves.
Key Points:
IDEX seems to be breaking out with solid momentum.
Watch for confirmation of continued bullish movement to ensure it’s not a fakeout.
Note:
Manage your risk carefully. Only invest money you can afford to lose. Always Do Your Own Research (DYOR) before making any decisions. Stay cautious and ensure you're prepared for any market fluctuations.
ETHW Looks Bullish (12H)Considering the CH and bullish CHs on the chart, as well as the recent reclaim of key levels, we can maintain a bullish outlook on this coin.
The targets have been marked on the chart.
If a pullback occurs to the green zone, it could present a buy/long opportunity.
A daily candle close below the invalidation level will invalidate this analysis.
For risk management, please don't forget stop loss and capital management
Comment if you have any questions
Thank You

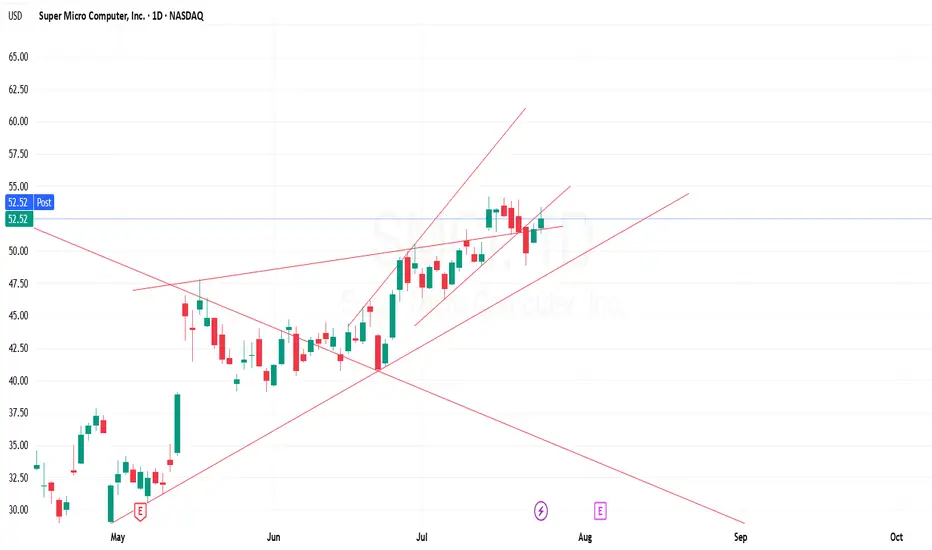
Reversal from Daily Trendline50, 52, 54 sees major resistance. As of today, rejection seen in the daily trend line.
Support 1: 48.90
Support 2: 46.30
Support 3: 35
BTC Reloading for Breakout — Watching for 1H MSS Flip
BTC has bounced from local support (green zone) and is challenging the descending trendline.
The price is now testing the red resistance zone and the upper boundary of the 1H MSS (market structure shift) box.
Scenario A (Bullish):
— If BTC cleanly breaks the trendline and flips the 1H MSS box into support (with a strong close above), this is a trigger for a scalp long.
— Target for the move is the upper green box/previous high area near $122,000.
Scenario B (Bearish/Invalidation):
— If price is rejected at the red resistance and falls back below the green support box, risk of deeper pullback toward $116,000 increases.
BTC has shown resilience by quickly reclaiming support after a sweep lower, indicating strong demand. The market looks to be reloading for another push, with liquidity building up just below resistance. The setup favors a breakout if NY Open brings momentum. The flip of the 1H MSS box would confirm bullish intent. However, caution if the breakout fails — structure remains choppy and a failed breakout can trap late buyers.

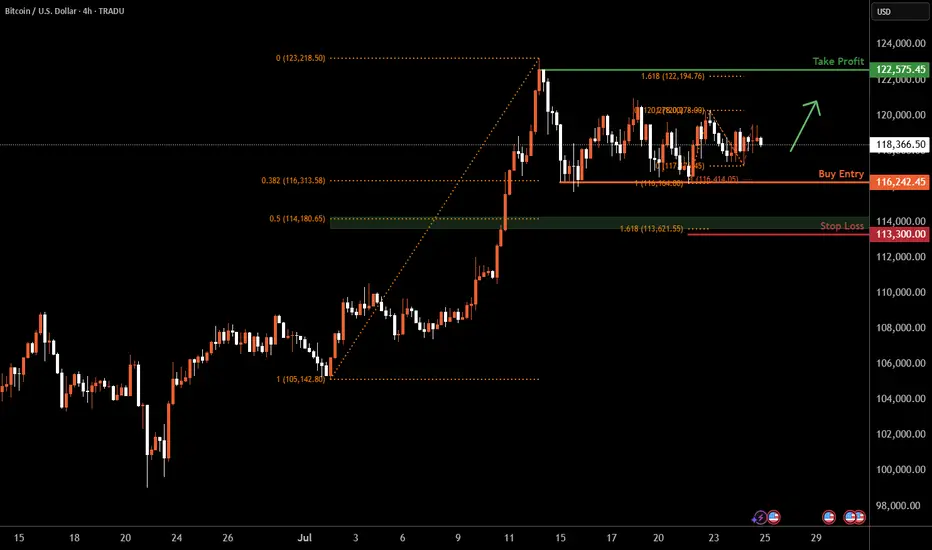
Bitcoin H4 | Falling toward a multi-swing-low supportBitcoin (BTC/USD) is falling towards a multi-swing-low support and could potentially bounce off this level to climb higher.
Buy entry is at 116,242.45 which is a multi-swing-low support that aligns with a confluence of Fibonacci levels i.e. the 38.2% retracement and the 100% projection.
Stop loss is at 113,300.00 which is a level that lies underneath a support zone that is identified by a confluence of Fibonacci levels i.e. the 50% retracement and the 161.8% extension.
Take profit is at 122,575.45 which is a swing-high resistance that aligns close to the all-time-high.
High Risk Investment Warning
Trading Forex/CFDs on margin carries a high level of risk and may not be suitable for all investors. Leverage can work against you.
Stratos Markets Limited (tradu.com ):
CFDs are complex instruments and come with a high risk of losing money rapidly due to leverage. 66% of retail investor accounts lose money when trading CFDs with this provider. You should consider whether you understand how CFDs work and whether you can afford to take the high risk of losing your money.
Stratos Europe Ltd (tradu.com ):
CFDs are complex instruments and come with a high risk of losing money rapidly due to leverage. 66% of retail investor accounts lose money when trading CFDs with this provider. You should consider whether you understand how CFDs work and whether you can afford to take the high risk of losing your money.
Stratos Global LLC (tradu.com ):
Losses can exceed deposits.
Please be advised that the information presented on TradingView is provided to Tradu (‘Company’, ‘we’) by a third-party provider (‘TFA Global Pte Ltd’). Please be reminded that you are solely responsible for the trading decisions on your account. There is a very high degree of risk involved in trading. Any information and/or content is intended entirely for research, educational and informational purposes only and does not constitute investment or consultation advice or investment strategy. The information is not tailored to the investment needs of any specific person and therefore does not involve a consideration of any of the investment objectives, financial situation or needs of any viewer that may receive it. Kindly also note that past performance is not a reliable indicator of future results. Actual results may differ materially from those anticipated in forward-looking or past performance statements. We assume no liability as to the accuracy or completeness of any of the information and/or content provided herein and the Company cannot be held responsible for any omission, mistake nor for any loss or damage including without limitation to any loss of profit which may arise from reliance on any information supplied by TFA Global Pte Ltd.
The speaker(s) is neither an employee, agent nor representative of Tradu and is therefore acting independently. The opinions given are their own, constitute general market commentary, and do not constitute the opinion or advice of Tradu or any form of personal or investment advice. Tradu neither endorses nor guarantees offerings of third-party speakers, nor is Tradu responsible for the content, veracity or opinions of third-party speakers, presenters or participants.
ManaDecentraland token
Mana usdt Daily analysis
Time frame daily
Risk rewards ratio =2 👈👌
Target = 0439 $
0.44$ - 0.46$ is strong resistance for mana
If price can break this resistance it will go to 0.6$

MOVR (SPOT)BINANCE:MOVRUSDT
#MOVR/ USDT
Entry (5.000- 5.700)
***** (Wait for the price to come to the entry range & price may come to the lowest entry point ) ******
SL 4H close below 4.900
T1 7.00
T2 9.50
T3 12.00
Extra Target
T4 13.50
_______________________________________________________
Golden Advices.
********************
* collect the coin slowly in the entry range.
* Please calculate your losses before the entry.
* Do not enter any trade you find it not suitable for you.
* No FOMO - No Rush , it is a long journey.

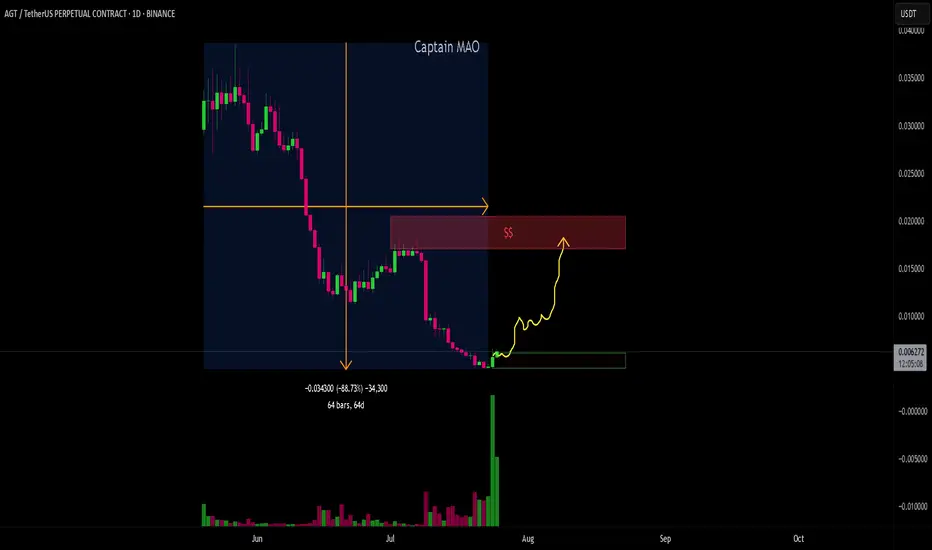
AGT/USDT - ReversalAGT/USDT has been under massive selling pressure since its listing on May 20, 2025, leading to a sharp ~90% decline. However, recent price action is showing strong signs of a potential reversal. Buyers have stepped in aggressively with a noticeable surge in volume, signaling a possible end to the downtrend. The current structure suggests the beginning of accumulation and a high-probability setup for a trend reversal. Targeting 0.018-0.02$ which huge liquidity can be found at this zone .
potential here with a bearish moveThis is a continuation pattern to the downside that we are watching for a good short entry on. It could still push up to around 201.125 ish area, so no move yet, just on the radar.

NZDUSD: Free Trading Signal
NZDUSD
- Classic bullish setup
- Our team expects bullish continuation
SUGGESTED TRADE:
Swing Trade
Long NZDUSD
Entry Point - 0.6013
Stop Loss - 0.6004
Take Profit - 0.6028
Our Risk - 1%
Start protection of your profits from lower levels
Disclosure: I am part of Trade Nation's Influencer program and receive a monthly fee for using their TradingView charts in my analysis.
❤️ Please, support our work with like & comment! ❤️

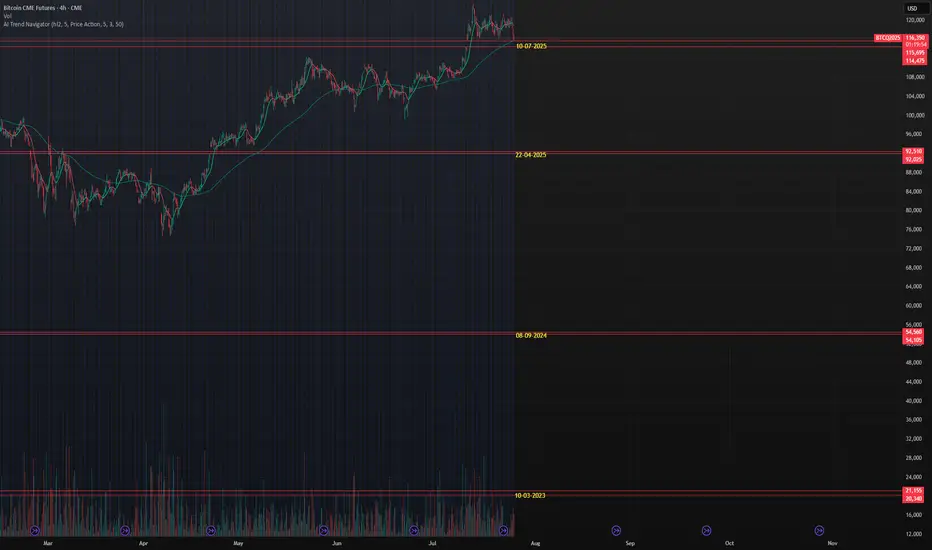
CME Gaps, which will be filled?Currently 4 gaps in the CME futures chart, running back till 2023 (march). What gap will be filled at some point in the future or will some remain open....
Gold Spot / U.S. Dollar (XAUUSD) - 4 Hour Chart (OANDA)4-hour chart from OANDA displays the price movement of Gold Spot (XAUUSD) from late July to early August 2025. The current price is $3,332.775, reflecting a decrease of $35.935 (-1.07%) as of 07:54 PM PKT on July 25, 2025. Key levels include a sell price of $3,332.480 and a buy price of $3,333.050. The chart shows recent volatility with a shaded support zone around $3,312.314 to $3,367.326, indicating potential price stabilization or reversal areas.

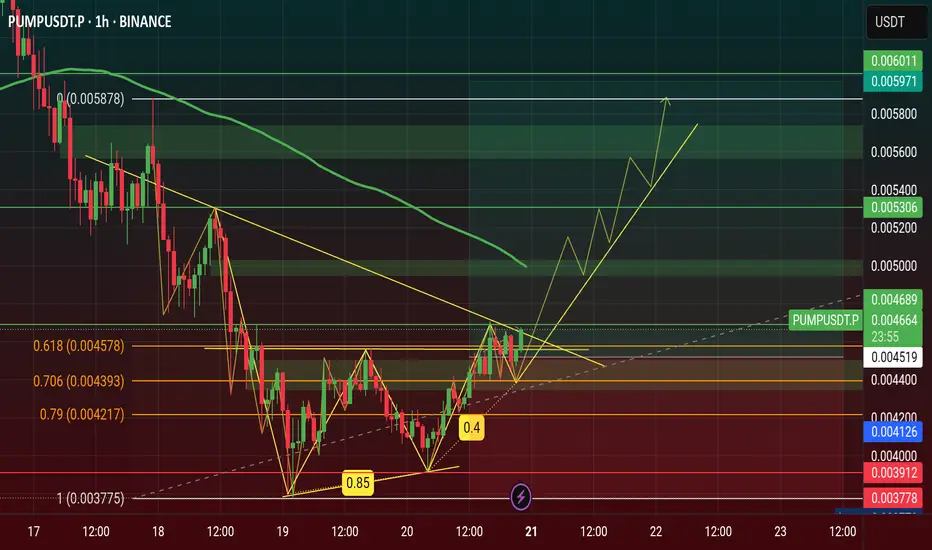
$PUMP Price Will Hit $0.006 this July 2025 see on Chart...🚀 NYSE:PUMP Price Will Hit $0.006 this July 2025, NYSE:PUMP is Showing a Double Bottom Pattern Looking on Chart now.
Double Bottom Pattern is a Reversal Pattern and It's will Manipulation Price of Pump. I'm Find a Three White Shoulders Candle in bottom price area on 4h Chart & It is a Bullish Candle. Now Price Retest and If it's Breakout it will be happened this month.
#Write2Earn #TrendingPredictions #AltcoinSeasonLoading #pump #SUBROOFFICIAL
Disclaimer: This article is for informational purposes only and does not constitute financial advice. Always conduct your own research before making any investment decisions. Digital asset prices are subject to high market risk and price volatility. The value of your investment may go down or up, and you may not get back the amount invested. You are solely responsible for your investment decisions and Binance is not available for any losses you may incur. Past performance is not a reliable predictor of future performance.
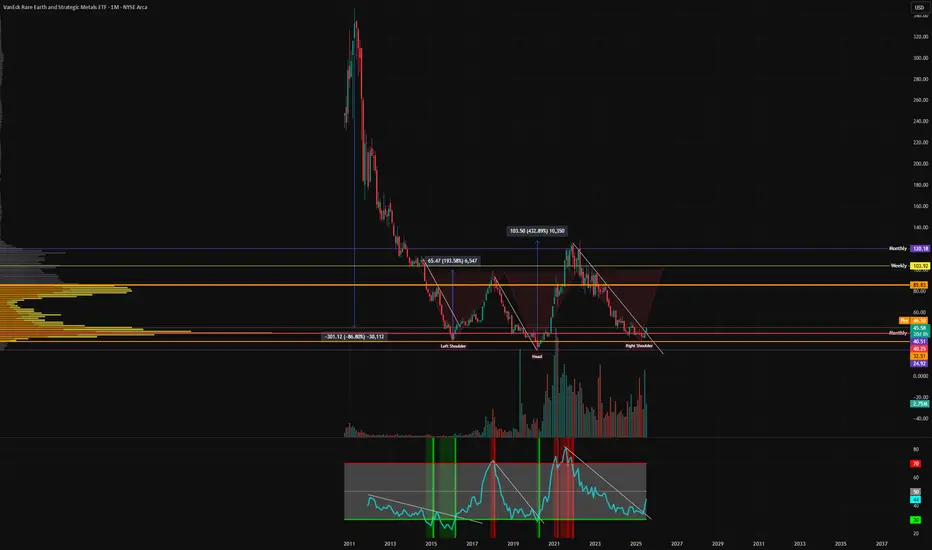
Rare Earth UpdateTo provide an update on why I went long Rare Earth. I noticed the after hours move up on MP materials, at 20% increase before market open which quickly became a 50% move when trading started. This particular ETF holds MP Material as a major holding and it hadn't moved much as it should have. I posted a trade idea on Lynas, which went up the following day. The TA on this chart suggests the move up may have plenty of room to the upside.
This is a highly cyclical ETF, as expected from any mining related asset. There's periods of huge drawdowns followed by sharp moves to the upside. We have broken out of the downtrend, we have held the POC as support and bullish volume suggests the move is not a fakeout.
Zooming out, I see a giant inverse head and shoulders pattern. You can also see the RSI downtrend has been broken.
Not financial advice, congratulations to anyone who took the trade on this with me. I have moved my stop loss to break even, if price breaks below I will get stopped out with no loss.
Not financial advice, do what's best for you.
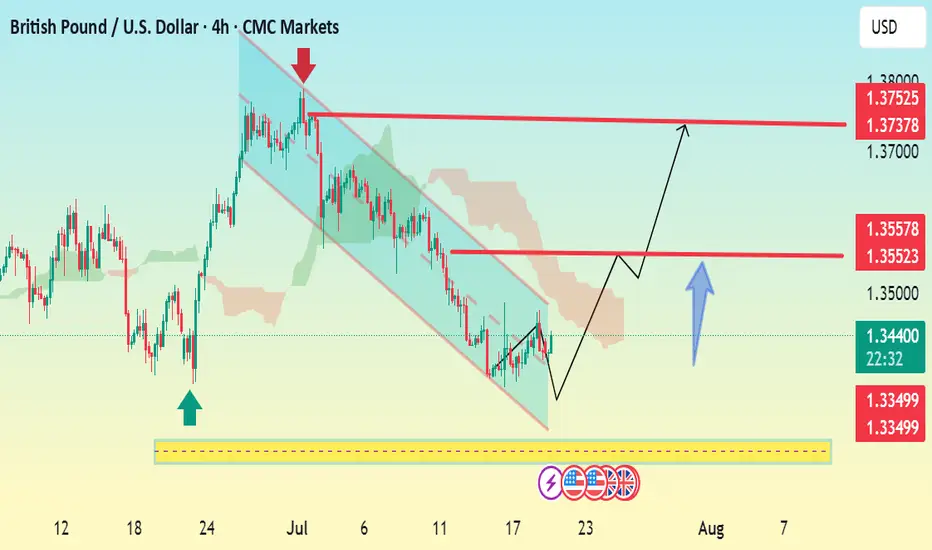
GBP/USD 4H Bullish Reversal Setup Analysis:The chart shows GBP/USD breaking out of a descending channel, signaling a potential bullish reversal.
Price has bounced from a strong support zone (highlighted in yellow), with bullish momentum building.
The breakout is backed by a higher low structure, which often precedes an uptrend continuation.
Key Levels:
Support: 1.3349
First Resistance / TP1: 1.3552–1.3557
Final Target / TP2: 1.3737–1.3752
Outlook:
If price holds above 1.3439 and breaks 1.3552 with volume, the next leg toward 1.3750 is likely.
Watch for retests of the breakout level for confirmation before entering long.
📈 Bias: Bullish above 1.3439
🕐 Timeframe: 4H chart
Let me know if you want SL (stop loss) and entry suggestions too.
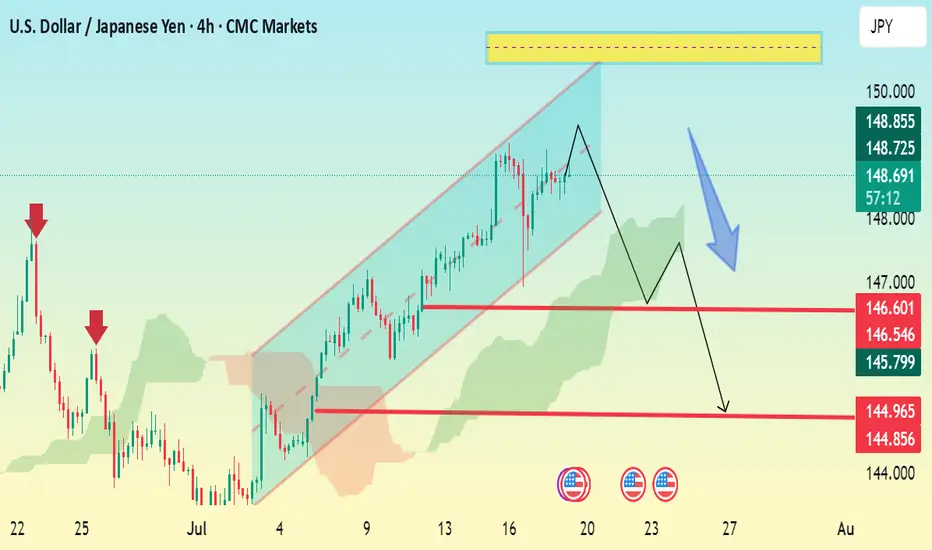
USD/JPY 4H Bearish Setup – Channel Breakdown ExpectedThe chart shows USD/JPY in a rising channel with a projected bearish reversal setup forming. Here’s a breakdown:
🔹 Current Price: 148.83
🔹 Pattern Observed:
The pair is trading inside a rising channel.
A potential double top or lower high formation near the top of the channel suggests weakening bullish momentum.
Price may break down through the channel support.
🔻 Bearish Scenario (as shown by the blue arrow):
1. Initial drop expected to the support zone around:
146.60 – 146.54
Minor consolidation possible at this level.
2. If broken, next target zone is:
144.96 – 144.85
🔑 Key Levels:
Resistance Zone: 149.80–150.00 (highlighted in yellow)
Support Levels:
First: 146.60
Second: 144.96
✅ Bearish Confirmation:
A 4H candle close below 146.60 would confirm the bearish move.
Watch Ichimoku cloud — if price breaks and closes below the cloud, it will strengthen the downtrend.
Guppy - Long TradeExpecting a bearish move down and then a strong reversal at the levels displayed!
Happy Trading!

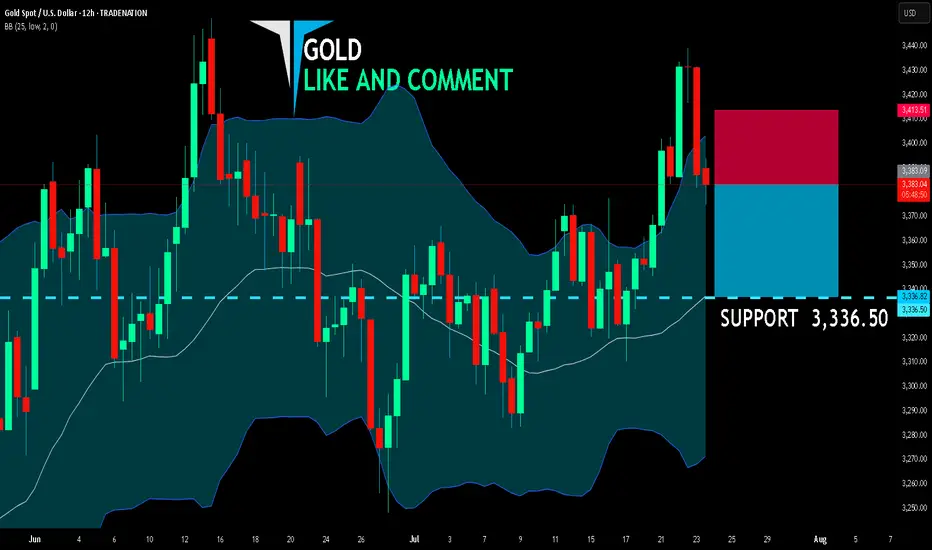
GOLD BEARS ARE STRONG HERE|SHORT
GOLD SIGNAL
Trade Direction: short
Entry Level: 3,383.09
Target Level: 3,336.50
Stop Loss: 3,413.51
RISK PROFILE
Risk level: medium
Suggested risk: 1%
Timeframe: 12h
Disclosure: I am part of Trade Nation's Influencer program and receive a monthly fee for using their TradingView charts in my analysis.
✅LIKE AND COMMENT MY IDEAS✅
GOLD continues to correct down, good news from trade situationOANDA:XAUUSD has fallen sharply again, currently trading around $3,360/oz, reflecting the easing of global trade tensions, affecting demand for safe-haven assets. The US Dollar and US Treasury yields have also increased, affecting gold prices.
The US Dollar Index ( TVC:DXY ), which tracks the greenback against six other currencies, rose to 97.56.
The yield on the 10-year US Treasury note US10Y rose to 4.386%. The US real yield, calculated by subtracting inflation expectations from nominal interest rates, rose nearly 3.5 basis points to 2.046%.
Markets are increasingly optimistic about such deals after the United States and Japan reached a trade deal, and the European Union could be next. In addition, rising stock markets and low volatility have kept gold's gains in check.
The United States and the European Union are moving toward a potential trade deal that would include a 15% tariff on EU goods and zero tariffs on some items.
The European Commission said Thursday that a negotiated trade solution with the United States is within reach.
“Our focus is on reaching a negotiated outcome with the United States,” a European Commission spokesperson told reporters about the EU-U.S. tariff talks. “We believe that such an outcome is achievable.” The European Commission has repeatedly said that its current priority is to reach a deal with the United States to avoid the 30% tariffs that U.S. President Trump has proposed to impose on EU products starting August 1.
On the economic data front, initial jobless claims in the United States unexpectedly fell last week, suggesting the job market remains solid.
The U.S. Bureau of Labor Statistics reported on Thursday that initial jobless claims fell to 217,000 in the week ended July 19, below expectations of 227,000 and down from 221,000 the previous week.
Technical Outlook Analysis OANDA:XAUUSD
Gold is heading for its third consecutive day of decline since hitting the bullish target level sent to readers in the weekly edition on Sunday at $3,430.
Despite the sharp decline, gold still has enough technical conditions for an uptrend given its current position and structure.
Specifically, gold is still above the EMA21, which is considered the nearest support at the moment. Along with that, the uptrend price channel is the short-term trend. However, for gold to qualify for a short-term bullish cycle, it needs to be confirmed by price action above the 0.236% Fibonacci retracement level, then the target is $3,400 in the short term, more than $3,430.
On the other hand, RSI is still holding above 50, and 50 in this case acts as momentum support. Therefore, gold still has room to rise.
In case gold is sold below EMA21, it may suffer a further decline with the next target around $3,310 in the short term, more than $3,300 and the 0.382% Fibonacci retracement level. And if gold loses the support at the 0.382% Fibonacci level, it will qualify for a bearish cycle.
Intraday, the current position of gold price is still tilted towards the upside, and the notable price points will be listed as follows.
Support: $3,350 – $3,310 – $3,300
Resistance: $3,371 – $3,400 – $3,430
SELL XAUUSD PRICE 3406 - 3404⚡️
↠↠ Stop Loss 3410
→Take Profit 1 3398
↨
→Take Profit 2 3392
BUY XAUUSD PRICE 3329 - 3331⚡️
↠↠ Stop Loss 3326
→Take Profit 1 3337
↨
→Take Profit 2 3343

Bullish potential detected for MTSEntry conditions:
(i) higher share price for ASX:MTS along with swing up of indicators such as DMI/RSI.
Stop loss for the trade would be:
(i) below the recent swing low of 6th May (i.e.: below $3.21), or
(ii) a close below the 50 day moving average (currently $3.16), or
(ii) below the support level from the open of 11th April (i.e.: below $3.12), depending on risk tolerance.
