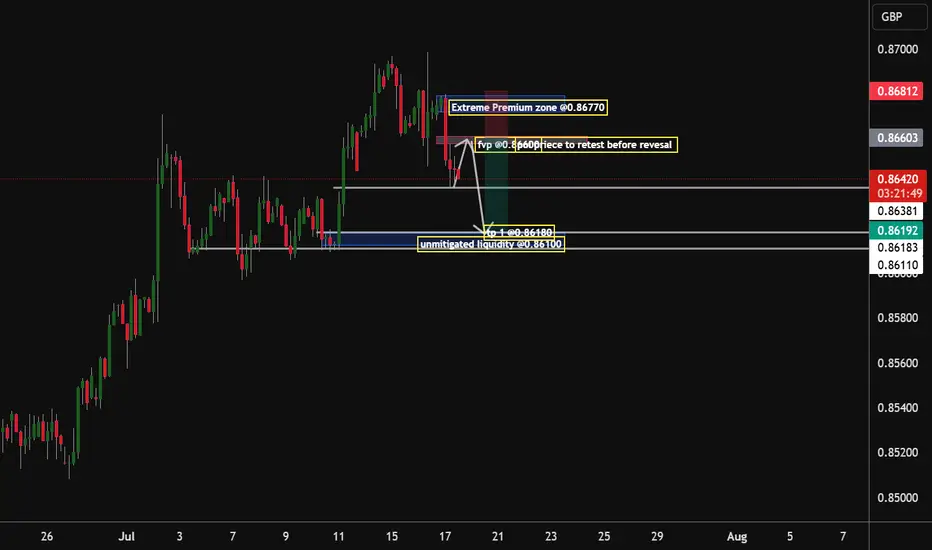
Eur/Gbp Bears to seek the 0.86180 Handle By early next week, my analysis according to the market structure being formed suggests that the institution that drives the market will have to be dovish on this pair, as there is unmitigated liquidity awaiting to be grabbed @ the 0.86100 zone by the end of next week will have to see that zone being mitigated
Tp 1.0.86180
Trend Analysis
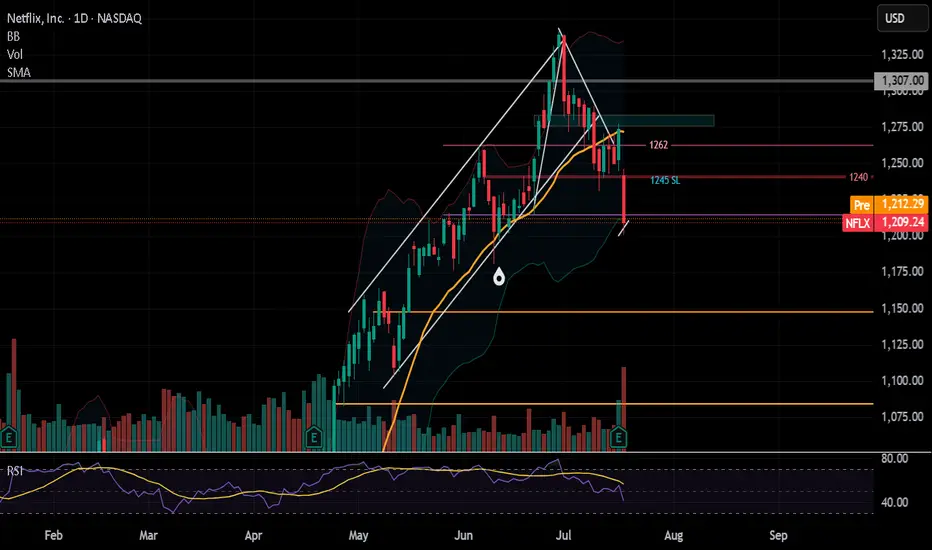
NFLX weak... gapping up to head back downWatching Monday... looking for continuation to downside. This week into next week. 1245 zone is where the post earnings gap down and go started. Using this as my stop loss.
Targets 1200 down to 1180.
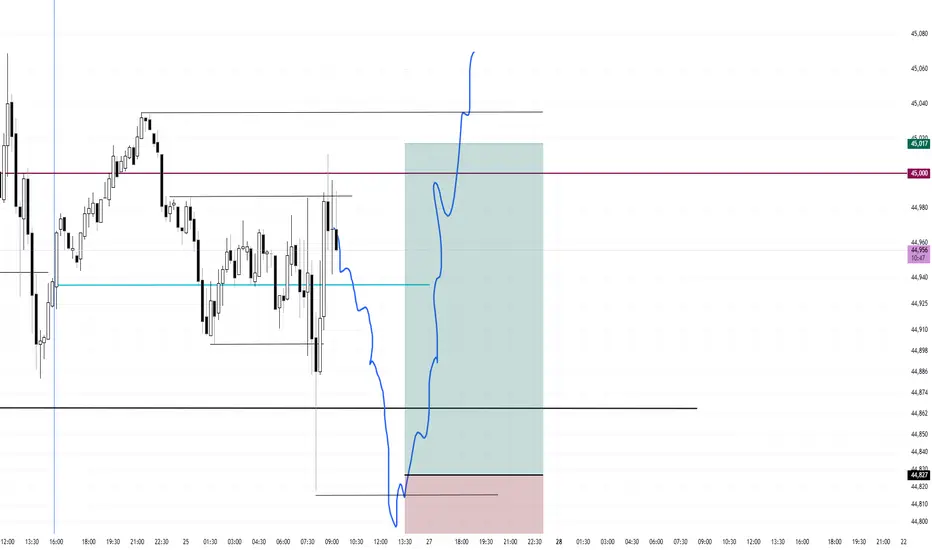
Range Bound Low of Day Buy (If Presented)Price is mean reverting around 45,000 and also mean reverting around today's open. I will be waiting for a mean reversion play under the low of day targeting the high of day.
I will be waiting for a small entry candle, a small doji. I did not take this first run up because the entry vs stop would have been too large. I believe the first mouse in will get dunked on.
Once entered, I will use a 75 tick stop and a 190 tick target for a 2.5 to 1
GOLD Melted , 2 Best Places To Sell Clear , Don`t Miss 200 Pips Here is My 30 Mins Gold Chart , and here is my opinion , we Again Below 3377.00 and we have a 30 Mins Candle closure below this strong res , so i`m waiting the price to go back and retest this res and new support and give me a good bearish price action to can enter a sell trade and we can targeting 200 pips , and we have a good res @ 3365.00 we can sell from it also if the price didn`t reach 3377.00 and targeting from 100:200 pips , and if we have a Daily Closure below This res this will increase the reasons for us , just wait the price to back a little to retest it and then we can sell it . if we have a daily closure aboveit this idea will not be valid anymore .

Now We WaitTrading Fam,
In my last video, I mentioned how I had been learning to trade more patiently, giving myself those high-quality, high-probability winning trades. This is a perfect time to illustrate that strategy.
With our altcoin market overheated, I am expecting more rest, accumulation, and pullback in many of our alts. The selection of even decent entries is very slim. It's time for us to sit back, wait, and let the trades come to us again.
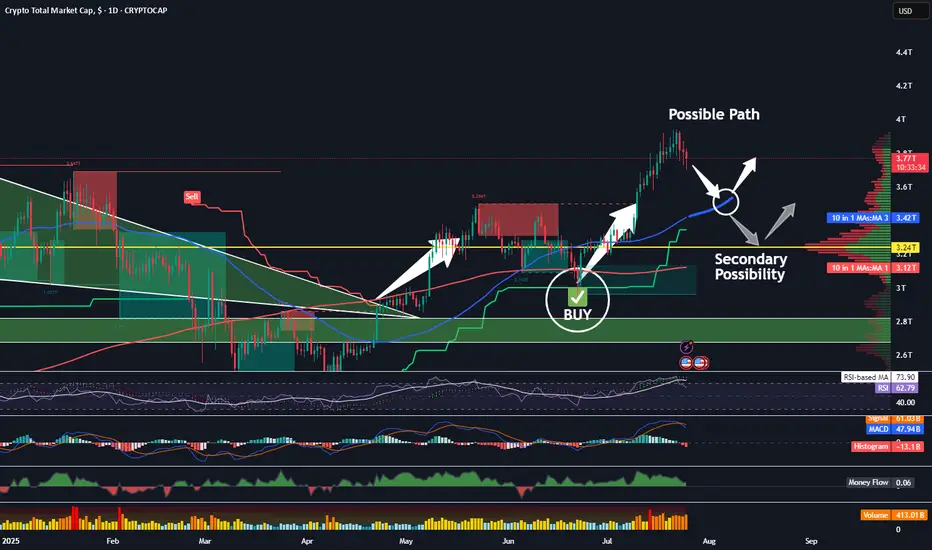
The TOTAL chart shows us more clearly what may occur. Let's discuss a few important indicators on this chart.
First of all, we see my indicator popped a BUY signal right around 3T. We had a safe bet at that point; we were going to see quite a bit of buying action in the altcoin space. Indeed, we did. The altcoin market increased by about 25 percent and went all the way to 4T, at which point the sellers came back in. Now, we are in the middle of a little bit of a pullback, and I think there could be more to come. I am expecting at least a touch of that rising 50-day SMA, currently at 3.4T.
Supporting my thesis here are the crossover of the RSI to the downside of its 14-day MA, the MACD cross, the Chalkin money flow decrease, and the HMV indicating high volume during these sell-offs. Leverage is being liquidated. This is healthy!
It is possible that the total market cap could drop even further, all the way down to that 3.24T PoC on the VRVP. That is where we see most of our volume in alts has occurred. Keep these two targets in mind. Once hit, I will begin looking for more trade entries once again.
✌️Stew
USD/CHF – Bullish Reversal Setup with AB=CD Harmonics (1H TimefrWe’re closely watching USD/CHF, which has been in a bearish trend but is now showing strong signs of a bullish reversal.
A bullish divergence has formed, and the price has reached the Potential Reversal Zone (PRZ) as projected by the AB=CD harmonic pattern. This suggests that the trend may already be reversing.
Additionally, Myfxbook sentiment shows 93% of retail traders are long, reinforcing overall bullish bias. However, for confirmation, we’re waiting for a breakout above the last lower high (LH) to ensure a shift in structure before entering.
🔹 Pair: USD/CHF
🔹 Timeframe: 1H
🔹 Trend: Bearish (reversal expected)
🔹 Divergence: Bullish
🔹 Harmonic Pattern: AB=CD (PRZ hit)
🔹 Sentiment: 93% Long (Myfxbook)
🔹 Bias: Bullish
🔹 Entry (Buy Stop): 0.79463
🔹 Stop Loss: 0.78693
🔹 Take Profit 1: 0.80233
🔹 Lot Size: 0.20
🔹 Risk/Reward: 1:1
🔹 Risk: $200
🔹 Potential Reward: $200
🎯 Strategy: Entry will be triggered only after the breakout of the previous LH, confirming a shift to bullish structure and validating the harmonic reversal.
📌 #USDCHF #ABCDPattern #BullishDivergence #HarmonicTrading #TrendReversal #SmartMoneyMoves #BreakoutSetup #TechnicalAnalysis #PriceAction #ForexSignals #RiskManagement #1HChart #ForexTradeIdeas

SellRejection Level
Daily Volume
Market Structure Shift
London US Session
Trend Line Break
Untapped Order Point
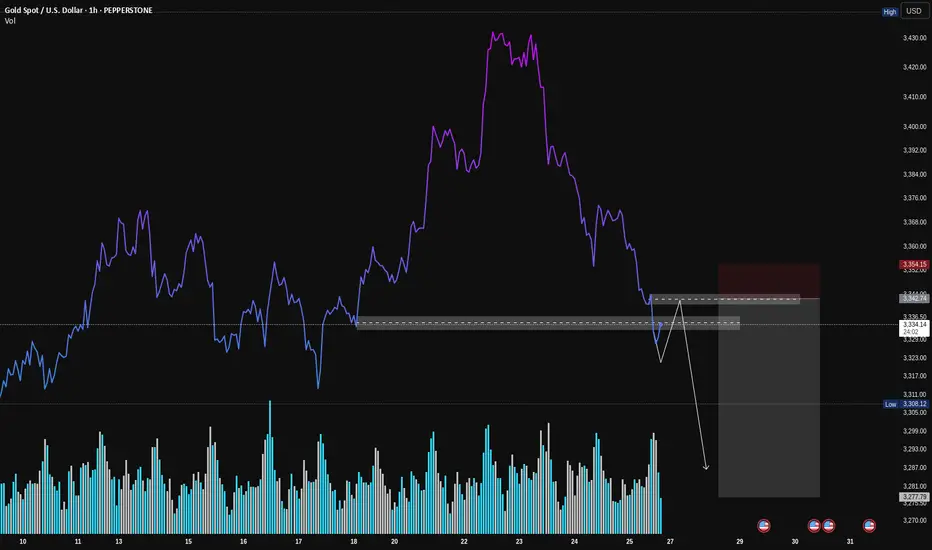
Gold (XAU/USD): A Classic VSA Short Setup in PlayHey Traders,
Following up on the general weakness we discussed in Gold, here's a closer look at a specific trade setup that's unfolding right now. This is a textbook example of a high-probability short setup according to Volume Spread Analysis (VSA).
Let's break down the story the volume is telling us.
1. The Breakdown: Sellers Show Their Hand
First, look at how the price broke down hard through that support level (the grey box). Notice the volume on that sharp drop? It was high. This is our clue that sellers are strong and in control. They had enough power to smash right through a level that was previously holding the price up.
2. The Retest: Buyers Don't Show Up
Now, the price is creeping back up to that same exact level. But here's the most important clue: look at the volume on this rally. It's much lower than the volume on the breakdown.
This is what VSA calls a "No Demand" rally. It’s like the market is trying to push a car uphill without any gas. It tells us that strong buyers (the "smart money") have no interest in buying at these prices.
3. The Setup: Selling into Weakness
This combination creates a classic short setup:
Logic: We are looking to sell at a level where old support has flipped into new resistance.
Confirmation: The low volume on the retest confirms the rally is weak and likely to fail.
How to Potentially Trade It
The grey box represents a high-probability entry zone. To time an entry, you could watch for a clear rejection signal right inside this zone. For example:
A "rejection candle" (like a pin bar) that pushes into the zone but gets slammed back down.
An up-bar with a tiny body and very low volume, showing buyers are completely exhausted.
Seeing one of these signs would be the final confirmation that sellers are about to take back control.
Conclusion:
This is a powerful setup because all the pieces line up: the background is weak, sellers have shown their strength, and buyers are now showing no interest at a key resistance level.
Disclaimer: This is my personal analysis using VSA and is for educational purposes only. It is not financial advice. Always do your own research and manage your risk. Good luck, traders!
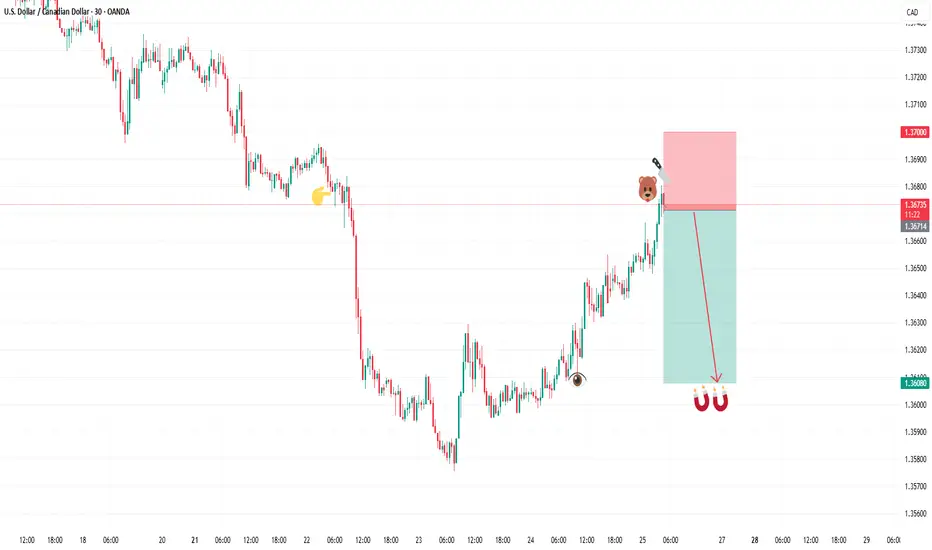
SELL USDCADIn todays session we are monitoring USDCAD for selling opportunities, we have our first entry at 1.36719 and our target is 1.36080 our stop is above 1.3700 , use proper risk management and risk what you can afford. Cheers fam.
GBPUSD BUYGBP/USD drops to 1.3450 area after weak UK Retail Sales data
GBP/USD continues to push lower after closing in negative territory on Thursday and trades near 1.3450 on Friday. Weaker-than-expected Retail Sales data from the UK and the broad-based US Dollar strength forces the pair to stay on the back foot heading into the weekend
GBP/USD came under bearish pressure on Thursday and lost more than 0.5%, snapping a three-day winning streak in the process. The pair extends its slide on Friday and trades below 1.3500.
The renewed US Dollar (USD) strength weighed on GBP/USD on Thursday. The US Department of Labor reported that the number of first-time applications for unemployment benefits declined to 217,000 in the week ending July 19 from 221,000 in the previous week. This reading came in better than the market expectation of 227,000. Additionally, the S&P Global Composite Purchasing Managers Index (PMI) improved to 54.6 (preliminary) in July from 52.9 in June, reflecting an ongoing expansion in the private sector's business activity, at an accelerating pace.
Meanwhile, the EUR/GBP cross rose more than 0.3% on Thursday as the Euro benefited from the European Central Bank's (ECB) cautious tone on policy-easing. EUR/GBP preserves its bullish momentum and trades at its highest level since early April above 0.8700 on Friday, suggesting that the Euro continues to capture capital outflows out of Pound Sterling.
Early Friday, the UK's Office for National Statistics reported that Retail Sales rose by 0.9% on a monthly basis in June. This reading followed the 2.8% decrease recorded in May but came in worse than the market expectation for an increase of 1.2%, making it difficult for GBP/USD to stage a rebound.
In the second half of the day, Durable Goods Orders data for June will be the only data featured in the US economic calendar. Nevertheless, this data is unlikely to have a long-lasting impact on the USD's valuation.
SUPPORT 1.34550
SUPPORT 1.34982
SUPPORT 1.35421
RESISTANCE 1.33990
RESISTANCE 1.33698

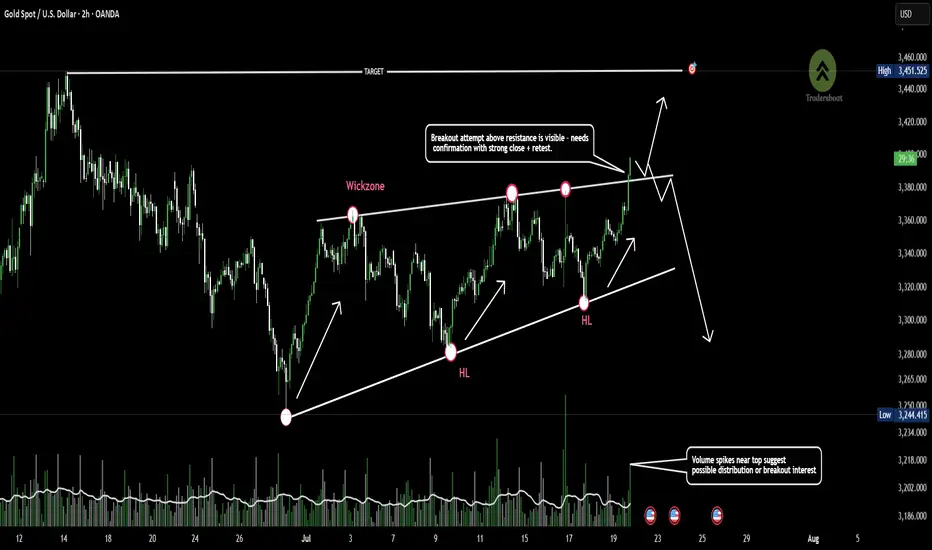
Gold approaches wedge resistance -Breakout or Fakeout incoming?Gold is trading within a rising wedge pattern, showing consistent higher lows and repeated rejections near the 3400 resistance zone.
Price is now approaching the upper trendline, an area of prior wick rejections and potential liquidity grab.
A confirmed breakout could signal continuation, while failure to sustain above this level may indicate bearish divergence or a reversal setup.👀📉
EURGBP: Bearish Forecast & Outlook
The charts are full of distraction, disturbance and are a graveyard of fear and greed which shall not cloud our judgement on the current state of affairs in the EURGBP pair price action which suggests a high likelihood of a coming move down.
Disclosure: I am part of Trade Nation's Influencer program and receive a monthly fee for using their TradingView charts in my analysis.
❤️ Please, support our work with like & comment! ❤️

Head & Shoulders Pattern Confirmed bearish sign A clear Head and Shoulders pattern has formed on the 4H timeframe, and confirmation is in place after a decisive break below the neckline around $39.00.
🔍 Technical Breakdown:
Left Shoulder: Formed around July 11–15
Head: July 19–23 peak
Right Shoulder: Developing through July 24–25
Neckline: ~$39.00 zone (now broken)
Current Price: ~$38.30
Target: ~$38.00 – $37.80 (based on pattern projection)
The break below the 50 EMA adds bearish confirmation. Caution is advised unless price reclaims the neckline level.

Google Buyers Entered Seller Territory.Hello, I am the Cafe Trader.
To finish off our series of the MAG 7 we have GOOGL up next.
If you have been keeping up, I will offer insight into Long term and short term interest. Google has taken out a key sellers on July 21st, and also closed inside the supply zone. This is very bullish, bulls have not got much pushback from the bears, suggesting this could test the highs again, and prime itself for a breakout.
Long term price guide helps you align a buy area with your conviction. I will update the price as of friday's close (today)
Long Term
Aggressive: $179 - If we close today above the bottom of supply line, then I would suggest this aggressive price adjust to 187.50
Fair Sentiment $166 - 173 - Between the big buyers and the strong demand. Also having the trend to support adds a 3rd strength.
Extreme Deal $140-148 - If you can catch a deal here, best to snatch it up. Alot of Big money wil be doing the same.
Short Term
weakness in the supply area is suggesting a run to the top. Trying ot get in here can be tricky. Since today is friday, the close is extremely important to see how our next week will be framed. So here I have 2 Bullish scenarios to help you find opportunity for GOOGL.
Green Scenario
Yes its possible it will run strait up into the top of supply, as a trader, you don't want to be that buyer just yet. I wouldn't personally feel great about trading the green line scenario without seeing a real buyer step into the market. So if we can Find a real buyer, we will play off of them and rirde to the top.
No entry or price targets on this one yet.
Red Scenario
This scenario has a real buyer, and personally I think is a safer trade to take (as of right now). With this squeeze that's happening, there is a good chance at some point there will be buyers getting exhausted and shorts getting a grip on this. This is why I would not buy "top of demand" but would look to get close as I could to the strong demand. and then a ride back to the "Top of Supply"
Entry: 175
Stop: 170
Partial Profit: (when the sellers step in, thats our first TP)
Target: 206
That's a wrap on our MAG 7 series, Happy Trading and we will see you next time.
Next week we are going to chart out Crypto, if you have any specific suggestions you want to see me chart, comment below.
@thecafetrader

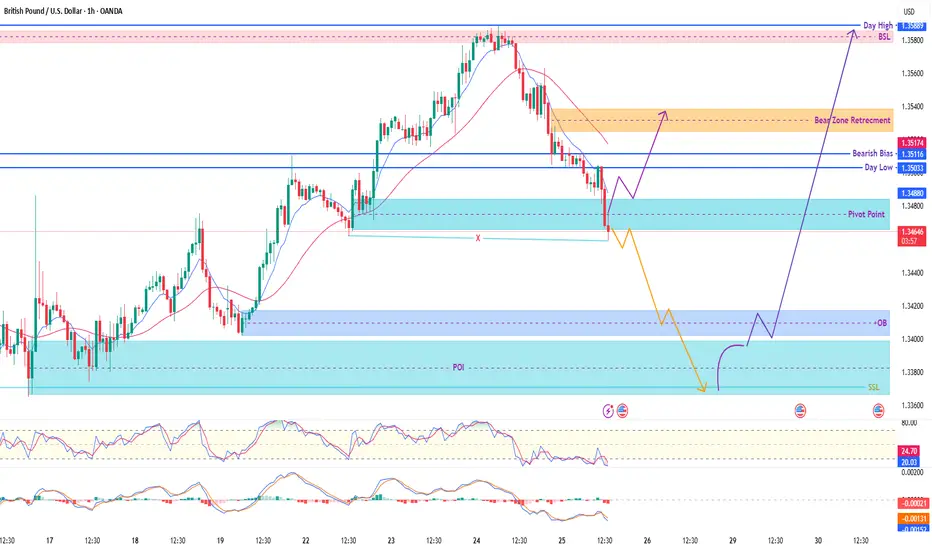
GBP/USD (1H) – SMC Outlook & Price Pathways🔍 Structure Overview:
Price has tapped into a key intraday demand zone (Pivot Point region) after a clean drop from the bearish breaker area. The market is at a critical decision point, and we’re watching for either a short-term retracement rally or a deeper liquidity hunt into the major POI below.
🧠 Key SMC Concepts Applied:
✅ Clean BOS (Break of Structure)
✅ Well-mapped OB zones (above & below)
✅ Liquidity Traps: SSL & BSL identified
✅ Bear Zone Retracement mapped for short-sellers
✅ RSI + MACD divergence signals are building quietly
📍 Key Zones on Chart:
🔴 Bearish Zone Retracement (Short Area): 1.3511 – 1.3517
🔵 Pivot Point / Minor Demand: 1.3480 – 1.3490
🟦 Deep POI: 1.3380 – 1.3400
🟩 Strong OB: 1.3365 – 1.3385
🟪 Day High/BSL Target: 1.3588
❌ SSL (Sell-Side Liquidity): ~1.3360
📈 Scenario A – Short-Term Bullish Reversal (Purple Path):
Price may bounce from the pivot zone
Target 1: Bear Zone (1.3515)
Target 2: BSL @ 1.3588
✅ Bias flips bullish if 1.3515 is cleanly broken
📉 Scenario B – Liquidity Sweep (Yellow Path):
If the current zone fails, watch for a drop into the deep OB / POI
Potential long from 1.3365 – 1.3385, targeting full bullish swing toward BSL 1.3588
🎯 Trade Example (Scenario B):
Buy Limit: 1.3375
SL: 1.3345
TP1: 1.3485
TP2: 1.3588
Risk-Reward: 1:3+
✅ Suggested Caption for TradingView:
GBP/USD (1H): Decision Point Active!
Price has reacted off a local demand near the pivot. Watching for bullish momentum to target 1.3515 → 1.3588. If price dips into the deeper POI below 1.3400, I’ll be looking for a liquidity sweep and reversal. RSI + MACD divergence are hinting at strength building.
🔹 This is educational content – not financial advice.
EURGBP Long Project1. Price Drivers: higher timeframe demand
2. Current Trend: up
3. Momentum: bullish
Action: Waiting for entry on the intraday timeframe (entry will be published further)
*Disclaimer: I will not accept liability for any loss or damage, including without limitation to any loss of profit, which may arise directly or indirectly from use of or reliance on such information.

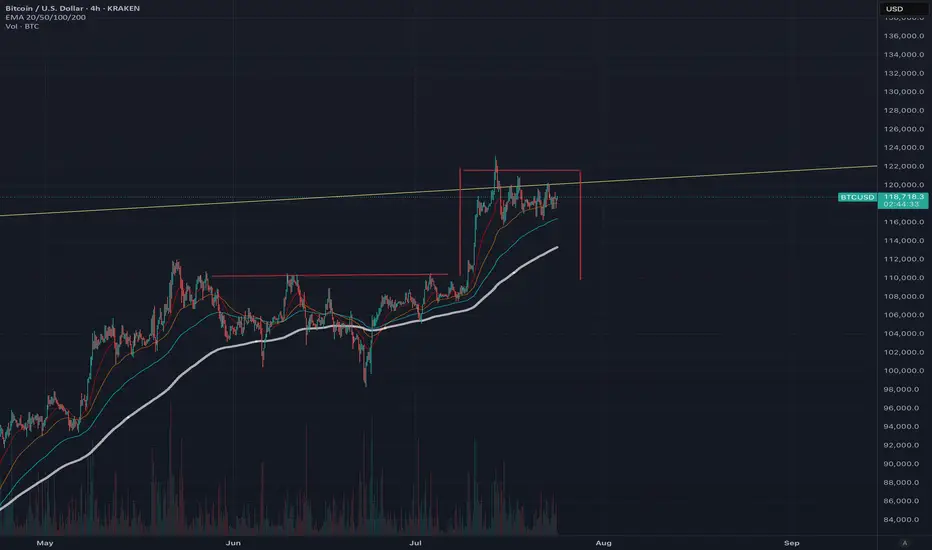
The sell trigger for Bitcoin is being activated.After breaking out of the channel and pulling back to the lower boundary (previous support) of the channel, we expect the price to decline.
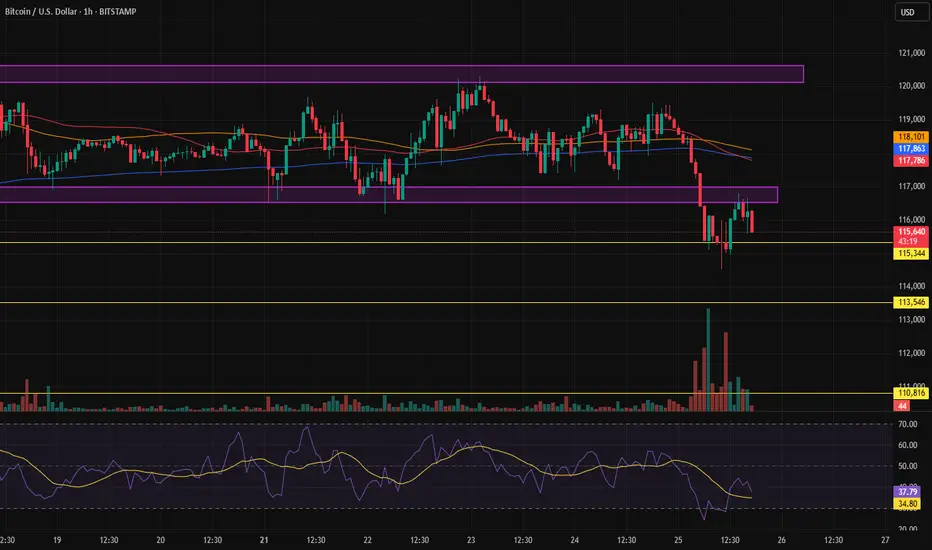
Bart Simpson Pattern Forming? We are in Greed? A possible Bart Simpson pattern is forming, which typically indicates a market top and reversal, with a retest of <$109,000 very likely. This pattern could also create a bearish head and shoulders formation, strongly suggesting a near-term top.
Trading volume continues to decrease, and ETF inflows are now negative, with an increasing volume of BTC on exchanges indicating that sell pressure is mounting. In this situation, a flash crash is also quite likely, so be cautious about where you place your limit sell orders and stop losses..
Both short and long positions are currently low, suggesting there is a lack of direction in the market, whether up or down. This situation often occurs at the end of a bull run. While a push upward is a possibility, based on my analysis, I anticipate that this pattern will break down with an 80:20 probability. However, Bitcoin often challenges expectations and is famously unpredictable. However due to all the media hype and the rolling of capital into Alt coins and the dominance dropping I do believe we are very near the end of the bull run. This is not financial advice (NFA).
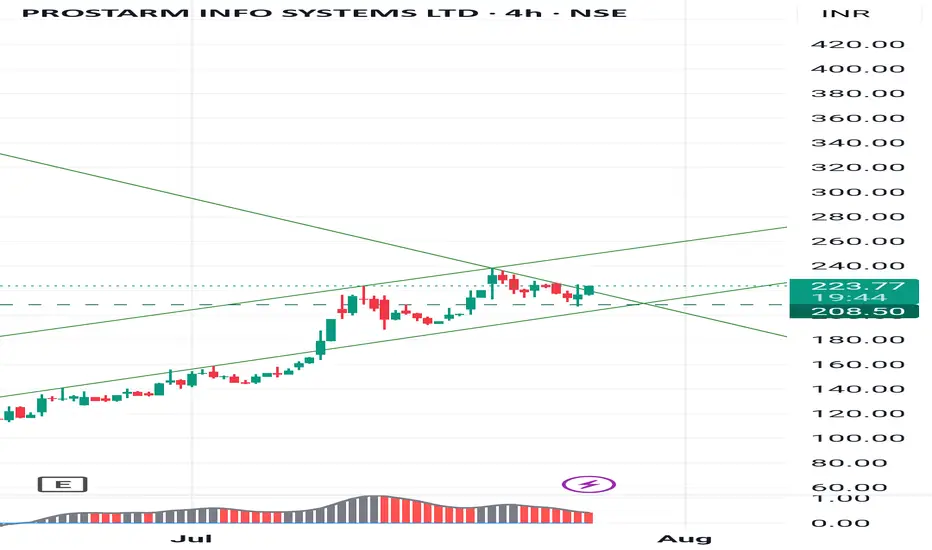
Prostarm : go long with support of 208There is a great move in Prostarm : go long with support of 208, enter 220-216. Stock is making higher high pattern which may result a upper side moves..
It may hit 230 in coming days.
Stay cautious with levels.
USD/JPY Robbery Route | Enter at Dip, Exit Before Police💥USD/JPY Forex Money Heist Plan 🎯 — Ninja Robbery at 146.000💥
🌟 Hi! Hola! Ola! Bonjour! Hallo! Marhaba! 🌟
Dear Market Bandits, Money Makers & Risky Robbers 🤑💰💸✈️
Welcome to another Thief Trader-style operation. We've cracked open the USD/JPY vault (aka "The Gopher" 💹), and here's the blueprint to pull off this forex heist like true professionals. 💼🎭💵
🚨 Strategy Overview
This isn't just a trade – it’s a well-researched, precision-timed robbery mission based on technicals, macro analysis, sentiment, and the bigger global picture.
Expect action near critical zones – especially the moving average barricade, where police (aka risk) is waiting. Stay sharp.
🔓 Entry Point – Unlock the Vault
📈 Watch for bullish pullbacks near 146.000.
Whether it's a dip, zone test, or wick bounce — you’re looking to layer buy limit orders like a seasoned thief using DCA tactics.
Enter on swings or any bullish confirmation.
Heist Window is Open.
🛑 Stop Loss – Escape Route
📍 SL near 143.000 (1D swing low) — adjust based on your capital and position size.
💡 Don’t go blind — SL is your backup plan, not an optional accessory.
Custom-fit it based on how many entries you’re stacking.
🎯 Target – Vault Exit Point
🏁 151.000 or exit before resistance heat catches on.
No greedy thieves here — precision exit is key.
Lock profits, vanish in style. 🕶️💼💸
🧲 Scalpers Take Note
Only long side raids are valid. Scalping against the trend? That's walking into a trap.
Use trailing SLs and protect your loot.
Small bag or big vault — play your game smart. 🎯💰
📢 Fundamental Boosters
USD/JPY’s bullish run isn’t random — it’s backed by:
📊 Macro shifts,
📈 COT reports,
🧠 Sentiment drivers,
📉 Intermarket trends,
And a whole mix of thief-level intel 🔍
🧭 Dive deeper before acting. The map’s been provided. 🔗🌍
🗞 News Traps Ahead – Move Cautiously
🚫 Avoid new trades during major releases
🔁 Use trailing SLs on open positions
💡 Position management is a thief’s best defense. Risk management keeps you in the game. 🎯🧠
🔥💖 Support the Heist Crew
Smash that ❤️🔥 Boost Button to keep our robbery engine running.
Each boost = strength for our crew.
💬 Share the love, spread the intel, and trade like a rogue with brains. 🤝💵
👀 Stay tuned for more high-profile FX heists from Thief Trader.
Until next time — loot wisely, vanish clean. 🐱👤💨

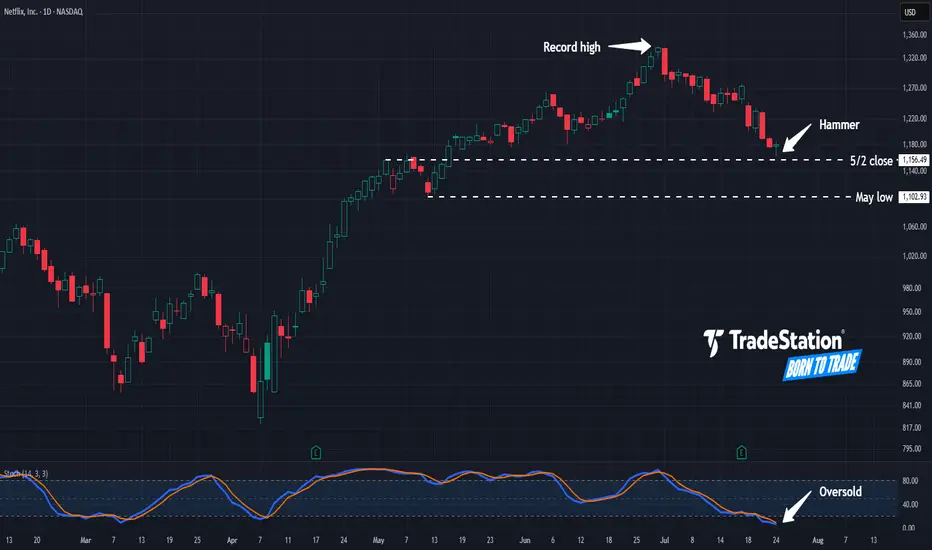
Hammer in NetflixNetflix has pulled back from record highs, and some traders may see potential opportunities in the streaming video giant.
The first pattern on today’s chart is the $1,156.49 level. It was a weekly close on May 2 and near the high the following week. NFLX is now showing signs of potential stabilization near that level. Is new support emerging?
Second, prices hit their lowest level in more than two months yesterday but rebounded. The resulting hammer candlestick pattern may be viewed as a bullish reversal pattern.
Third, stochastics have fallen to oversold territory.
Fourth, if the potential support at $1,156.49 breaks, traders may next eye the May low of $1,102.93.
TradeStation has, for decades, advanced the trading industry, providing access to stocks, options and futures. If you're born to trade, we could be for you. See our Overview for more.
Past performance, whether actual or indicated by historical tests of strategies, is no guarantee of future performance or success. There is a possibility that you may sustain a loss equal to or greater than your entire investment regardless of which asset class you trade (equities, options or futures); therefore, you should not invest or risk money that you cannot afford to lose. Online trading is not suitable for all investors. View the document titled Characteristics and Risks of Standardized Options at www.TradeStation.com . Before trading any asset class, customers must read the relevant risk disclosure statements on www.TradeStation.com . System access and trade placement and execution may be delayed or fail due to market volatility and volume, quote delays, system and software errors, Internet traffic, outages and other factors.
Securities and futures trading is offered to self-directed customers by TradeStation Securities, Inc., a broker-dealer registered with the Securities and Exchange Commission and a futures commission merchant licensed with the Commodity Futures Trading Commission). TradeStation Securities is a member of the Financial Industry Regulatory Authority, the National Futures Association, and a number of exchanges.
Options trading is not suitable for all investors. Your TradeStation Securities’ account application to trade options will be considered and approved or disapproved based on all relevant factors, including your trading experience. See www.TradeStation.com . Visit www.TradeStation.com for full details on the costs and fees associated with options.
Margin trading involves risks, and it is important that you fully understand those risks before trading on margin. The Margin Disclosure Statement outlines many of those risks, including that you can lose more funds than you deposit in your margin account; your brokerage firm can force the sale of securities in your account; your brokerage firm can sell your securities without contacting you; and you are not entitled to an extension of time on a margin call. Review the Margin Disclosure Statement at www.TradeStation.com .
TradeStation Securities, Inc. and TradeStation Technologies, Inc. are each wholly owned subsidiaries of TradeStation Group, Inc., both operating, and providing products and services, under the TradeStation brand and trademark. When applying for, or purchasing, accounts, subscriptions, products and services, it is important that you know which company you will be dealing with. Visit www.TradeStation.com for further important information explaining what this means.
ETHUSD: Road to 4K today after a breakout. ETH/USD – 4H Outlook: Targeting $4,000+
Ethereum is coiling within a descending wedge, signaling potential breakout momentum. Volume compression indicates that once ETH breaks above the wedge resistance (~$3,750), it could accelerate toward the $4,000–$4,050 supply zone.
Key Levels:
Resistance: $3,750 → $4,000
Support: $3,650 → $3,550
Breakout Target: $4,007 (mid-term)
VolanX Protocol Insight:
Institutional liquidity clusters sit above $3,800. A clean breakout with strong volume could trigger stop runs and a swift rally to 4K.
Risk Management:
Entry after breakout retest above $3,750.
Stop-loss: Below $3,640.
Take-profit: $3,980–$4,050.

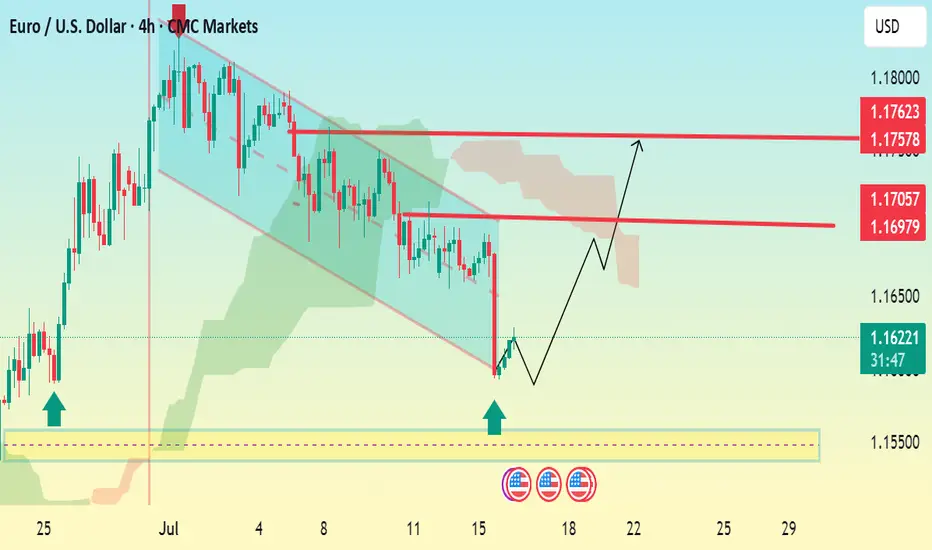
EUR/USD 4H Bullish Reversal Setup Analysis:The chart shows a falling wedge pattern, a typical bullish reversal signal.
Price has broken out of the wedge, suggesting a potential trend reversal to the upside.
Two strong demand zones (highlighted with blue arrows and yellow box) show strong buying pressure around 1.15500–1.15700.
The Ichimoku Cloud above indicates resistance, but a breakout above it would confirm continued bullish momentum.
Key Levels:
Current Price: 1.16171
Immediate Resistance: 1.16979
Next Targets (TP):
TP1: 1.17057
TP2: 1.17578
TP3: 1.17623
Support Zone: 1.15500 – 1.15700
Conclusion: If the price holds above the 1.15700 support zone and sustains momentum above the wedge breakout, expect bullish continuation toward 1.17500+. Ideal long setup on retracement with tight SL below 1.15500.