VOXELUSDT Forming Strong Bullish PotentialVOXELUSDT is currently exhibiting a highly promising setup with strong bullish potential, as shown in the latest price structure. The chart clearly displays a falling wedge formation, a pattern known for its bullish implications when confirmed with a breakout. VOXEL has recently broken out of this wedge with increased volume, suggesting a significant shift in momentum. Based on this breakout structure, an expected gain of 140% to 150%+ seems technically plausible in the upcoming sessions.
The token has demonstrated consistent accumulation in the lower price range, which often precedes sharp upward moves, especially in low-cap or mid-tier gaming/metaverse coins like VOXEL. With market participants increasingly shifting their attention toward undervalued gaming and metaverse projects, VOXEL is positioned to benefit from both technical and narrative-driven catalysts. The current market sentiment favors assets with solid technical foundations and growing community interest—both of which VOXEL currently exhibits.
Furthermore, the recent increase in trading volume reinforces the bullish scenario. Volume expansion post-breakout is typically a strong indicator of institutional or whale accumulation. Traders looking to capitalize on high-risk, high-reward setups should closely monitor VOXELUSDT for further confirmation candles and volume surges, which could signal the beginning of a parabolic run.
Given its current structure and historical price behavior, VOXEL may offer a rare opportunity for outsized returns if momentum continues. It is crucial, however, to manage risk and set realistic take-profit zones based on key resistance levels highlighted on the chart.
✅ Show your support by hitting the like button and
✅ Leaving a comment below! (What is You opinion about this Coin)
Your feedback and engagement keep me inspired to share more insightful market analysis with you!
Trend Analysis

LONG SILVERDirection: Bullish
Moving Average: Red above Blue
Pattern Impulse: Impulse correction
Fib Retracement: 38.2
MACD > 0
1st Target = 39.11
2nd Target = 39.87
RISK: Silver already making new highs

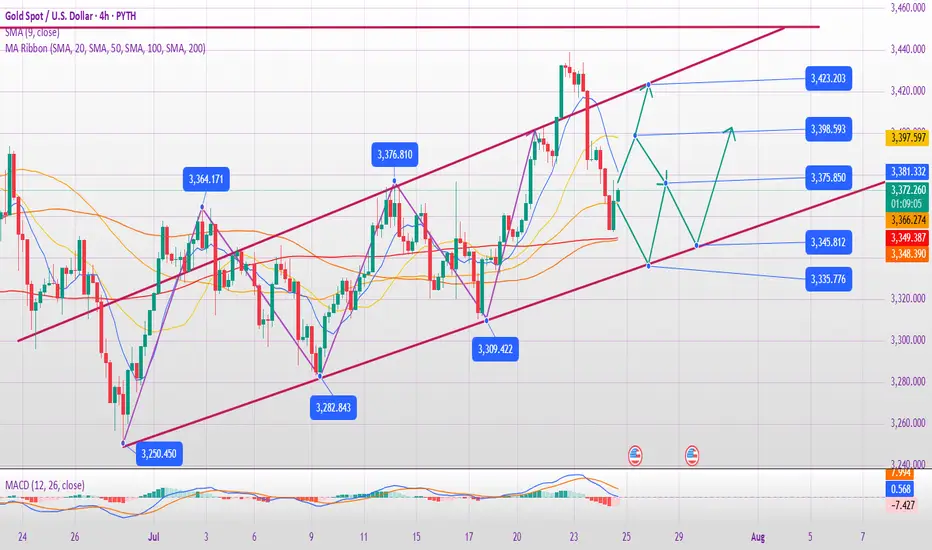
Will gold continue to fall on July 25?
1. Brief analysis of gold fundamentals
The current gold price is fluctuating downward, and the core driving factors are:
Risk aversion has cooled down:
The United States and Japan reached an agreement on automobile tariffs and promoted an agreement with the European Union, easing previous global trade tensions;
The overall risk appetite of the market has increased, and safe-haven funds have withdrawn from gold.
The US dollar rebounded in stages:
The US dollar index rebounded after the previous decline, which partially offset the safe-haven appeal of gold;
Although there are expectations of interest rate cuts within the Federal Reserve, there are large differences, and the overall trend is still "wait-and-see", which has increased the volatility of the US dollar trend.
2. Technical analysis of gold
Trend characteristics:
Gold has fallen from the high of 3438 and has been under pressure for two consecutive days;
It is currently testing the 0.618 retracement support (about 3360) of the 3310-3438 increase;
The European session continued to fall. If there is a rebound before the US session, there may be a risk of "false breakthrough and real decline";
If the US session still does not rise in the early session, it is necessary to pay attention to the possible V-shaped reversal in the future.
Technical indicators:
The short-term MACD bottom divergence gradually emerges, and the probability of oversold rebound correction increases;
Important support: 3350-3340 range (once lost, it may test the lower track of the 3337 daily triangle);
Key pressure: 3393-3403 range (initial rebound resistance), stronger resistance is around 3416-3418.
III. Short-term operation strategy suggestions
✅ Main idea: shorting on rebound is the main, and long on callback is the auxiliary
Short order layout reference:
If the 3393-3403 area encounters resistance, you can try to short with a light position;
Stop loss is set above 3410, and the target is 3360-3350;
If the market breaks through 3403 strongly and stabilizes, the short order strategy needs to be suspended.
Long position layout reference:
If it drops to 3350-3340 and stabilizes, you can try short-term long with a light position;
Stop loss is set below 3335, and the target is 3375-3385;
If the market quickly breaks below 3337, wait for the lower support to stabilize before intervening.
IV. Trend warning points
If the price does not rebound significantly before the early US market, it is necessary to guard against a sudden V-shaped pull after the US market;
If it directly falls below 3340, the space below opens, it is recommended to stop loss in time and wait for new support points.
✅ Conclusion:
In the short term, gold is still in the downward correction stage, but as the technical oversold signs appear, short-term sharp pull rebound should be guarded against. It is recommended to respond flexibly in operation, pay attention to the response of key support and resistance levels, and avoid chasing up and selling down.
CHFJPY Bullish Flag Breakout!
HI,Traders !
CHFJPY is trading in an
Uptrend and
Now breaking out of the
Bullish flag pattern so we
Are bullish biased now
And we will be expecting a
Further move up !
Comment and subscribe to help us grow !

NQ Range (07-23-25)The O/N slight lift back to Mid Level of range. The big Tweet regarding Japan, did show up after the close. Now we need to see how the Open Drive & Reg Session move today, may be snail lift higher 1st. The next bullish move would be F-M Long play. The selling just does not have much force or is part of the head fake prior to a decent drop test. Still Scalp Shorts to KL's and wait on some conviction selling to eventually show up.
GBPUSD BUYGBP/USD drops to 1.3450 area after weak UK Retail Sales data
GBP/USD continues to push lower after closing in negative territory on Thursday and trades near 1.3450 on Friday. Weaker-than-expected Retail Sales data from the UK and the broad-based US Dollar strength forces the pair to stay on the back foot heading into the weekend
GBP/USD came under bearish pressure on Thursday and lost more than 0.5%, snapping a three-day winning streak in the process. The pair extends its slide on Friday and trades below 1.3500.
The renewed US Dollar (USD) strength weighed on GBP/USD on Thursday. The US Department of Labor reported that the number of first-time applications for unemployment benefits declined to 217,000 in the week ending July 19 from 221,000 in the previous week. This reading came in better than the market expectation of 227,000. Additionally, the S&P Global Composite Purchasing Managers Index (PMI) improved to 54.6 (preliminary) in July from 52.9 in June, reflecting an ongoing expansion in the private sector's business activity, at an accelerating pace.
Meanwhile, the EUR/GBP cross rose more than 0.3% on Thursday as the Euro benefited from the European Central Bank's (ECB) cautious tone on policy-easing. EUR/GBP preserves its bullish momentum and trades at its highest level since early April above 0.8700 on Friday, suggesting that the Euro continues to capture capital outflows out of Pound Sterling.
Early Friday, the UK's Office for National Statistics reported that Retail Sales rose by 0.9% on a monthly basis in June. This reading followed the 2.8% decrease recorded in May but came in worse than the market expectation for an increase of 1.2%, making it difficult for GBP/USD to stage a rebound.
In the second half of the day, Durable Goods Orders data for June will be the only data featured in the US economic calendar. Nevertheless, this data is unlikely to have a long-lasting impact on the USD's valuation.
SUPPORT 1.34550
SUPPORT 1.34982
SUPPORT 1.35421
RESISTANCE 1.33990
RESISTANCE 1.33698


Ripple (XRP): Looking For Breakout and Smaller 10% PumpRipple coin has established some kind of local support zone, where we had a potential MSB to form but failed to break the area near $3.25.
Now price has cooled down and most likely will head again for another attempt to form the market structure break, so we are looking for a 10% gain right here.
Swallow Academy

I'm optymist. 1.183-1.185 In front us3 year channel saying that we should to touch it.
Yellow line.
Before us
In my opinion before us is level. 1.18-1.20 before bigger correction until 1.12 even.
Then in few month i see 1.4-1.6

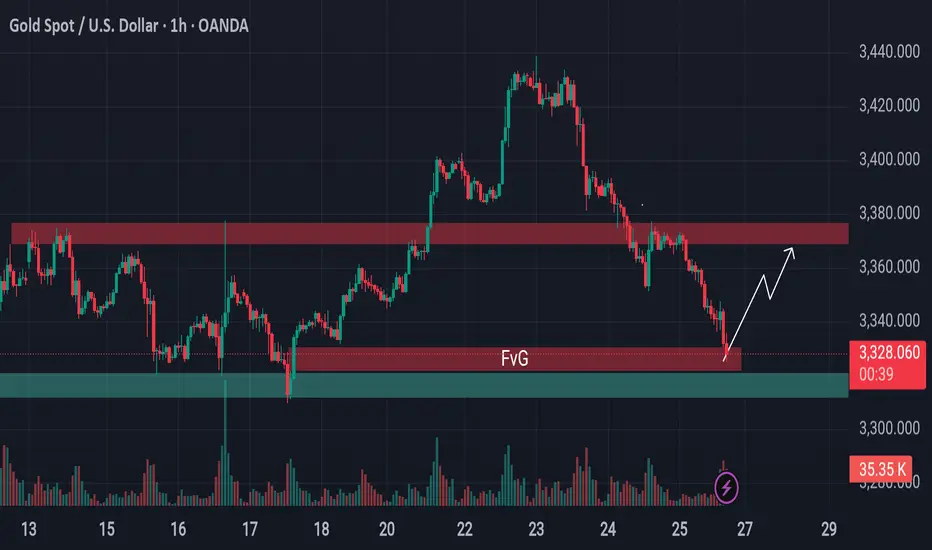
From Breakdown to Breakout? Gold Eyes Support Based Reversal!Gold is approaching a critical support area.
Previously, the price was holding above a key support level, but that zone has now been breached and is likely to act as resistance going forward. However, just beneath the current price, there's a well-established support level still intact—reinforced further by the presence of a bullish Fair Value Gap (FVG).
This setup hints at a possible reversal or a short-term surge from this zone. If market conditions align, gold may stage a pump from here. Keep this level on your radar—it could turn into a decisive point for price direction.
🛡 Always conduct your own analysis before taking any trades. DYOR.
XAUUSDLongterm gold os going to 5K
Midterm 3,500
Shorterm, we going to the bottom of the consolidation.

GOLD Drops $60 – Bearish Bias Holds Below 3365GOLD | OVERVIEW
As expected, gold continued its bearish momentum, dropping from the 3430 level and delivering a move of approximately $60.
For today, the bearish bias remains valid as long as the price stays below 3365, with potential targets at 3337 and 3320.
However, if the price reverses and stabilizes above 3365, it could signal a shift to bullish momentum.
Key Levels:
Support: 3355 · 3337 · 3320
Resistance: 3374 · 3388

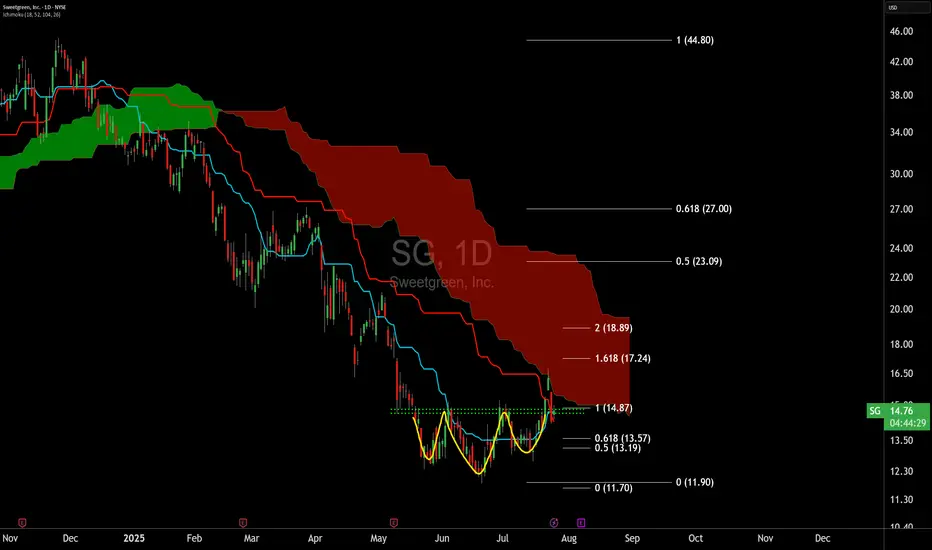
SG Approaching a Potential Trend ShiftPotential trend flip on the SweetGreen Chart for the first time since December 2024. I use a default doubled cloud on the daily timeframe 18/52/104/26. I find this to be superior to the default cloud on both backtesting and forward testing over the past decade on any chart.
Ideal bullish entry conditions occur on the cloud system when all four conditions are met:
Price above cloud
Bullish cloud
Bullish tenkan and kijun cross (TK)
Lagging span above price and above cloud (LS)
The doubled cloud settings are meant to decrease noise and increase signal, because of this I ignore the lagging span entirely and have never used the lagging span for entry criteria. We are approaching sufficient EARLY entry conditions was price enters the daily cloud.
Additionally, SG has one of the cleanest active inverted head and shoulders patterns in the market at the moment.
The target zone is merely based on the 50% retracement of high to low of the multi-month down trend, see: Dow Theory. Additional upside can be seen if the trend remains intact. Trailing stop losses via Williams Fractals and keeping an eye out for bearish divergences are both key to position management for this strategy.
Stop loss considerations for this idea is a combination of price below cloud and new lower lows., in this case below 13. Be mindful of a poor earnings result on Aug 7th could easily trip this SL level.
GOLD SELLGold price bears retain control amid fading safe-haven demand, rebounding USD
US President Donald Trump announced late Tuesday that his administration had reached a trade deal with Japan. Furthermore, reports that the US and the European Union are heading towards a 15% trade deal boost investors' confidence and weigh on the safe-haven Gold price for the second straight day on Thursday.
The markets do not expect an interest rate cut from the US Federal Reserve in July despite Trump's continuous push for lower borrowing costs. In fact, Trump has been attacking Fed Chair Jerome Powell personally over his stance on holding rates and repeatedly calling for the central bank chief's resignation.
Moreover, Fed Governor Chris Waller and Trump appointee Vice Chair for Supervision Michelle Bowman have advocated a rate reduction as soon as the next policy meeting on July 30. This keeps the US Dollar depressed near a two-and-a-half-week low and could offer some support to the non-yielding yellow metal.
Traders now look forward to the release of flash PMIs, which would provide a fresh insight into the global economic health and influence the safe-haven commodity. Apart from this, the crucial European Central Bank policy decision might infuse some volatility in the markets and drive the XAU/USD pair.
Meanwhile, the US economic docket features Weekly Initial Jobless Claims and New Home Sales data, which, in turn, would drive the USD and contribute to producing short-term trading opportunities around the commodity. Nevertheless, the fundamental backdrop warrants caution for aggressive traders.
SUPPORT 3,346
SUPPORT 3,322
SUPPORT 3,399
RESISTANCE 3,394
RESISTANCE 3,379
BankNifty levels - Jul 28, 2025Utilizing the support and resistance levels of BankNifty, along with the 5-minute timeframe candlesticks and VWAP, can enhance the precision of trade entries and exits on or near these levels. It is crucial to recognize that these levels are not static, and they undergo alterations as market dynamics evolve.
The dashed lines on the chart indicate the reaction levels, serving as additional points of significance. Furthermore, take note of the response at the levels of the High, Low, and Close values from the day prior.
We trust that this information proves valuable to you.
* If you found the idea appealing, kindly tap the Boost icon located below the chart. We encourage you to share your thoughts and comments regarding it.
Wishing you successful trading endeavors!

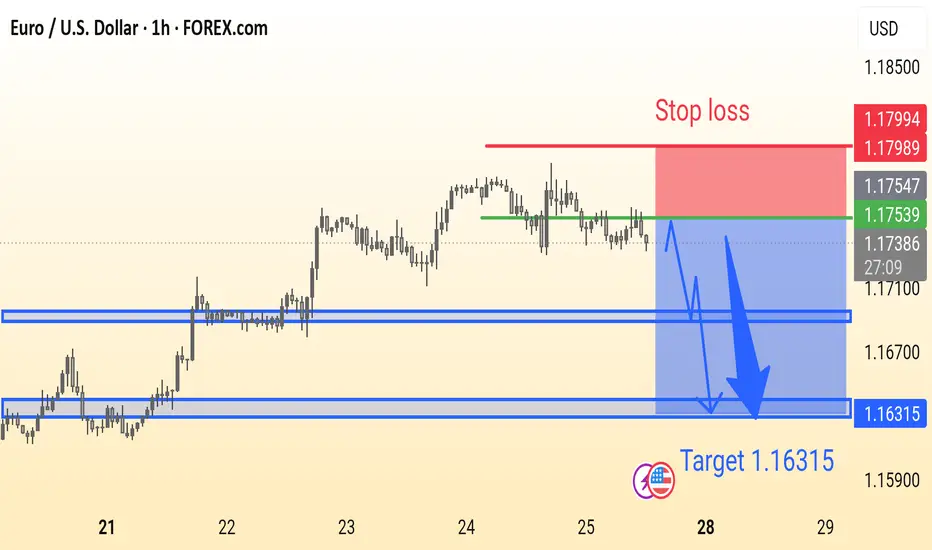
EURUSD Analysis is ReadyEUR/USD Trade Idea (1H Chart):
Price is ranging below resistance with a potential bearish breakout. Suggested Sell near 1.1753 with Stop Loss at 1.1799 and Target at 1.16315. Strong support zones marked for possible reaction.
XAUUSD Bearish from bearish ob need new breakdown from side line📊XAUUSD 1D Forecast
Gold is currently showing bearish signs after reacting from the order block level at 3450.
Now trading around 3355, which is near the sideways resistance zone.
We're watching for confirmation before entering — targeting entry near 3350.
📌Key Levels to Watch:
Resistance Zone: 3355 (current price)
Entry Zone: 3350 (with confirmation)
Next Demand Zone: 3250 (major level)
Support Level: 3180
Strategy:
Waiting for a strong bearish 4H candle to confirm momentum.
Only then we’ll consider short entries from 3350 zone.
Patience is key. No confirmation = no trade.
📊 #XAUUSD #Gold

EURJPY Q3 | D25 | W30 | Y25📊 EURJPY Q3 | D25 | W30 | Y25
Daily Forecast🔍📅
Here’s a short diagnosis of the current chart setup 🧠📈
Higher time frame order blocks have been identified — these are our patient points of interest 🎯🧭.
It’s crucial to wait for a confirmed break of structure 🧱✅ before forming a directional bias.
This keeps us disciplined and aligned with what price action is truly telling us.
📈 Risk Management Protocols
🔑 Core principles:
Max 1% risk per trade
Only execute at pre-identified levels
Use alerts, not emotion
Stick to your RR plan — minimum 1:2
🧠 You’re not paid for how many trades you take, you’re paid for how well you manage risk.
🧠 Weekly FRGNT Insight
"Trade what the market gives, not what your ego wants."
Stay mechanical. Stay focused. Let the probabilities work.
FRGNT
OANDA:EURJPY

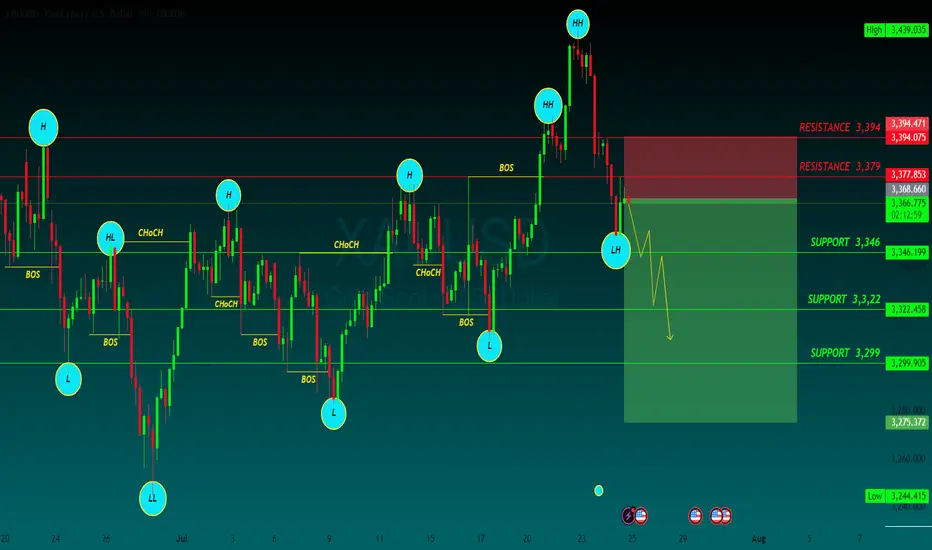
#3,377.80 Resistance remains strongMy position: I have Bought Gold many times above #3,400.80 benchmark however as it got invalidated, I Bought #3,390.80 again late U.S. session and closed my set of Buying orders on #3,395.80 nearby extension. I left one runner (#3,390.80 entry point) with Stop on breakeven expecting Asian session to recover #3,400.80 benchmark, however it was closed on break-even as Gold extended Selling sequence. I will continue Selling every High's on Gold and if #3,357.80 gives away, expect #3,352.80 and #3,342.80 contact points to be met.
As expected Gold delivered excellent #3,372.80 and especially #3,365.80 - #3,352.80 Selling opportunities throughout yesterday's session which I utilized to it's maximum. I have also Bought Gold on late U.S. session with #3,372.80 as an entry point / however since Gold was ranging, I closed my order on break-even and met Gold below #3,352.80 benchmark this morning personally on my surprise (I did expected #3,377.80 to be invalidated to the upside).
Technical analysis: Gold’s Price-action is performing well below both the Hourly 4 chart’s and Daily chart’s Resistance zones for the cycle. Selling direction of today’s session is directly correlated with Fundamentals leaving the scene which found Sellers near the Intra-day #3,377.80 Resistance and most likely DX will close the Trading week in green, however struggling to make Bullish comeback and if #3,327.80 - #3,342.80 reverses the Selling motion, Gold’s Daily chart’s healthy Technicals which preserved core uptrend values. If the Price-action gets rejected at #3,352.80 - #3,357.80 Resistance zone, then further decline (under conditions where I will have more information with U.S.’s session candle) is possible and cannot be ruled out. Notice that at the same time and manner, Bond Yields are on consecutive Selling spree as well which Fundamentally has a diagonal correlation with Gold. The slightest uptrend continuation there, should add enormous Selling pressure on Gold.
My position: I am Highly satisfied with recent results and will take early weekend break (no need to Trade more). If however you decide to Trade today, Sell every High's on Gold / no Buying until Monday's session (my practical suggestion).

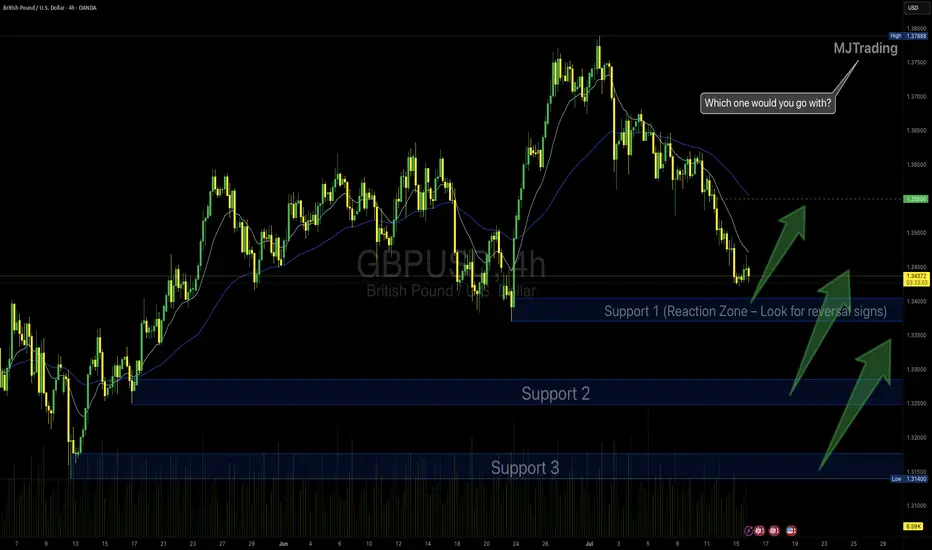
GBPUSD Idea – Demand Zones & Potential Reversal Play🧠 MJTrading:
After a steady downtrend, GBPUSD is now approaching a strong 4H demand zone (Support 1), where we previously saw explosive bullish reactions.
Price is also extended from both EMAs, showing potential for a technical pullback or full reversal.
💡Scenarios to consider:
🔹 If Support 1 holds → we may see a bounce toward 1.3500+
🔹 If broken → Support 2 & 3 offer deeper liquidity and high-probability demand zones
👀 Watch for:
Bullish reversal candles (engulfing / hammer)
Bullish divergence on lower timeframes
Volume spikes on reaction
⚠️ Invalidation:
If Support 3 breaks with strong momentum, we might enter a bearish continuation phase.
#GBPUSD #Forex #ChartDesigner #SmartMoney #PriceAction #MJTrading #ForexSetup #TrendReversal #SupportZones
Potentian BUY gold again...I found the best location to buy gold again, will gold make ATH, or will it just return to testing the order block above which is still fresh??

GALA. USDTGala is an American cryptocurrency based on Ethereum (ERC-20).
The limited number of Gala tokens is another factor that can contribute to the growth of Gala, and Gala dynamics have proven this many times.
But, the best strategy is to buy gradually.
