Bitcoin: The Key Buying Level Near $112K Liquidity ZoneFenzoFx—Bitcoin consolidation extended into the bullish FVG, trading near $115,470.0. The 4-hour chart shows an indecisive candle, while the 200-day MA points upward, signaling bullish control.
The bullish outlook remains intact if price holds above the critical $112,000.0 support. However, current bearish momentum may drag price toward this level, potentially filling nearby FVGs.
Traders should monitor $112,000.0 for bullish setups, including break of structure and long-wick bullish candles.
Trend Analysis


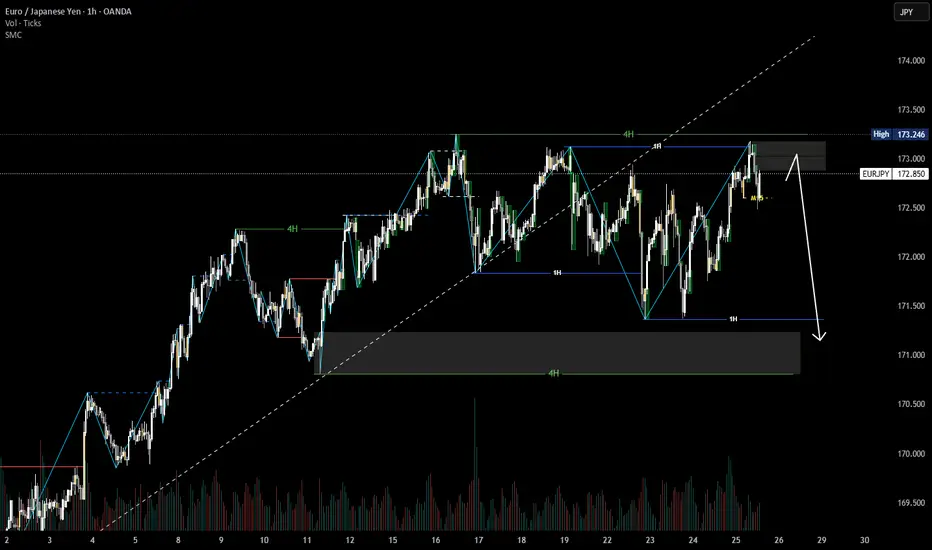
EURJPY Market Structure Analysis on 1H, 4H Timeframe4H timeframe is bullish.
1H timeframe is bearish
Price is currently clearing the top of 1H timeframe so there is a high chance that price will continue to fall to the Demand zone of 4H timeframe.
Debt markets at a point of complacency see green arrowsJunk bonds are at a dangerous level now of complacency. I would buy TLT sell HYG

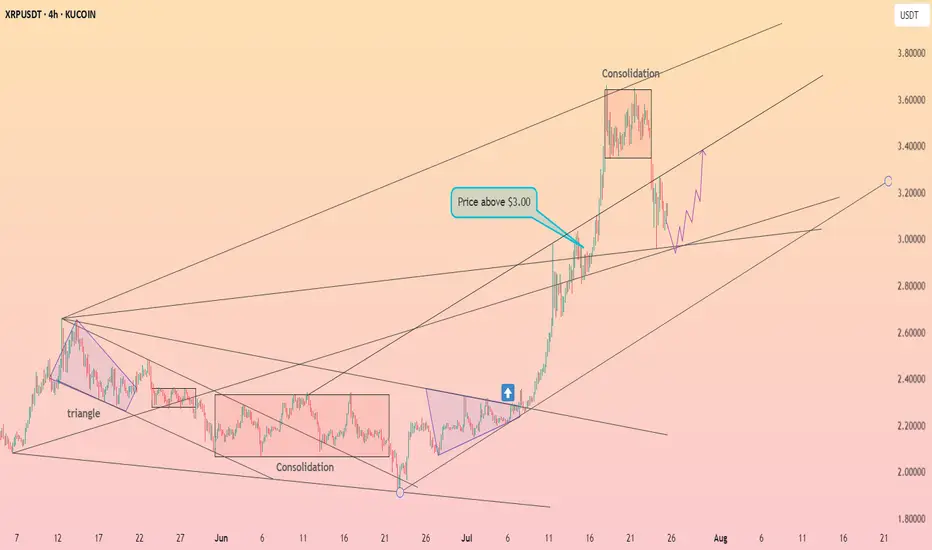
XRP stays above $3 ┆ HolderStatBYBIT:XRPUSDT is printing higher lows into the $3.44 resistance. Breakout could activate $3.60 target. Watch $3.30–$3.28 for possible pullbacks. Bullish pressure mounting.
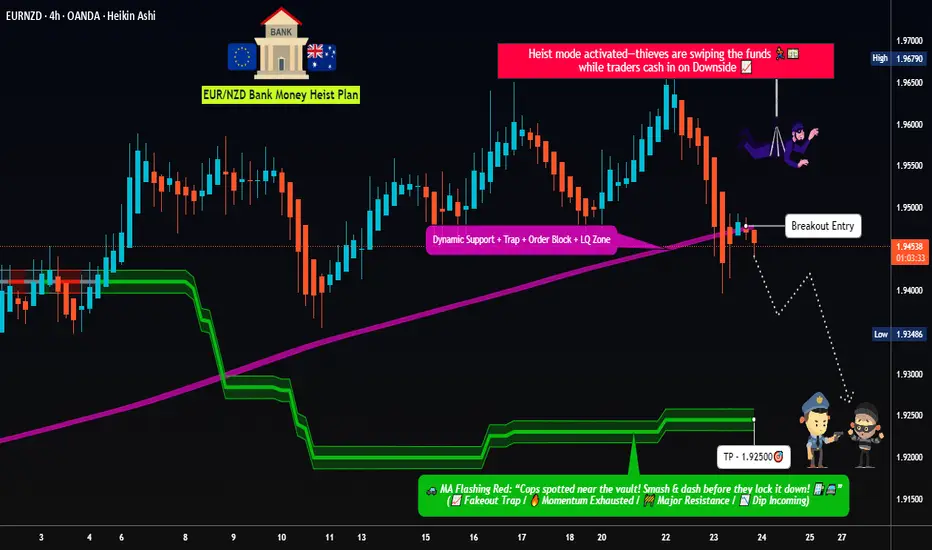
Dynamic Entry Alert – EUR/NZD Bearish Heist Execution!💣 EUR/NZD Robbery Blueprint: The Kiwi Vault Bearish Heist Plan 💰🕵️♂️
🌟Hi! Hola! Ola! Bonjour! Hallo! Marhaba!🌟
Dear Money Makers & Robbers, 🤑💰✈️
This ain't your usual trading tip — it’s a Thief Trading Masterstroke 🎯. We're gearing up for a high-stakes heist on the EUR/NZD forex market. Time to crack open the Kiwi vault and rob those bullish bandits blind! 😼💣
🧠 Strategic Mindset:
🔍 We're targeting the oversold consolidation zone. Bullish traders think they’re safe? Think again. This area is a trap — the perfect bait for our bearish ambush. Expect trend reversal vibes, layered with juicy liquidity grabs.
🕵️♂️ Entry Plan:
🎯 Sell Entry Trigger: Wait for a clean break below 1.94500.
💣 Setup:
Place Sell Stop Orders below the MA Support Breakout
Or... go stealth: Sell Limit Orders at nearest swing highs (15m or 30m timeframe)
Use DCA / Layering Method for multiple entries (scalp or swing tactics)
📌 Set your Alert 🚨 — no breakout, no entry. Patience pays.
🛑 Stop Loss Strategy (SL):
No premature moves! Don’t place that SL till we get the confirmed break.
🔥 SL Recommendation:
Just above 1.95700 (4H candle wick swing high)
Adjust based on lot size and number of layers
📍 Remember, the market’s a jungle — stay sharp or get sliced.
🎯 Take Profit (TP):
💵 Target Zone: 1.92500
(But hey, escape early if the vault starts shaking. Protect your gains like a pro.)
📊 Macro Intel – Why This Works:
This isn’t random — it's backed by our 🔥 combo of:
COT Reports
Sentiment Analysis
Quant/Algo Bias
Intermarket Correlation
Fundamental + Technical Confirmation
📌 You can dig deeper — but trust me, this setup’s been scouted like a pro job.
⚠️ Risk Protocols:
Avoid entries during high-impact news
Use Trailing SLs to lock in the loot
Adjust position size to suit your personal bankroll & risk appetite
🔥 Final Word from the Thief:
Smash that 💥Boost Button💥 if you're vibing with the heist plan!
Support the squad, stay profitable, and rob the market — legally, of course.
We don’t trade, we infiltrate.
We don’t predict, we execute.
📡 Stay tuned… More robbery blueprints coming soon!
🤑🐱👤🚨💸💪 #ThiefTrader #ForexHeist #EURNZDShortPlan
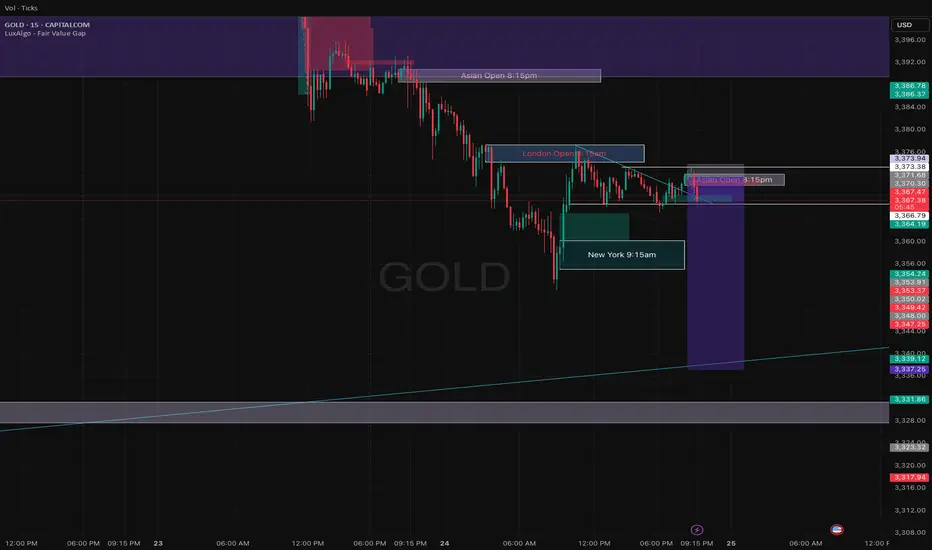
Gold Analysis and Trading Strategy | July 25✅ Fundamental Analysis:
🔹 Political Pressure on the Federal Reserve Increases Safe-Haven Demand
President Trump made a rare visit to the Federal Reserve, pressuring it to cut interest rates. At the same time, his political allies filed a lawsuit against Fed Chair Jerome Powell, demanding a public meeting. These events have raised concerns over the Fed’s independence and the outlook for U.S. monetary policy, increasing long-term uncertainty. This serves as a medium- to long-term bullish factor for safe-haven assets like gold.
🔹 Rising Geopolitical Tensions Fuel Safe-Haven Demand
The U.S. has withdrawn from the Doha ceasefire negotiations, accusing Hamas of insincerity. Meanwhile, military tensions between Thailand and Cambodia have escalated, with cross-border clashes intensifying. Should the conflict broaden, safe-haven buying of gold could be triggered, further supporting prices.
✅ Technical Analysis:
🔸 On the daily chart, gold has closed lower for two consecutive sessions, forming a “two black crows” pattern—an indication that bearish momentum is gradually taking control and market sentiment is turning pessimistic. Although a short-term consolidation or rebound is possible, the broader trend remains bearish.
🔸 The $3340 level on the daily chart is a key support zone. It marks not only a crucial dividing line for the previous uptrend but also a critical battleground for bulls and bears. If this level holds, a technical rebound could follow; if it breaks, gold may continue its decline toward the $3310 area.
🔴 Resistance Levels: 3373–3375 / 3382–3390
🟢 Support Levels: 3340–3335 / 3330–3310
✅ Trading Strategy Reference:
🔻 Short Position Strategy:
🔰Consider entering short positions in batches if gold rebounds to the 3365-3370 area. Target: 3355-3345;If support breaks, the move may extend to 3340.
🔺 Long Position Strategy:
🔰Consider entering long positions in batches if gold pulls back to the 3335-3340 area. Target: 3365-3375;If resistance breaks, the move may extend to 3380.
🔥Trading Reminder: Trading strategies are time-sensitive, and market conditions can change rapidly. Please adjust your trading plan based on real-time market conditions. If you have any questions or need one-on-one guidance, feel free to contact me🤝

Binance coin has dropped from $800 ┆ HolderStatBINANCE:BNBUSDT surged from $532 support and is now battling $550 resistance. A daily close above $550 opens upside targets near $567. Rejection may drag price back into the $532–$537 range. Bias remains bullish while inside the current trend channel.

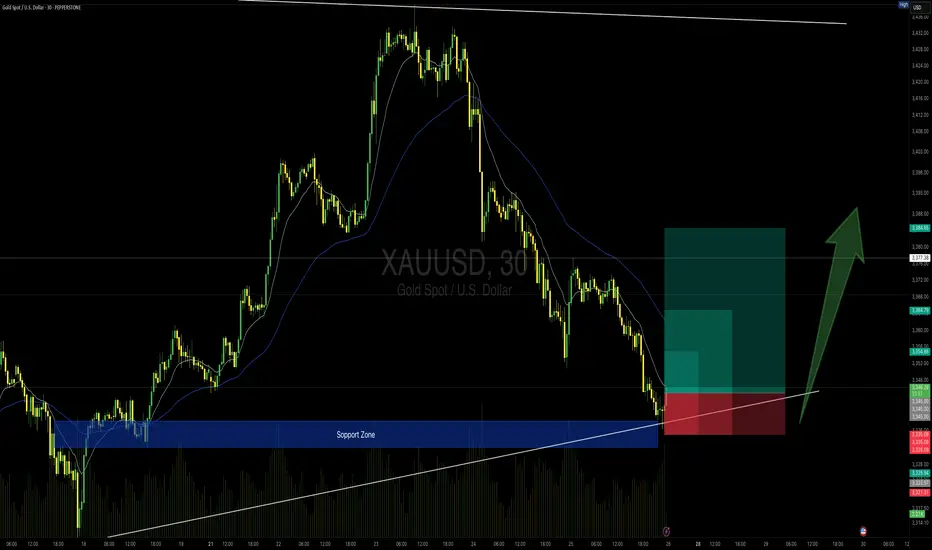
GOLD 30min Buy Setup (High Risk - High Reward)📍 TVC:GOLD 30min Buy Setup – MJTrading View
After an extended bearish leg, price has tapped into a strong support zone that previously acted as a launchpad. Also touching the main Uptrend...
We now see initial signs of absorption with potential reversal setup forming just above the ascending trendline.
🔹 Entry Zone: 3344–3346
🔹 SL: Below 3335 (under structure & wick base)
🔹 TP1: 3355
🔹 TP2: 3365
🔹 TP4: 3385+ (if momentum sustains)
🔸 RR: Up to 1:4 depending on target selected
🧠 Context:
– Still inside broader bullish structure (macro HL)
– Support zone coincides with rising trendline
– Potential for bullish reaccumulation after sharp drop
– Volume spike near zone suggests active buyers
Stay sharp and manage your risk please...
See the below Idea for full concept:
"Support isn't just a level — it’s a battlefield. If buyers win, they don’t look back."
#MJTrading #Gold #BuySetup #PriceAction #SmartMoney #ChartDesigner #ReversalSetup #MarketStructure
Psychology Always Matters:
Gold XAUUSD Sell in trendline completion stageGold XAUUSD Sell in trendline completion stage - short term trade. now in 4th touch. bounce back to test previous level testing and return back to support again and it will break to test the sellers.

CHECK BTCUSD SIGNAL UPDATE GO AND READ CAPTAINEntry Point: Around 116100 TO 115750
Take Profit 1: 117600
Take Profit 2: 119150
Last Target: 171.200
Stop Loss: 114100

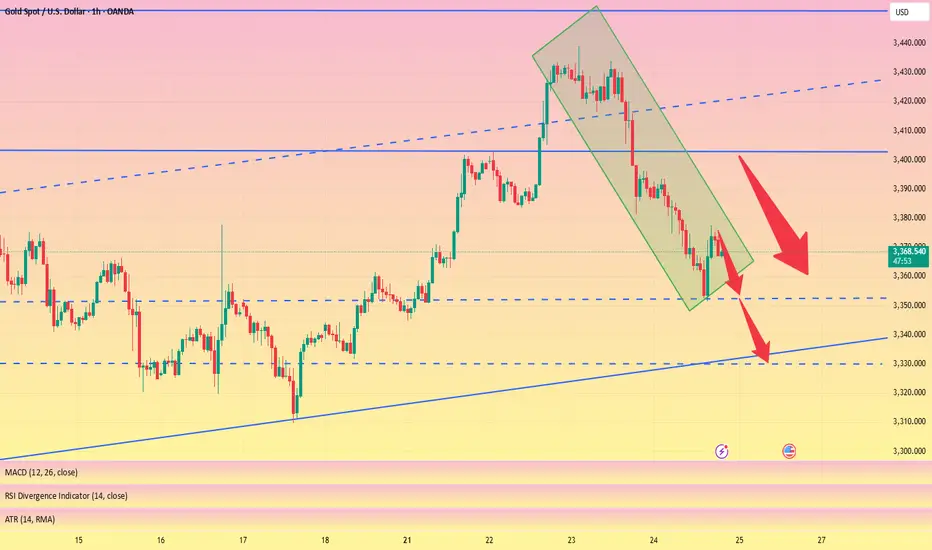
Gold testing SIGNIFICANT DAILY TRENDLINEGold is testing a key ascending trendline support around 3,340. If price holds this level, we could see a strong bullish reaction targeting 3,367 and potentially 3,400+. A break below 3,328 invalidates this setup.”

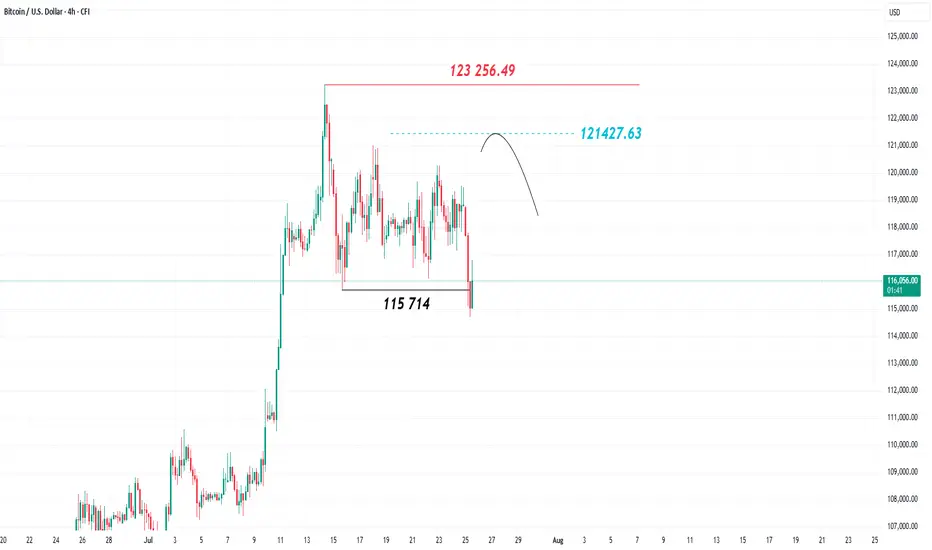
What's next for BITCOIN?After hitting a new all-time high at 123,256.49, Bitcoin, the world’s leading cryptocurrency, pulled back this week, closing on the 4-hour chart below the 115,714 level. This indicates a shift in trend from bullish to bearish and increases the likelihood of a short-to-medium-term decline.
The recent price rise appears to be corrective, and the 121,427 level is considered important and carries downside pressure, as it represents the 78% level of the Fibonacci retracement tool when measured from the recent high to the latest low. Holding below the 123,256 mark and failing to break above it would support the bearish scenario for Bitcoin.
CHECK EURJPY SIGNAL UPDATE GO AND READ CAPTAINEntry Point: Around 173.350 TO 173.200
Take Profit 1: 172.600
Take Profit 2: 171.900
Last Target: 171.200
Stop Loss: 173.900

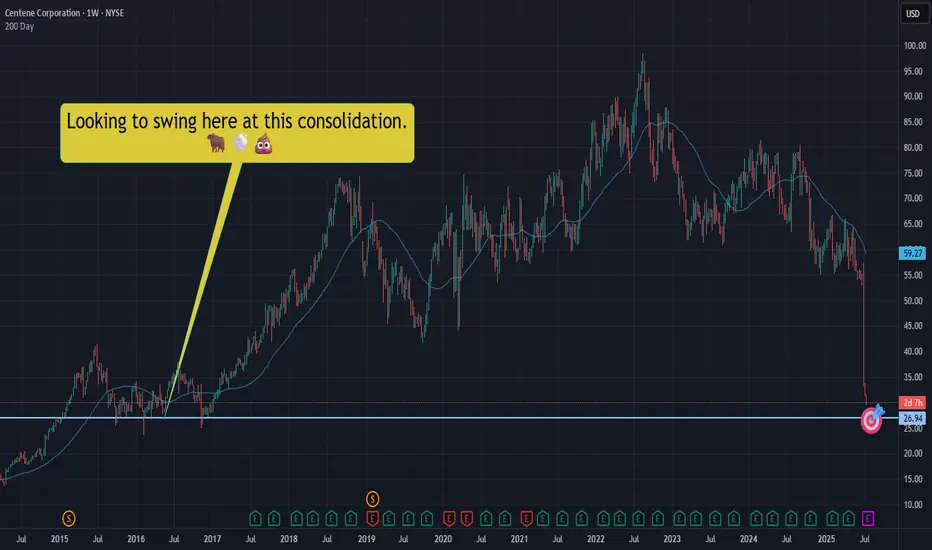
CNC|Let's take a swing at a falling dagger! NYSE:CNC slicing through the void, well.... like a falling dagger through a void.
Not trying to catch this bad boi, but we should expect a bounce at some point. Let's swing for a bounce in that $26.90ish area.
This is NOT a YOLO and I hope it's not an "oh no!" Let's keep our wits about us - starter position only. We can add if we need to, but let's just hope we sell and make some quick Christmas money.
THANK YOU FOR YOUR ATTENTION ON THIS MATTER
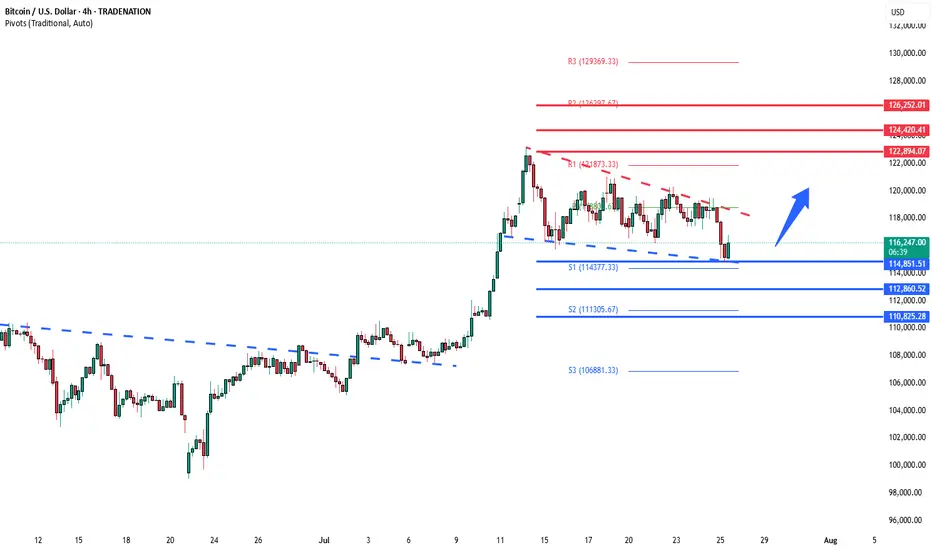
BTCUSD support retest at 114,850 The BTCUSD remains in a bullish trend, with recent price action showing signs of a corrective pullback within the broader uptrend.
Support Zone: 114,850 – a key level from previous consolidation. Price is currently testing or approaching this level.
A bullish rebound from 114,850 would confirm ongoing upside momentum, with potential targets at:
122,900 – initial resistance
124,420 – psychological and structural level
126,250 – extended resistance on the longer-term chart
Bearish Scenario:
A confirmed break and daily close below 114,850 would weaken the bullish outlook and suggest deeper downside risk toward:
112,860 – minor support
110,825 – stronger support and potential demand zone
Outlook:
Bullish bias remains intact while the BTCUSD holds above 114,850. A sustained break below this level could shift momentum to the downside in the short term.
This communication is for informational purposes only and should not be viewed as any form of recommendation as to a particular course of action or as investment advice. It is not intended as an offer or solicitation for the purchase or sale of any financial instrument or as an official confirmation of any transaction. Opinions, estimates and assumptions expressed herein are made as of the date of this communication and are subject to change without notice. This communication has been prepared based upon information, including market prices, data and other information, believed to be reliable; however, Trade Nation does not warrant its completeness or accuracy. All market prices and market data contained in or attached to this communication are indicative and subject to change without notice.
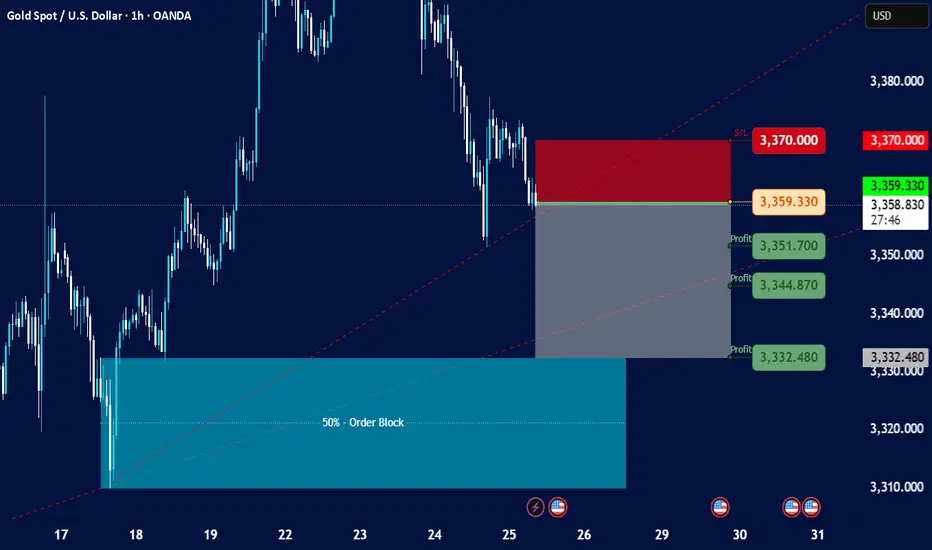
Gold Spot / U.S. Dollar - 1h on TradingView, dated July 25, 202Current Price and Trend:
The current price is shown as 3,359.330, and the last traded price is 3,359.005.
The chart indicates a downtrend in recent sessions, with the price having fallen significantly from higher levels around 3,380.000 to 3,390.000 down to the current levels.
There's a dashed red line (possibly a trendline or resistance) indicating a downward slope.
Key Zones and Levels Identified:
Resistance/Stop Loss Zone (Red Rectangle):
This zone is marked from approximately 3,365.000 up to 3,370.000.
A "S/L" (Stop Loss) level is explicitly marked at 3,370.000. This suggests that a short position (selling) is being considered, with a stop loss placed above this resistance.
Entry Point (Grey Line):
An entry point for a trade is indicated by a grey horizontal line at 3,359.330. This is very close to the current price, suggesting a potential entry for a short trade.
Profit Target Zones (Grey Rectangle with Green Labels):
Three "Profit" levels are identified below the entry point:
3,351.700
3,344.870
3,332.480
These levels suggest potential targets for taking profit on a short position. The grey shaded rectangle represents the area where these profit targets lie, extending downwards from the entry point.
50% - Order Block (Teal Rectangle):
At the bottom left of the chart, there's a large teal-colored rectangle labeled "50% - Order Block."
This typically represents an area where significant institutional buying interest (or an accumulation of orders) is expected, potentially acting as strong support. The price has previously bounced off this area.
Possible Trading Strategy Implied:
The setup suggests a potential short-selling strategy for Gold Spot / USD, likely based on a continuation of the downtrend or a retest of previous resistance levels.
Entry: Around 3,359.330 (current price level).
Stop Loss: At or above 3,370.000, to limit potential losses if the price moves against the short position.
Take Profit: Phased profit-taking at 3,351.700, 3,344.870, and 3,332.480.
Target Support: The ultimate target appears to be within the "50% - Order Block" zone, suggesting the expectation of the price reaching or testing this strong support area.
Considerations and Further Analysis Needed:
Confirmation: The chart doesn't show any specific indicators (e.g., RSI, MACD) that might confirm the downtrend or potential entry.
Volume: Volume analysis would be beneficial to assess the strength of price movements.
News/Fundamentals: Any upcoming economic data or geopolitical events could significantly impact gold prices.
Risk-Reward Ratio: A calculation of the risk-reward for each profit target would be useful to determine the attractiveness of the trade.
Market Structure: A deeper analysis of the market structure (higher highs/lows, lower highs/lows) could provide more context.
Gold Outlook for Today Todays outlook for Gold - I really cant share my strategy, if you want it, just send me a message and I will, It very simple, I think trading is simple, we just over think and complicate things
AUDUSD Engineered to Drop?🧠MJTrading:
📸 Viewing Tip:
🛠️ Some layout elements may shift depending on your screen size.
🔗 View the fixed high-resolution chart here:
🔻 OANDA:AUDUSD – Tagged the Top | Smart Money Eyes Lower Levels??
📍 Perfect Respect of Channel Structure
AUDUSD has just kissed the upper boundary of a long-standing ascending channel, showing sharp rejection — a sign that premium pricing might now shift toward discount levels.
📈 The aggressive push into the highs likely aimed to clear buy stops — fulfilling smart money objectives before a potential reversal.
📉 And here’s the subtle clue:
Just below the last bullish candle lies a thin slide — a structural weakness.
If price breaks and closes below that full body bearish candle (Below 0.66000), the market could slip fast, unleashing a momentum-driven drop into the first liquidity zone (0.6520s).
🧠 For smart money lovers, this is the classic:
Sweep → Trap → Slide
📏 And for fans of parallelism, the chart’s geometry offers a rare beauty — lines in harmony, structure in rhythm, and opportunity in alignment.
🔍 What to Watch For:
Break below 0.66000 (last candle body) = entry signal
0.6520–0.6540: first liquidity zone
0.6400–0.6300: deeper cleanout, if bearish pressure sustains
Inset: DXY bouncing from long-term demand supports bearish thesis
Manage your risk wisely...
For Lower time frame traders:
Psychology Always Matters:
(Click on the pictures for caption and concepts)
#AUDUSD #SmartMoney #LiquiditySweep #ChannelTrading #ChartDesigner #MJTrading #PriceAction #Forex

eurusd sell tradeThe Relative Strength Index (RSI) is showing a downward trend, indicating weakening momentum. Additionally, the Moving Average Convergence Divergence (MACD) is showing a bearish crossover, further supporting the potential for a downward move

USD/JPY Technical Analysis - 4h Chart (Jul 24, 2025)
Key Observations:
Price Action (4h Close):
Open (O): 146.545
High (H): 146.660
Low (L): 146.448
Close (C): 146.473
Change: -0.036 (-0.028%) → Slight bearish momentum.
50% - Order Block:
Indicates a key retracement level where institutional traders may have placed orders.
Current price near 146.473 suggests potential consolidation or reversal if this level holds.
Profit Levels (Potential Targets):
Bullish Scenario (if USD strengthens):
147.170 → Minor resistance
147.956 → Stronger resistance
148.637 & 150.140 → Major upside targets
Bearish Scenario (if JPY strengthens):
146.450 → Immediate support
145.780 → Next key support
Context:
August Seasonal Trend: JPY often sees volatility in August due to fiscal flows and BoJ policy expectations.
Trading View Indicator: Likely referencing a custom strategy (e.g., breakout/mean reversion).
Trading Bias:
Neutral to Slightly Bearish (price closed below open, testing mid-range levels).
Watch 146.450 (support) and 147.170 (resistance) for breakout confirmation.
Key Levels:
Resistance Support
147.170 146.450
147.956 145.780
148.637
Actionable Idea:
A break below 146.450 could target 145.780.
A rebound above 147.170 opens path to 147.956.

Trend corrected, long funds reduced, sellers returned#XAUUSD
The current moving average is still spreading downward, and the 4-hour chart closed with a large negative line. The market has not yet given a clear feedback on the current trend. However, after a large amount of buying funds intervened, the gold price hit a high of around 3377 and then stagnated. The short-term bullish momentum has weakened, and there is a certain risk of a correction and decline. Sellers are beginning to return📉.
Currently, you can consider participating in short selling at 3370-3377💡. If it rebounds directly to 3400-3405, you can still short if it does not break🔍. The target is 3360 below, and 3350 or even 3330 if it breaks🎯.
🚀 SELL 3370-3377
🚀 TP 3360-3350
$QNT LOOKS GOOD TO LONG!GETTEX:QNT
Price is pulling back after a strong move up and is currently testing the trendline support along with key Fibonacci levels. This area has acted as a demand zone previously, making it a potential bounce spot for continuation.
If the trendline and Fib zone hold, we could see the next leg up.
Entry Zone: Around $116–$118
Stop Loss: Below $108
Targets:
Target 1: $123
Target 2: $130
Target 3: $135
Target 4: $148
DYOR, NFA
#TradeSetup #Altseason
