CHECK GBPJPY SIGNAL UPDATE GO READ CAPTAINEntry Point: Around 198.650 TO 198.550
Take Profit 1: 199.050
Take Profit 2: 199.500
Last Target: 199.900
Stop Loss: 198.050
Trend Analysis

USDJPY Sell Trade from the ResistanceUJ is at 1H Resistance we can sell correction move towards sell side.
Sentiments are for sell side so in bigger time it can break that zone but we can plan a instraday trade.

SP500 & Nasdaq Daily Trade SetupsIn this update we review the recent price action in the E-mini SP500 & Nasdaq futures contracts and identify the next high-probability trade setups and price objectives to target. To review today's video analysis, click here!

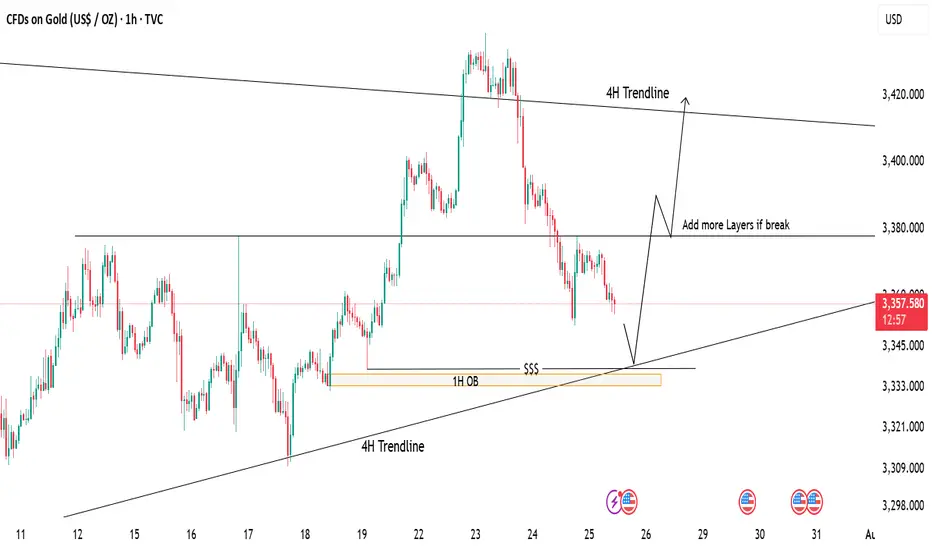
Gold Tapping Into Major Support – Eyes on Bullish ReversalPrice is currently retracing after a strong drop from recent highs. We're now approaching a key demand zone, aligning with:
📍 1H Order Block (OB)
📍 4H Trendline Support
📍 Liquidity Zone ($$$)
📉 If price taps into this area, it may offer a high-probability long setup.
📈 First target: 3380 (mid-range resistance)
🧱 If this breaks, we can look to scale in/add more positions, targeting the 4H trendline zone near 3420.
⚠️ Waiting for price reaction at support – patience is key!
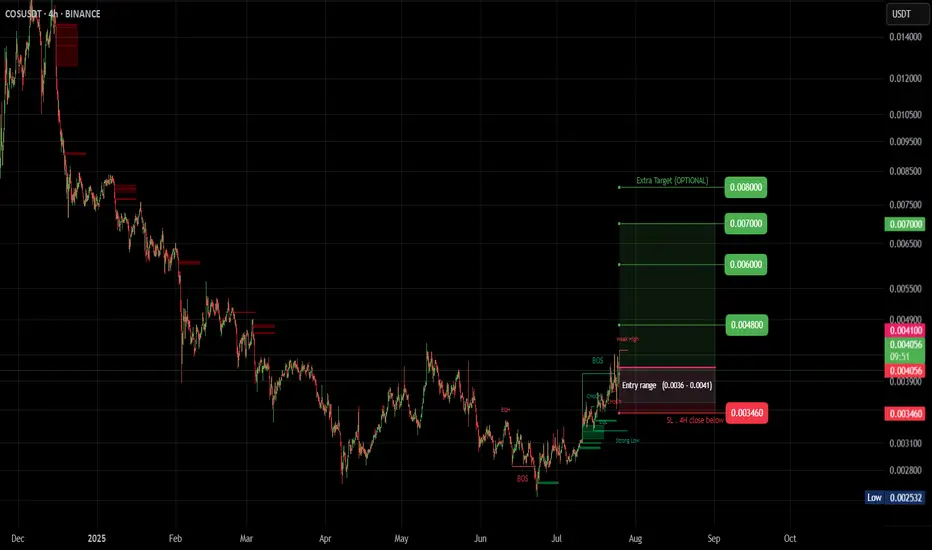
COS (SPOT)BINANCE:COSUSDT
#COS/ USDT
Entry (0.0036 - 0.0041)
SL 4H close below 0.003460
T1 0.0048
T2 0.0060
T3 0.0070
Extra Target
T4 0.0080
_______________________________________________________
Golden Advices.
********************
* collect the coin slowly in the entry range.
* Please calculate your losses before the entry.
* Do not enter any trade you find it not suitable for you.
* No FOMO - No Rush , it is a long journey.
GOLD (XAUUSD) Intraday Idea LongGold been keeping falling on both Asian and European sessions.
Most probably likely to pullback to London high after the New York session open.
Let's see if this plays out!
Good Luck!

Gold Approaching a Key Support, Potential Long OpportunityHi,
The setup is pretty clear from the chart.
Price has reached the lower boundary of the channel, which could offer a solid entry point for a long position, with a defined stop loss and take profit.

Gold to Take Support Gold at key support level, There is two chances.. where it can grab the liquidity... we will wait and watch... Cheers

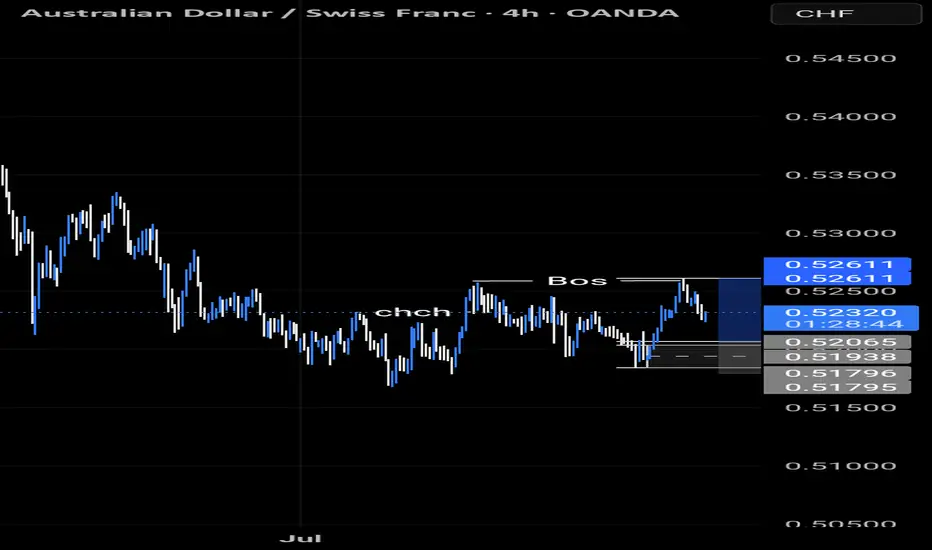
AUDCHF TRADE IDEA We're looking at a continuation trade to the upside on AUDCHF.
Let's see how it goes.
A pullback to our Fibonacci level for a continuation move
USDCHF Broke the Trendline resistance, what about Fib 0 .5? USDCHF was trading in downward and recently it has Broken the trendline resistance and price is currently at 0.5 fib will it reject form here again ? or fib 0.5 will be broken after correction and further growth ?

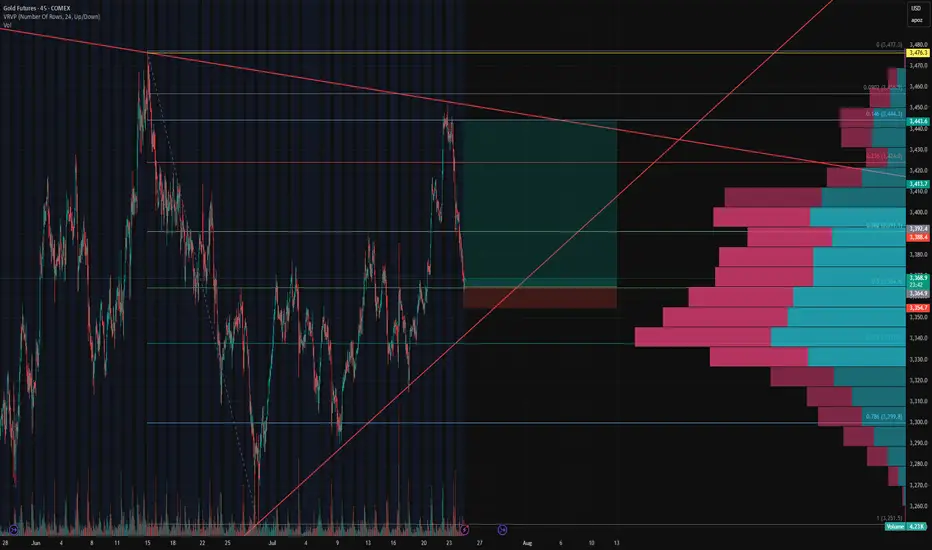
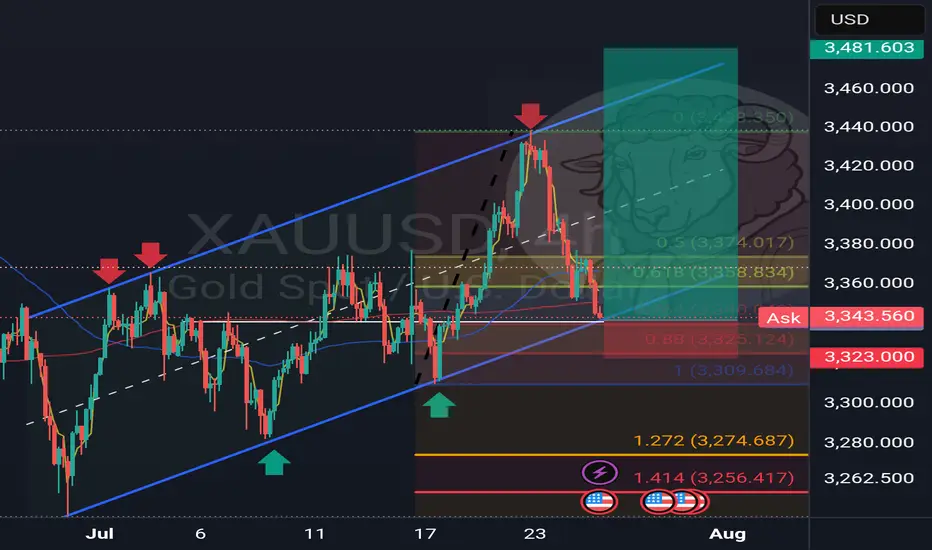
Gold Futures (GC1!) Long Setup – 0.5 Fib Bounce🟡 Gold Futures (GC1!) Long Setup – 0.5 Fib Bounce
After nailing the long from the bottom and perfectly shorting the top, we’re stepping back in for another calculated move.
📉 Price pulled back to the 0.5 Fibonacci retracement, aligning perfectly with the upward trendline support and a key HVN on the Volume Profile.
📈 Entered long at 3,365 with a tight stop below 3,354 (0.3% risk), targeting the descending trendline near 3,444 for a clean 7.7R setup.
🧠 Context:
Price reacted hard at resistance, but volume support and structure still lean bullish.
Clear invalidation if we break trend and lose 3,350 support cluster.
Let’s see if this bounce gets legs. 🚀
Gold energy buildup supported at 3308The Gold remains in a bullish trend, with recent price action showing signs of a continuation breakout within the broader uptrend.
Support Zone: 3308 – a key level from previous consolidation. Price is currently testing or approaching this level.
A bullish rebound from 3308 would confirm ongoing upside momentum, with potential targets at:
3387 – initial resistance
3400 – psychological and structural level
3435 – extended resistance on the longer-term chart
Bearish Scenario:
A confirmed break and daily close below 3308 would weaken the bullish outlook and suggest deeper downside risk toward:
3290 – minor support
3268 – stronger support and potential demand zone
Outlook:
Bullish bias remains intact while the Gold holds above 3308. A sustained break below this level could shift momentum to the downside in the short term.
This communication is for informational purposes only and should not be viewed as any form of recommendation as to a particular course of action or as investment advice. It is not intended as an offer or solicitation for the purchase or sale of any financial instrument or as an official confirmation of any transaction. Opinions, estimates and assumptions expressed herein are made as of the date of this communication and are subject to change without notice. This communication has been prepared based upon information, including market prices, data and other information, believed to be reliable; however, Trade Nation does not warrant its completeness or accuracy. All market prices and market data contained in or attached to this communication are indicative and subject to change without notice.

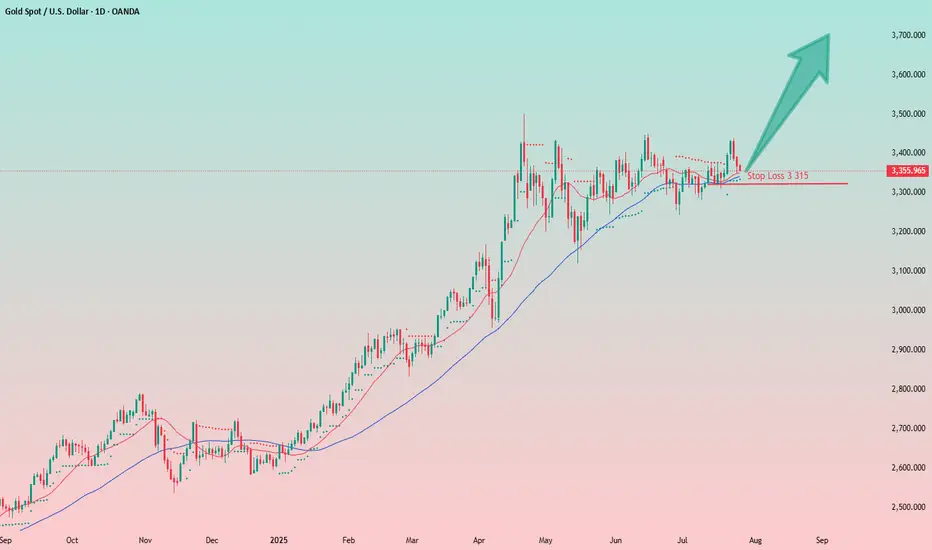
Gold Trade Against the Odds: When Emotion Meets StrategyThis may not be the best decision right now — I understand that — but it's one of those " I'm exhausted and just want to buy " moments.
The setup isn’t fully formed yet, but I have a strong feeling we’re going higher. I like the chart structure: low volatility, a spike to 3430 followed by a pullback to the moving averages without breaking key levels. I also like the tight stop at 1.2%.
I’m buying gold at the current level, around 3355.
📝Trading Plan
Entry: I’m buying gold at the current level, around 3355
Stop Loss: Stop at 3315
Target: 3425, 3500, and beyond.
EURUSD OUTLOOK On EURUSD, the previous day closed bearish. I then identified the most recent and significant supply and demand zones. After that, I proceeded to map out a possible entry and exit based on price reaction within those key areas.

DOGE : Idea.Hello, good ? Good.
Enter in doge here is not a bad idea in SPOT.
• Above the last important resistance.
• Retest on 50 Weekly MA.
• Above 50 rsi weekly.
• Bollinger bands in consolidation.
Need to confirm rejection in weekly like always.
If rejectyion here : x2 incoming.
Good luck guys, take care of you.


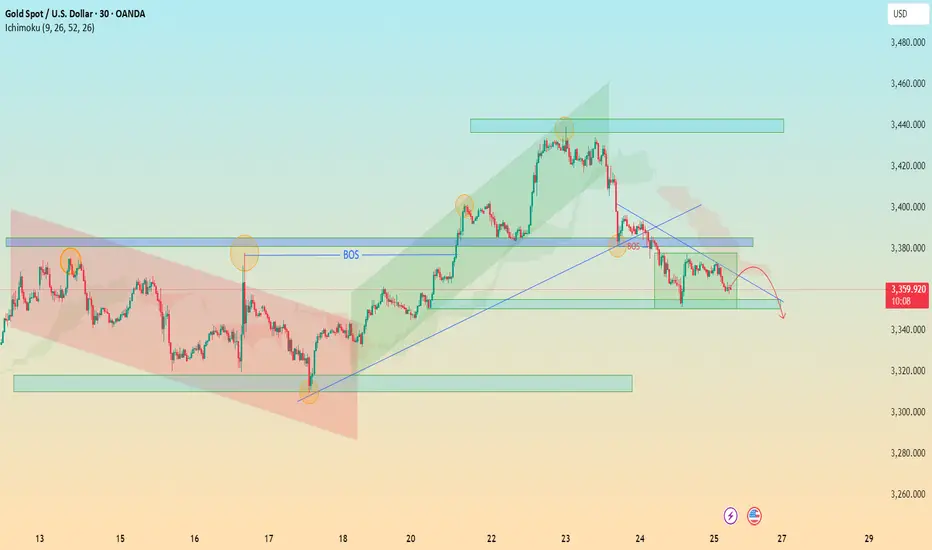
XAU/USD Bearish Retest in Motion – Watch 3340 for Breakout 🔍 XAU/USD (Gold) – Bearish Reversal Outlook
Timeframe: 30-Minute
Date: July 25, 2025
Indicators Used: Ichimoku Cloud, BOS (Break of Structure), Trendlines, Support & Resistance Zones
---
⚙ Technical Breakdown:
1. Previous Market Structure – Accumulation to Expansion:
Descending Channel (Red Box): Market moved within a bearish channel until the breakout occurred.
Key Break of Structure (BOS) around 3365 level signaled the beginning of bullish momentum — a textbook shift from accumulation to expansion phase.
Rally towards 3445 zone: Strong impulsive wave followed by higher highs and higher lows within a green rising channel.
2. Bull Trap and Structural Breakdown:
At the 3445-3460 resistance zone, price failed to maintain momentum and formed a double top / distribution setup.
The second BOS near 3385 confirmed a shift from bullish to bearish market structure.
Ichimoku Cloud also flipped bearish — price is now trading below the cloud, signaling potential continued downside.
3. Current Consolidation and Bearish Retest:
Price is now trapped in a bearish flag / rectangle pattern between 3360 – 3380.
Recent rejections from the descending trendline and overhead supply zone indicate weak bullish attempts and presence of strong selling pressure.
4. Anticipated Move – Bearish Continuation:
The projected red path suggests a retest of the diagonal resistance, followed by a breakdown toward key demand zone at 3340 – 3320.
If that zone fails, we may see a deeper move toward 3280.
---
📌 Key Technical Zones:
Zone Type Price Level (Approx.) Description
Resistance 3445 – 3460 Double Top / Strong Supply
Support 3340 – 3320 Historical Demand Zone
Short-term Resistance 3375 – 3385 BOS Retest + Trendline
---
🎯 Trading Insight:
📉 Bias: Bearish
⚠ Invalidation Level: Break above 3385 with volume
📊 Potential Target: 3340 → 3320
🧠 Trade Idea: Look for short entries on weak retests near descending trendline or cloud rejection.
---
🏆 What Makes This Chart Unique for Editors’ Picks:
✅ Multiple Confluences: Structural shifts (BOS), trendlines, Ichimoku, and classic patterns (channels, flags).
✅ Clear Visual Storytelling: Logical flow from bearish to bullish and back to bearish structure.
✅ Forward Projection: Predictive outlook based on strong technical context — not just reactive analysis.
✅ Educational Value: Useful for beginners and intermediate traders alike to understand structure transitions and key levels.
Gold – Bear-to-Bull Transition in Motion?🧠 MJTrading:
TVC:GOLD – 8H Chart: Bulls, It’s Your Move.
📸 Viewing Tip:
🛠️ Some layout elements may shift depending on your screen size.
🔗 View the fixed high-resolution chart here:
The impulsive move from 3000 to 3500 wasn’t just a trend — it was a statement of strength.
That rally carved the ATH, then left behind weeks of digestion and structural compression.
Now, the market may be setting up for its next decision.
Notice how each bearish leg has been shrinking — a classic behavioral signal that sellers are losing momentum — possibly a shift in control underway.
We’re also pressing above the downtrend line from the ATH (3500), while the uptrend from 3000 remains clean and respected.
We’re now testing the 3400 zone — a key battleground.
📍 If bulls want to reclaim the momentum and show dominance, this is the moment to act.
🔹 1st Support: 3363–3377
🔹 2nd Support: Rising trendline
🎯 Target Zone: 3455–3500+ (Liquidity Pool & ATH proximity)
⚠️ Break back inside the triangle could delay the breakout narrative.
⚠️ If momentum fails to increase from here, and bulls can’t break out with conviction, the market is likely to remain range-bound for longer — extending the sideways phase between 3250–3500.
💭 If you’re watching for a new ATH… stay sharp, stay structured — the market rewards patience and readiness.
“If the structure speaks to you, let it echo, boost it.”
📐 MJTrading 🚀
What do you think?
#GoldAnalysis #XAUUSD #MarketStructure #LiquiditySweep #AnythingCanHappen
#MJTrading
#ChartDesigner
Psychology Always Matters:
Click on them for the caption...


XAUUSD bullish breakout from major supply zone retracement done📊XAUUSD Forecast – 1H Timeframe
Gold has broken out above the major supply zone at 3375, showing strong bullish intent
Price is now pulling back — retracement in progress back to the breakout level for a potential bullish continuation
📍 Key Zone to Watch:
3375 now acting as strong support — waiting for a bullish confirmation candle from this zone
🎯 Next Resistance / Target Levels:
🔹 3399 – minor resistance
🔹 3435 – key supply zone on watch
🧠Waiting patiently for confirmation before re-entering — structure still bullish on the 1H timeframe
What’s your next move on Gold? Drop your thoughts below
👍 Like | 🔔 Follow | 💭 Comment for real-time trade ideas
#xauusd #gold


Volatility Period: July 24-26
Hello, traders.
If you "Follow", you can always get the latest information quickly.
Have a nice day today.
-------------------------------------
(BTCUSDT 1D chart)
BTC is in a step up trend.
Looking at the bigger picture, it can be seen that it is in the second step up trend.
The important volatility period in this step-up is expected to be around August 2-5 (up to August 1-6).
Therefore, we need to look at what kind of movement it makes as it passes through the previous volatility period of around July 25 (July 24-26) and around July 31 (July 30-August 1).
In other words, we need to check which section is supported and which section is resisted, and see if it breaks through that section.
What we can see now is that it is checking whether there is support in the 115854.56-119086.64 section, that is, the HA-High ~ DOM (60) section.
Since the M-Signal indicator on the 1D chart has risen to the 115854.56 point, the key is whether it can receive support at the 115854.56 point and rise.
If it falls below the M-Signal indicator of the 1D chart and shows resistance, it is likely to meet the M-Signal indicator of the 1W chart.
This flow is an interpretation of the separation learned when studying the price moving average.
Therefore, we can see that the maximum decline point is when it meets the M-Signal indicator of the 1M chart.
-
Industries (coins, tokens) that are renewing the ATH are actually outside the predictable range.
Therefore, we should think of it as a situation where it is not strange whether it falls or rises at any time and think of a response plan.
Since it is currently within the predictable range, we can create a response strategy by checking whether there is support in the 115854.56-119086.64 section.
However, as I mentioned earlier, the volatility period is about to begin, so caution is required when making new transactions.
That is, you need to check whether it breaks out of the 115854.56-119086.64 range during the volatility period that continues until July 26.
And if it breaks out, you need to check whether it is supported or resisted in that area and respond accordingly.
-
The OBV indicator of the Low Line ~ High Line channel is showing a pattern of rising above the High Line.
Accordingly, if the OBV indicator is maintained above the High Line, it is expected to show an additional rise.
In accordance with this, you need to check whether the K of the StochRSI indicator shows a movement to rise in the oversold range and a transition to a state where K > D.
You also need to check whether the TC (Trend Check) indicator continues its upward trend and can rise above the 0 point.
If these conditions are met, it is expected that BTC will rise above 119086.64 or show a pattern of rising.
-
This decline created a low trend line, creating a perfect rising channel.
Therefore, we need to see how far we can go up along the rising channel created this time.
In that sense, we should pay close attention to the movement during the volatility period around July 25th (July 24-26).
-
Thank you for reading to the end.
I hope you have a successful trade.
--------------------------------------------------
- This is an explanation of the big picture.
(3-year bull market, 1-year bear market pattern)
I will explain more details when the bear market starts.
------------------------------------------------------
