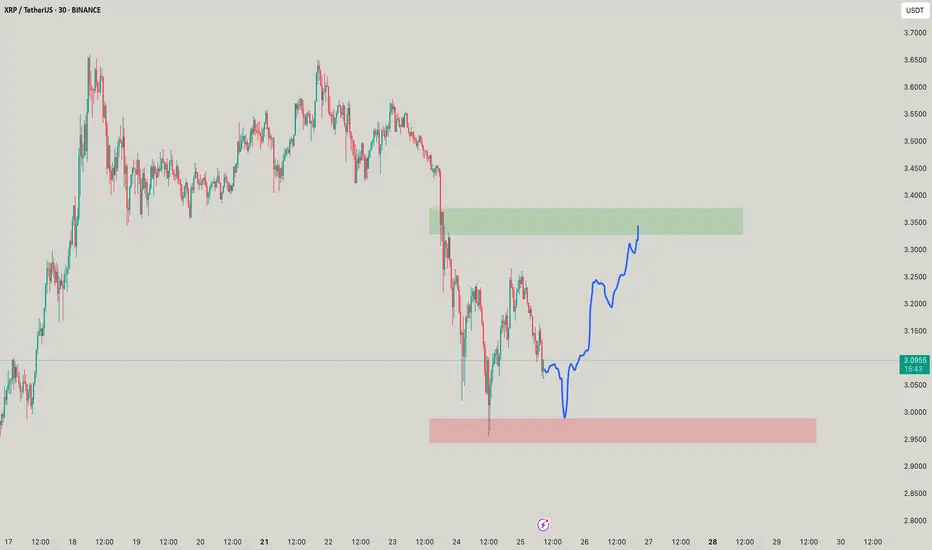
XRP ~ Is this a best trade to take?XRP ~ This beauty is best to be buys at the red nd aim for the greeens!
Trend Analysis
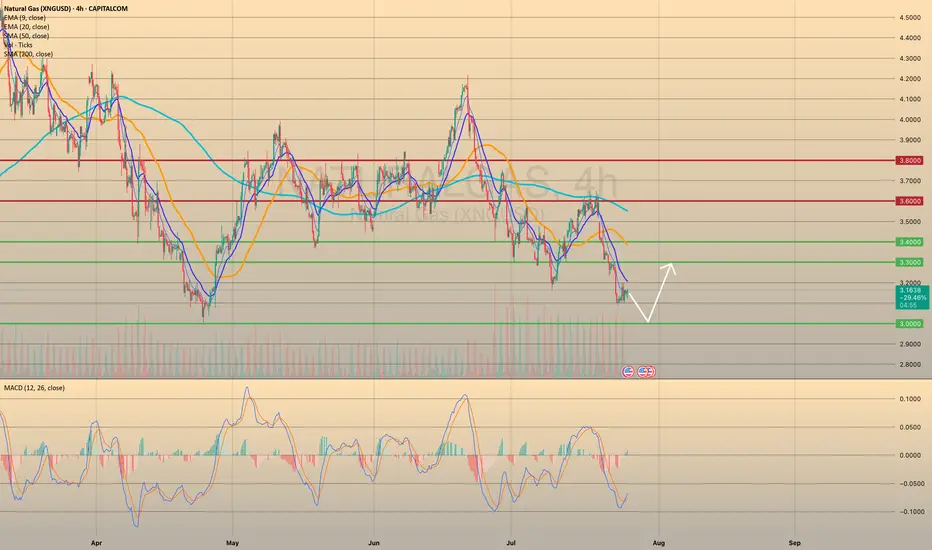
XNGUSD CONTINUES ITS DOWNWARD TREND. FOR HOW LONG?XNGUSD CONTINUES ITS DOWNWARD TREND. FOR HOW LONG?
Recent bearish impulse started at the beginning of this week may come to an end soon. Yesterday the U.S. Natural Gas Storage report came out. Numbers appeared to be lower than expected and lower than previous. (23b vs 28b vs 46b). This is bullish signal for the market participants. Minutes after the report came out, market reacted bullish, however, soon price went sideways.
Right now gas prices continue to decline. Still, the opportunity for short-sellers here is quite limited. Not so far below there is a level of 3.0000, form where I expect the price to rebound, supposedly to a 3.3000.
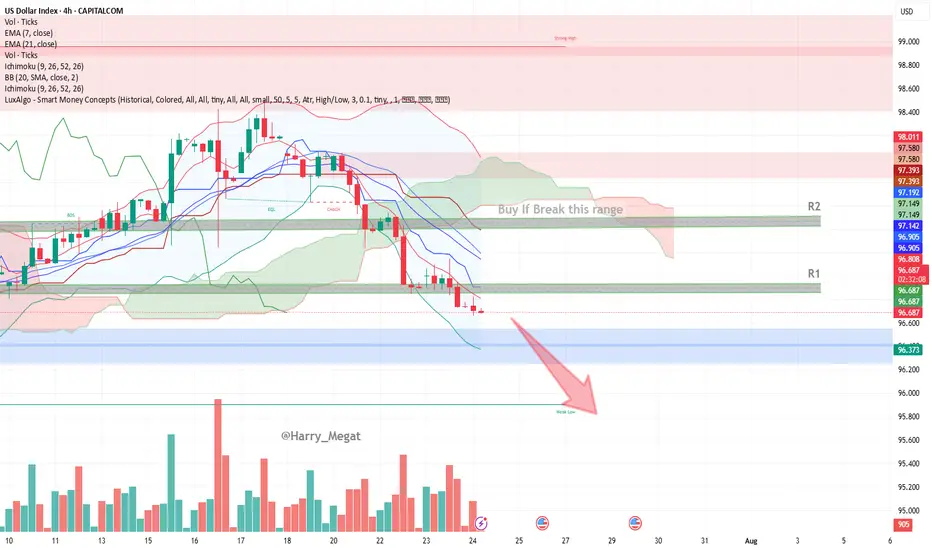
US Dollar Index (DXY) – 4H Chart AnalysisUS Dollar Index (DXY) – 4H Chart Analysis
**Current Trend:** Bearish
Price trades below EMAs, Ichimoku Cloud, and within a bearish channel.
#**Bearish Scenario (Favorable)**
* **Conditions:**
* Price remains below EMA 7 & 21
* Stays under Ichimoku Cloud and 96.812 resistance (R1)
* Lower lows forming, bearish momentum increasing
* **Confirmation:**
Break below **96.37 (blue zone)**
* **Target:**
* TP1: 96.00
* TP2: 95.60 (next weak support)
**Bullish Scenario (Reversal)**
* **Conditions:**
* Price must break above **96.81 (EMA 7 + resistance)**
* Break above **R1 → 96.90**, and then above **R2 → 97.14–97.19**
* Bullish candles close above the Ichimoku cloud
* **Confirmation:**
Break and retest of **97.20**
* **Target:**
* TP1: 97.39
* TP2: 97.58 (key structure)
* TP3: 98.00 (major resistance)
**Bias:** Bearish unless DXY breaks above **97.20** with strong volume and bullish structure.
GOLD Will Move Higher! Buy!
Here is our detailed technical review for GOLD.
Time Frame: 12h
Current Trend: Bullish
Sentiment: Oversold (based on 7-period RSI)
Forecast: Bullish
The market is on a crucial zone of demand 3,347.64.
The oversold market condition in a combination with key structure gives us a relatively strong bullish signal with goal 3,425.86 level.
P.S
We determine oversold/overbought condition with RSI indicator.
When it drops below 30 - the market is considered to be oversold.
When it bounces above 70 - the market is considered to be overbought.
Disclosure: I am part of Trade Nation's Influencer program and receive a monthly fee for using their TradingView charts in my analysis.
Like and subscribe and comment my ideas if you enjoy them!

Global Liquidity Index vs BitcoinGlobal liquidity index at ATH!
CRYPTOCAP:BTC will continue to follow hard!

Blokblok usdt daily analyses
time frame daily
long position risk of ratio >9
target 0.00075$
if price breaks the upper line my long position will start. duration of this forecast is long
if it cannot break and move between orange lines my short position will be active. this duration is short
short position risk of ratio >2
target 0.00027$

Ethereum (ETH): Buyers Accumulated | Time For Boune & BreakoutEthereum had its fun this week, and now we are already seeing some signs of buyer dominance forming here.
Based on our overall target and bigger timeframes, TAs, the $4000 is the target and 4hour candels are showing that buyers have not given away anything yet but rather have just been accumulating.
As long as we are above our entry area, we are bullish, and so should you be ...
Swallow Academy

Google: A compelling buy at the current priceHello,
As Warren Buffett famously said, "Be fearful when others are greedy, and greedy when others are fearful." This mindset is particularly relevant right now with Alphabet Inc.
Despite being a company whose products we use daily—and will likely rely on even more in the future—Alphabet's stock recently declined following comments from Apple’s Eddie Cue regarding a drop in Safari search traffic. This has sparked concerns about Google's dominance in search and its ad revenue streams. Analysts are also highlighting growing competition from AI-driven platforms such as OpenAI, Grok, and Perplexity, raising questions about the future growth of Google Search.
While the headlines may seem discouraging, we remain confident in Google’s enduring leadership in the search space, underpinned by its unmatched scale, infrastructure, and user base. We also believe the market continues to underestimate how far ahead Google truly is in artificial intelligence.
In our view, this dip represents a strategic buying opportunity for long-term investors. Below is our in-depth analysis of Alphabet and why we believe it remains a strong investment.
Alphabet, Inc is a holding company, which engages in the business of acquisition and operation of different companies. Google Services includes products and services such as ads, Android, Chrome, devices, Google Maps, Google Play, Search, and YouTube. Google Services generates revenues primarily from advertising; fees received for consumer subscription-based products such as YouTube TV, YouTube Music and Premium, and NFL Sunday Ticket, as well as Google One; the sale of apps and in-app purchases and devices.
KEY NOTES FROM THE Q1 2025 EARNINGS CALL
Revenue up to $ 90.23 Billion (Q1 2024: $ 80.54 Billion)
Operating income for quarter one 2025 at $ 30.61 Billion (Q1 2024: $ 25.47 Billion)
Net income for quarter one 2025 at $ 34.54 Billion (Q1 2024: $ 23.66 Billion)
Diluted Earnings per share closed at $ 2.81 as at 31st March 2025 (2024: $ 1.89). Alphabet’s Board of Directors declared a quarterly cash dividend of $0.21 representing a 5% increase from the previous quarterly dividend of $0.20.
Cash and cash equivalents remained flat as of the end of March 31 2025 at $ 23.26 Billion (2024: $ 23.47 Billion)
Google advertising continues to do the heavy lifting for the alphabet business contributing $ 66.89 Billion of the total $90.23 Billion. Google Services includes products and services such as ads, Android, Chrome, devices, Google Maps, Google Play, Search, and YouTube. Of this amount, the breakdown is as below
•Google search & other: $ 50.70 Billion
•Youtube ads: $ 8.93 Billion
•Google Network: $ 7.26 Billion
Other services offered by the platforms contributed revenues as below
Google subscriptions, platforms & devices: $ 10.38 Billion
Google cloud: $ 12.26 Billion
Other bets: $ 450 million. Other Bets is a combination of multiple operating segments that are not individually material.
Hedging gains: $ 260 million
The company announced a share buyback program of up to $70 billion of its class A and class C shares. The buy backs will be executed through open market purchases or through privately negotiated transactions.
Business Opportunities/Strengths
Alphabet’s advertising business is firmly embedded in digital advertising budgets, allowing it to capitalize on the ongoing growth in digital ad spending.
The significant cash flows from advertising enable Alphabet to reinvest in growth areas like Google Cloud, AI-enhanced search, and innovative ventures such as Waymo. (Waymo is Alphabet's autonomous driving technology subsidiary, focused on developing self-driving cars and related technologies.)
With a strong foothold in the public cloud market, Alphabet has a substantial opportunity as a major provider for enterprises transitioning to digital platforms.
Risks to consider
Although Alphabet is working to diversify, text-based advertising remains its primary revenue source, presenting a concentration risk.
Ongoing investments in emerging, sometimes unproven technologies through its Other Bets segment continue to strain cash flows.
Increasing regulatory scrutiny of Alphabet's search dominance worldwide could lead to significant market disruptions through structural reforms.
Recommendation
We view Alphabet as a solid business with diverse solutions ranging from advertising, cloud business and driverless cars as well. While we acknowledge that the antitrust cases have continued to make headlines, we encourage investors to remain invested and focused on the business’s strengths. The business has unique products that will have the ability to remain leaders for a very long period of time. Android is the operating system for the majority of the world’s smartphones with more than two-thirds of all smartphones in the world running it. Virtually all smartphones, other than those manufactured by Apple, run on Android. We see this remaining as a google strength for a very long time. The Google Play Store’s unmatched ecosystem creates significant barriers for competing operating systems, limiting their access to critical applications. The recent correction on US technology companies provides us with a solid buying price for some of these great companies. Alphabet alone corrected by about 31% and has since bounced back.
We see the current price as a great entry price for long term investors based on both technical and fundamental analysis with a target price of $ 203.

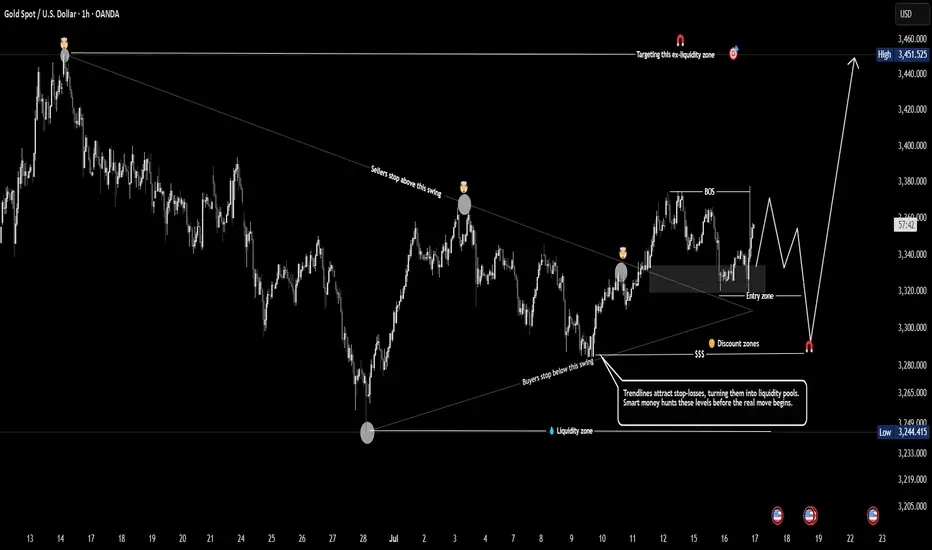
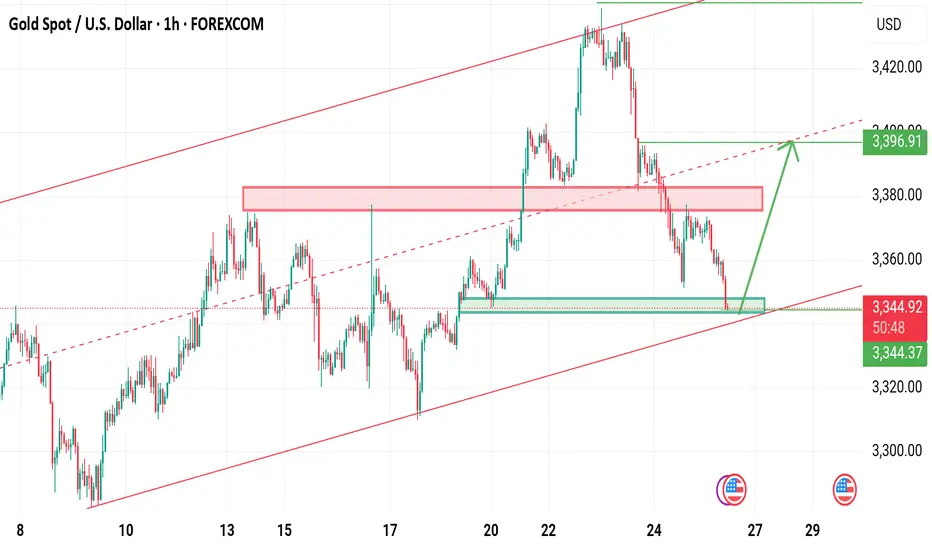
Liquidity Sweep & Discount Entry Zone - Gold Swing Play Gold is targeting an external liquidity zone around 3,450 after breaking structure and forming a bullish setup. Price is expected to dip into the discount zone near 3,300 to collect liquidity from trendline stops before a strong move upward. Smart money is likely hunting below prior lows before initiating the next bullish leg.
XAU/USD: Golden Breakout to $3400?XAU/USD: Golden Opportunity Ahead XAU/USD is testing a key support at $3345, with a bullish setup forming on the 1-hour chart. Entry at $3345 offers a high-probability trade, targeting $3400 where the next resistance aligns. Set a stop loss at $3320 to manage risk below the recent support. A break above $3350 with strong volume could confirm the move. Watch for US dollar weakness as a catalyst. Trade smart!
#XAUUSD #GoldTrading #ForexSignals #TechnicalAnalysis #MarketAnalysis #DayTrading

EURJPY Q3 | D25 | W30 | Y25📊 EURJPY Q3 | D25 | W30 | Y25
Daily Forecast🔍📅
Here’s a short diagnosis of the current chart setup 🧠📈
Higher time frame order blocks have been identified — these are our patient points of interest 🎯🧭.
It’s crucial to wait for a confirmed break of structure 🧱✅ before forming a directional bias.
This keeps us disciplined and aligned with what price action is truly telling us.
📈 Risk Management Protocols
🔑 Core principles:
Max 1% risk per trade
Only execute at pre-identified levels
Use alerts, not emotion
Stick to your RR plan — minimum 1:2
🧠 You’re not paid for how many trades you take, you’re paid for how well you manage risk.
🧠 Weekly FRGNT Insight
"Trade what the market gives, not what your ego wants."
Stay mechanical. Stay focused. Let the probabilities work.
FRGNT
OANDA:EURJPY

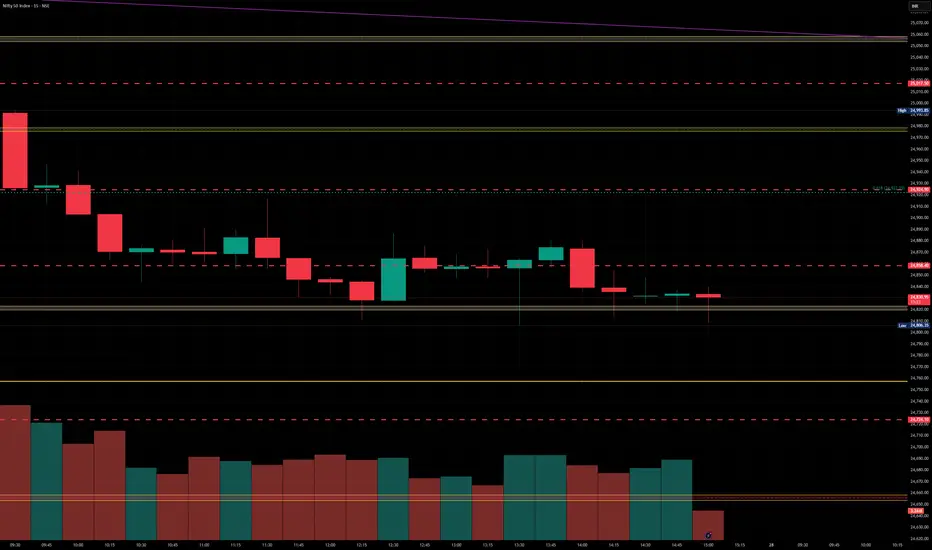
Nifty levels - Jul 28, 2025Nifty support and resistance levels are valuable tools for making informed trading decisions, specifically when combined with the analysis of 5-minute timeframe candlesticks and VWAP. By closely monitoring these levels and observing the price movements within this timeframe, traders can enhance the accuracy of their entry and exit points. It is important to bear in mind that support and resistance levels are not fixed, and they can change over time as market conditions evolve.
The dashed lines on the chart indicate the reaction levels, serving as additional points of significance to consider. Furthermore, take note of the response at the levels of the High, Low, and Close values from the day prior.
We hope you find this information beneficial in your trading endeavors.
* If you found the idea appealing, kindly tap the Boost icon located below the chart. We encourage you to share your thoughts and comments regarding it.
Wishing you success in your trading activities!
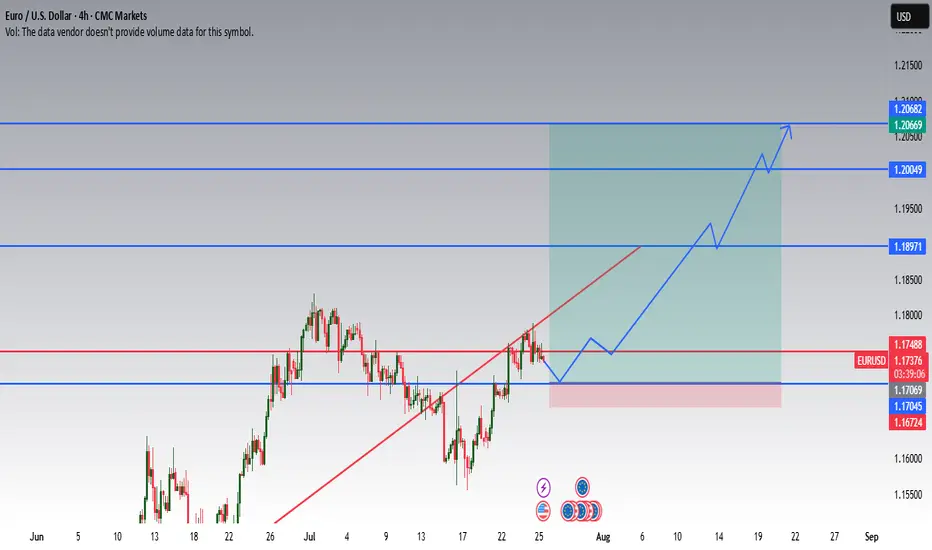
EURUSD Long Setup: Technically and Fundamentally Supported Push 📈 I'm expecting a climb of this pair due to weakening USD.
This idea is based on both technical and fundamental parameters:
🔍 Fundamentals
ECB kept rates unchanged, signaling stability and reluctance to tighten policy further.
FED is expected to cut rates in 5 days, as inflation eases and growth concerns rise in the US.
A weaker dollar is likely to support EURUSD strength.
1.20 is a psychological and political level – above that, European exporters begin to suffer, and ECB might intervene verbally or with policy action.
🧠 Technical Setup
Price has reclaimed a key support zone around 1.17069 – 1.17488, with consolidation signaling accumulation.
Break of the descending trendline shows bullish intent.
Next major resistance lies at 1.18971, followed by 1.20049 – a strong historical level and likely ECB reaction zone.
Final target at 1.20669 – 1.20682 marked by previous highs.
Entry Zone: 1.17045–1.17488 (current area of interest)
Stop Loss: Below 1.16724
Targets: 1.18971 / 1.20049 / 1.20669
💬 Feel free to monitor price action at key zones. Entry should be based on reaction at support or a confirmed breakout. This is not a blind entry setup.
📅 If the FED cuts rates as expected, USD weakness could accelerate the move.
USDCHF – The Wind Still Blows South!USDCHF remains trapped below the descending trendline since June. Every bullish attempt has been sharply rejected – showing sellers are still in control.
Fresh U.S. data just released:
Jobless claims dropped → strong labor market → Fed likely to keep rates high → USD gains strength.
Manufacturing PMI beat expectations → resilient economy → more reason for a hawkish Fed.
But don’t forget: CHF is attracting safe-haven flows, adding downward pressure on USD!
If price fails to break above 0.7990 and gets rejected at the trendline, a drop toward 0.7890 is likely.
Strategy: Look to SELL around the trendline – follow the trend, not your emotions!

XAUUSD Last hope for buyers Gold is currently still holding rising channel last hope for buyers the bottom trendine .
Below 3335 buyers will be liquidate
What's possible scanarios we have?
▪️I'm gonna take buy trade from 3340-3338 area by following our rising Trend along with structural liquidity sweeps strategy, my target will be 3357 then 3368 in extension.
▪️if H4 candle closing below 3335 this Parallel moves will be invalid and don't look for buy till confirmation
USDJPY BUY OPPORTUNITY Price provides us with a buy opportunity from the current market price as we see a continuous rise in buy momentum . We’re looking at seeing this momentum reach a high of 151.083 a buy opportunity is envisaged from the current price.

GBPUSD Support & Resistance Levels🚀 Here are some key zones I've identified on the H1/M15/M5 timeframe.
These zones are based on real-time data analysis performed by a custom software I personally developed.
The tool is designed to scan the market continuously and highlight potential areas of interest based on price action behavior and volume dynamics.
Your feedback is welcome!

The Day AheadFriday, July 25 – Financial Market Summary (Trading Focus)
Key Data Releases:
US
June Durable Goods Orders: A leading indicator of manufacturing activity. Strong growth may boost USD and treasury yields; weak numbers could fuel rate-cut bets.
July Kansas City Fed Services Activity: Gauges regional service sector performance, often a directional cue for sentiment in broader Fed outlook.
UK
July GfK Consumer Confidence: Measures household sentiment. A decline may pressure GBP as it hints at cautious spending.
June Retail Sales: A key gauge of consumer demand. Surprises could move GBP sharply, especially amid BoE rate-cut speculation.
Japan
July Tokyo CPI: A leading inflation gauge ahead of the national print. Hotter data may raise doubts about BoJ’s ultra-loose stance.
June Services PPI: Measures business input costs; could signal future CPI pressure.
Eurozone
Germany July Ifo Survey: Monitors German business sentiment. Markets use this as a proxy for Eurozone economic health. Weakness can weigh on EUR and Bunds.
France/Italy Confidence Surveys: Consumer and manufacturing sentiment—important for pricing growth expectations across the bloc.
June M3 Money Supply: Closely watched by ECB for inflation outlook.
Central Bank:
ECB Survey of Professional Forecasters: Key for insight into market inflation expectations, growth, and rate paths—could shift EUR and European yields.
Earnings – Market Movers:
HCA Healthcare: Strong US economic bellwether; watch for comments on consumer healthcare trends.
Charter Communications: Cable/streaming sector in focus—guidance may affect tech/media sentiment.
Volkswagen: Global auto demand barometer—insight into EV strategy, China exposure.
NatWest: UK-focused bank—comments on credit conditions and loan demand will influence GBP and FTSE sentiment.
Eni: Energy major—production guidance, commodity price outlooks will move oil-sensitive equities and possibly EUR.
Trading Implications:
Focus on US durable goods for risk-on/risk-off bias.
Eurozone sentiment and ECB inflation forecasts could reset EUR expectations.
UK data dump will be crucial for GBP direction amid BoE policy divergence.
Earnings from global cyclicals (Volkswagen, Eni) and banks (NatWest) may sway sectoral rotation.
This communication is for informational purposes only and should not be viewed as any form of recommendation as to a particular course of action or as investment advice. It is not intended as an offer or solicitation for the purchase or sale of any financial instrument or as an official confirmation of any transaction. Opinions, estimates and assumptions expressed herein are made as of the date of this communication and are subject to change without notice. This communication has been prepared based upon information, including market prices, data and other information, believed to be reliable; however, Trade Nation does not warrant its completeness or accuracy. All market prices and market data contained in or attached to this communication are indicative and subject to change without notice.
Elliott Wave Outlook: AMD Expects Pullback Soon Before RallyThe Advanced Micro Devices Inc., (AMD) favors rally in impulse Elliott Wave sequence from 4.09.2025 low & expect upside in to 168.36 – 190.36 to finish it. Impulse sequence unfolds in 5, 9, 13, 17…., swings & ends with momentum divergence. In daily, it ended pullback in 3 swings at 75.22 low in blue box area from March-2024 high. It is trading higher in nest & expect 13 swings to finish the impulse ((1)) before correcting next. Currently, it favors rally in 7th swing in daily & expect end soon in to 165.63 – 179.16 area before correcting in (4) as 8th swing. In 4-hour, it ended (1) of ((1)) at 97.91 high, (2) at 83.75 low in 4.21.2025 & favors rally in (3) as extended wave. Within (3), it placed 1 at 122.52 high, 2 at 107.09 low, 3 at 162.36 high, 4 at 149.34 low of 7.22.2025 & favors rally in 5. It is showing higher high since April-2025 low.
Below 3 high of 162.36, it ended 4 pullback in double three correction at 149.34 low. It ended ((w)) at 155.81 low, ((x)) at 160.34 high & ((y)) at 149.34 low. Above 4 low, it favors rally in ((i)) of 5 in to 165.44 – 170.43 before correcting next. Within ((i)), it ended (i) at 155.53 high, (ii) at 152.66 low, (iii) at 161.20 high, (iv) at 158.36 low & favor higher in (v). It appears three swings in (v) & expect pullback before final push above 161.52 low before correcting in ((ii)). Alternatively, the current cycle from 4 low can be 5 of (3) before it corrects in (4). In either the case, the next pullback should remain supported. In 4-hour, it is trading in 11th swing & expect pullback in 12th swings later before final rally. We like to buy the pullback in 3, 7 or 11 swings at extreme area for the upside in ((1)).

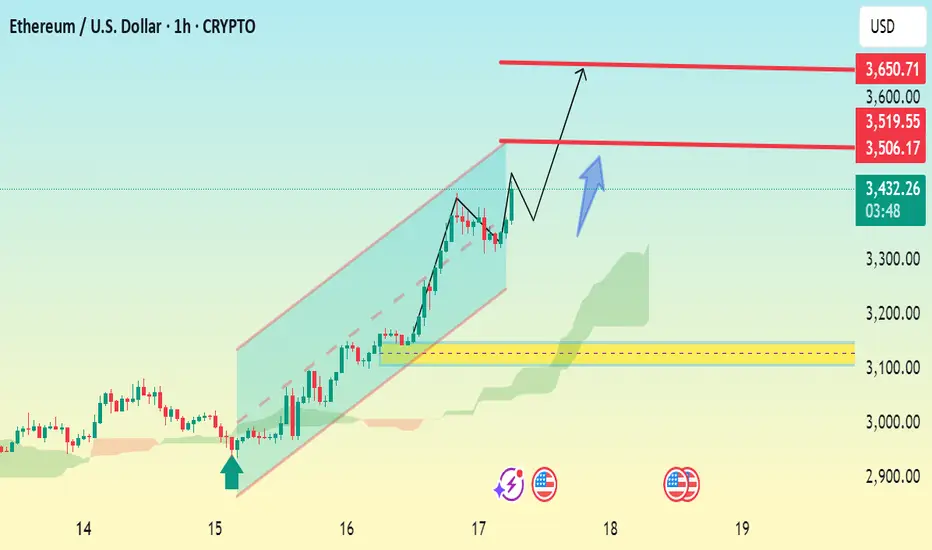
ETHUSD 1h Bullish Reversal SetupChart Analysis Summary:
Current Price:
$3,429.21 (at the time of the screenshot)
Trend:
Strong uptrend within a bullish ascending channel.
Price has been respecting the trendline and moving upward steadily.
Key Chart Patterns & Tools:
Ascending Channel: ETH is trading within an upward sloping channel, suggesting bullish momentum.
Ichimoku Cloud (green): Price is trading well above the cloud, reinforcing bullish sentiment.
Breakout Structure: The chart shows a small consolidation/pullback with a projected bullish breakout.
📈 Key Levels:
Type Price Level (USD) Notes
Current 3,429.21 Live price
Resistance 1 3,506.17 Minor resistance
Resistance 2 3,519.55 Immediate breakout target
Final Target 3,650.71 Major resistance and potential price objective
🧭 Price Action Forecast:
If ETH holds above $3,429 and breaks above $3,519.55, the path toward $3,650 remains open.
A small pullback (as indicated by the blue arrow) is expected before continuation.
As long as price remains within or near the ascending channel, the bullish scenario .
✅ Bullish Confirmation:
Break and retest of $3,519.55.
Continued support above the Ichimoku cloud.
Holding the trendline from the ascending channel.
How can we seize the golden opportunity steadily and accurately?Yesterday, gold showed a trend of falling first and then rising to bottom out and rebound. After falling back to 3351, it quickly rebounded to around 3377. The overall fluctuation rhythm was highly consistent with our prediction. We accurately grasped the opportunity to arrange long orders and promptly notified the high position to reduce positions and make profits. The rhythm was properly controlled and we gained good returns.
From a technical point of view, the four-hour line fell and rebounded, and the short-term short momentum slowed down. Although it has not completely turned into a long structure, the short trend is no longer valid. At this stage, we will not look at new lows for the time being, and the operation is mainly based on the main long idea. At the daily level, pay attention to the long-short watershed of 3385. If it breaks through this level, it is expected to open up the upward space and look to 3392 or even above 3400; if it does not break, the market may continue the shock and wash pattern. Pay attention to the support below around 3365-3350. As long as it does not break and stabilizes, you can still choose to arrange low and long positions. In the short term, pay attention to the breakthrough of the rebound high point 3377. If it successfully stands firm, it will further enhance the continuity of the long position.

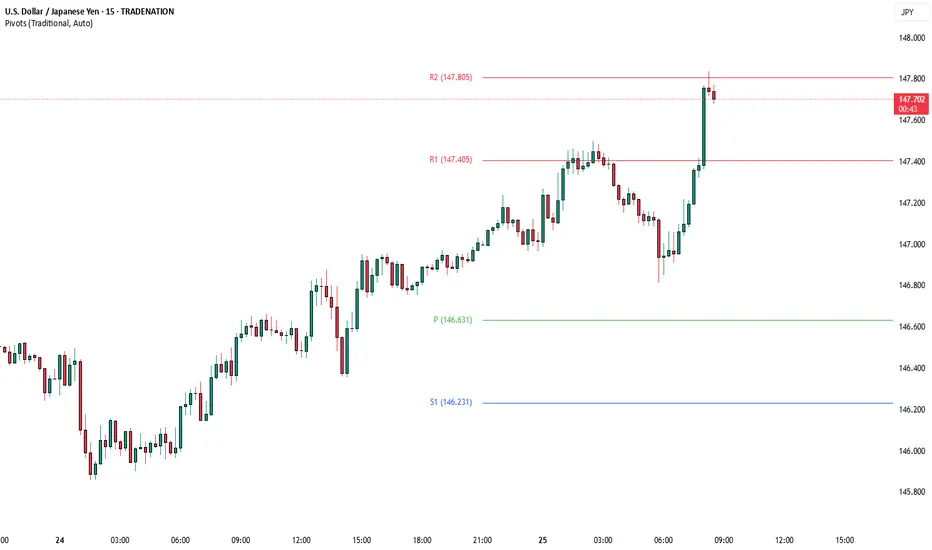
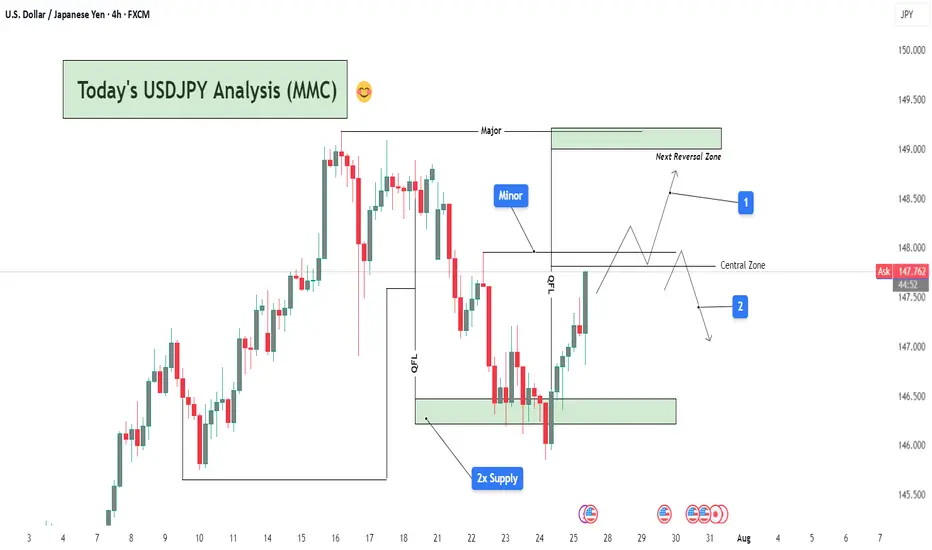
USDJPY Analysis : Smart Money Setup & MMC Concept + Target📌 Chart Overview:
This 4H USDJPY chart presents a multi-phase market structure analysis rooted in MMC (Major-Minor-Central) framework, Smart Money Concepts (SMC), and liquidity mapping. The price is currently trading around 147.39, and the chart outlines two possible scenarios labeled 1 (bullish continuation) and 2 (bearish rejection).
🔍 Key Zones & Technical Elements Explained:
🔹 1. 2x Supply Zone (Support Reaction)
Price rebounded sharply from the double-tested demand zone marked around 146.00–146.50.
This zone has historical significance and has acted as a base for previous bullish momentum.
The sharp V-shaped recovery suggests strong buying interest at institutional levels, hinting at a potential bullish continuation.
🔹 2. QFL (Quick Flip Liquidity) Zone
A notable zone where previous bullish structure broke down. It’s now being retested from below.
The QFL structure acts as a hidden supply zone or potential liquidity trap.
Watch for price rejection here, especially if it aligns with liquidity sweep patterns.
🔹 3. Minor & Major Structural Levels
Minor zone: A smaller consolidation and reaction zone—used to observe minor trend shifts or scaling entries.
Major zone: Sitting around 148.50–149.00, this is your Next Reversal Zone. It overlaps with a historical resistance area and could lead to a significant reaction.
📈 Projected Scenarios:
✅ Scenario 1: Bullish Continuation
Price breaks above the Central Zone and holds.
After breaching the minor resistance, it climbs towards the Major Reversal Zone (148.50–149.00).
There, we look for:
Either a reversal trade setup (liquidity grab + bearish confirmation).
Or continuation beyond 149.00, especially if supported by USD strength/fundamentals.
🚫 Scenario 2: Bearish Rejection
Price fails to hold above the Central Zone.
Rejection at QFL or Minor levels sends the pair back into the mid-147s and potentially down to retest the 2x Supply Zone again.
Breakdown from there could lead to a move towards 145.50–146.00, forming a potential double bottom or deeper retracement.
🧩 Technical Insights Summary:
Trend Context: Short-term bullish recovery from demand, but macro trend still uncertain.
Key Confluence:
2x Supply → Strong demand.
QFL + Central → Key breakout/rejection zones.
Major Zone → High-probability reversal area.
Bias: Neutral to Bullish, favoring Scenario 1 if price sustains above 147.50.
Watch for:
Candlestick rejections in Major Zone.
Break-and-retest behavior in Central Zone.
USD-related news near July 30–31 (highlighted below chart).
Gold selling pressure decreased at the end of the week⭐️GOLDEN INFORMATION:
Gold price (XAU/USD) remains under modest pressure during Friday’s Asian session, unable to build on the previous rebound from the mid-$3,300s. Renewed strength in the US Dollar, which extends its recovery from a multi-week low, acts as a headwind for the non-yielding metal. Additionally, fresh optimism surrounding the US-Japan trade agreement has dampened safe-haven demand, keeping gold on the defensive for the third consecutive day.
That said, lingering uncertainty over the Federal Reserve’s rate-cut trajectory, along with concerns about its independence amid growing political pressure, could limit the USD's upside. Meanwhile, rising geopolitical tensions—this time along the Thailand-Cambodia border—may lend some support to bullion. Investors now await US Durable Goods Orders data, which could influence the greenback’s direction and provide short-term cues for the XAU/USD pair going into the weekend.
⭐️Personal comments NOVA:
Gold prices are consolidating and starting to fall below 3400 to stabilize. The momentum for an early rate cut is waning.
⭐️SET UP GOLD PRICE:
🔥SELL GOLD zone: 3399- 3401 SL 3406
TP1: $3390
TP2: $3380
TP3: $3370
🔥BUY GOLD zone: $3310-$3312 SL $3305
TP1: $3325
TP2: $3333
TP3: $3345
⭐️Technical analysis:
Based on technical indicators EMA 34, EMA89 and support resistance areas to set up a reasonable SELL order.
⭐️NOTE:
Note: Nova wishes traders to manage their capital well
- take the number of lots that match your capital
- Takeprofit equal to 4-6% of capital account
- Stoplose equal to 2-3% of capital account
