GOLD The Target Is UP! BUY!
My dear followers,
I analysed this chart on GOLD and concluded the following:
The market is trading on 3354.1 pivot level.
Bias - Bullish
Technical Indicators: Both Super Trend & Pivot HL indicate a highly probable Bullish continuation.
Target - 3361.01
Safe Stop Loss - 3350.5
About Used Indicators:
A super-trend indicator is plotted on either above or below the closing price to signal a buy or sell. The indicator changes color, based on whether or not you should be buying. If the super-trend indicator moves below the closing price, the indicator turns green, and it signals an entry point or points to buy.
Disclosure: I am part of Trade Nation's Influencer program and receive a monthly fee for using their TradingView charts in my analysis.
———————————
WISH YOU ALL LUCK
Trend Analysis

gold bearishgold has not respected any support ony to H4 3351.
will it make its way up from here. only candle stick reaction to tell us.
however the safest trade for today to end the week is shorts.

BTCUSD BUYING can expect a bullish move from bitcoin as it has dropped a fair amount and can extract a reversal to the up side due to being oversold
BTC CAN HIT 125K AFTER SHORT CORRECTIONHello friends, Bitcoin has made an incredible climb, carefully looking at the chart and also based on Elliott wave theory, it is clear that Bitcoin is completing submicro wave 4 of micro wave 5, wave 4 is usually an extended wave that covers a large time period with up and down fluctuations, I think the end of submicro wave 4 will be in the 110k-112k range in the four-hour timeframe. I think Bitcoin will break the 25k range in the coming days.

CHECK EURJPY SIGNAL READ THE CAPTAINEntry Point: Around 173.000 172.900
Stop Loss: Around 173.450
🎯 Target Levels
Take Profit 1:
172.450
Take Profit 2:
171.850
last target
171.350

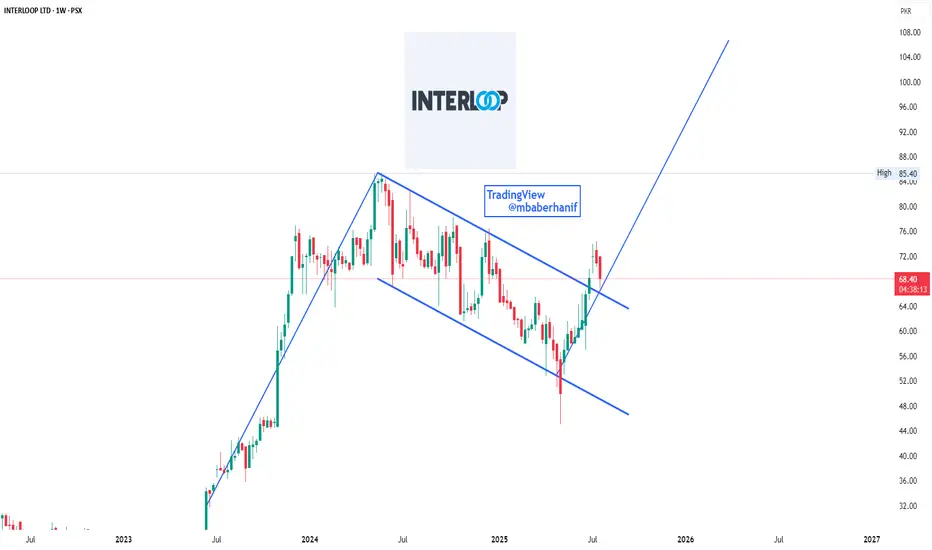
Bullish Flag Breakout on ILP – Next Rally LoadingILP displays a classic bullish flag pattern, typically seen as a continuation signal in technical analysis. After a strong upward rally (the flagpole), the stock entered a downward sloping consolidation channel (the flag). Recently, it has broken out of this pattern, indicating a potential resumption of the prior bullish trend. Although a pullback is currently in play, this retest of the breakout zone may offer a strong support base. If held, the stock could be poised for another impulsive move upward, targeting new highs in the coming months.
CHECK XAUUSD SIGNAL READ THE CAPTAINEntry Point: Around 3356.000 3352.000
Stop Loss: Around 3338.000
🎯 Target Levels
Take Profit 1:
3372.000
Take Profit 2:
3391.000
last target
3410

Gold dips on profit-taking, long-term outlook still bullishGold prices continued to decline this morning as investors locked in profits following the precious metal’s recent rally above $3,400.
In the short term, further downside is possible if profit-taking persists and capital flows shift toward equities, especially as U.S. stock markets hover near record highs. However, gold remains a favored safe-haven asset for the long run amid ongoing global economic and geopolitical uncertainties.
Markets are also turning their focus to the upcoming Federal Reserve policy meeting on July 29–30. While the Fed is expected to hold interest rates steady this time, many investors still anticipate a potential rate cut in September. A low interest rate environment typically supports non-yielding assets like gold.


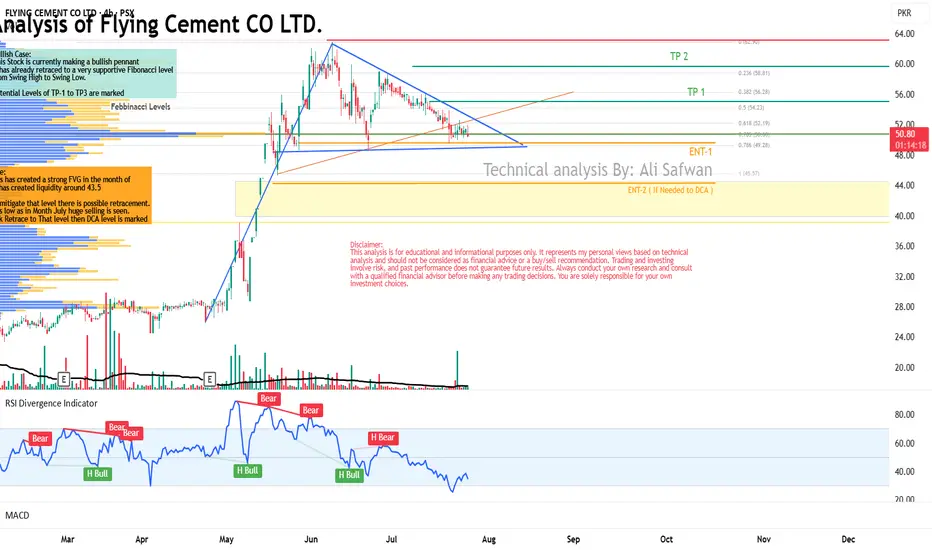
Technical Analysis of Flying Cement CO LTD.Bullish Case:
This Stock is currently making a bullish pennant
it has already retraced to a very supportive Fibonacci level
from Swing High to Swing Low.
Potential Levels of TP-1 to TP3 are marked
Bearish Case:
This Stock is has created a strong FVG in the month of
May which has created liquidity around 43.5
In order to mitigate that level there is possible retracement.
Possibility is low as in Month July huge selling is seen.
Incase Stock Retrace to That level then DCA level is marked
GBPUSD H4 Bullish Reversal Based on the H4 chart analysis, the price is approaching our buy entry level at 1.3404, a pullback support that aligns with the 50% Fib retracement.
Our take profit is set at 1.3555, a pullback resistance.
The stop loss is placed at 1.3404, a swing low support.
High Risk Investment Warning
Trading Forex/CFDs on margin carries a high level of risk and may not be suitable for all investors. Leverage can work against you.
Stratos Markets Limited (tradu.com ):
CFDs are complex instruments and come with a high risk of losing money rapidly due to leverage. 63% of retail investor accounts lose money when trading CFDs with this provider. You should consider whether you understand how CFDs work and whether you can afford to take the high risk of losing your money.
Stratos Europe Ltd (tradu.com ):
CFDs are complex instruments and come with a high risk of losing money rapidly due to leverage. 63% of retail investor accounts lose money when trading CFDs with this provider. You should consider whether you understand how CFDs work and whether you can afford to take the high risk of losing your money.
Stratos Global LLC (tradu.com ):
Losses can exceed deposits.
Please be advised that the information presented on TradingView is provided to Tradu (‘Company’, ‘we’) by a third-party provider (‘TFA Global Pte Ltd’). Please be reminded that you are solely responsible for the trading decisions on your account. There is a very high degree of risk involved in trading. Any information and/or content is intended entirely for research, educational and informational purposes only and does not constitute investment or consultation advice or investment strategy. The information is not tailored to the investment needs of any specific person and therefore does not involve a consideration of any of the investment objectives, financial situation or needs of any viewer that may receive it. Kindly also note that past performance is not a reliable indicator of future results. Actual results may differ materially from those anticipated in forward-looking or past performance statements. We assume no liability as to the accuracy or completeness of any of the information and/or content provided herein and the Company cannot be held responsible for any omission, mistake nor for any loss or damage including without limitation to any loss of profit which may arise from reliance on any information supplied by TFA Global Pte Ltd.
The speaker(s) is neither an employee, agent nor representative of Tradu and is therefore acting independently. The opinions given are their own, constitute general market commentary, and do not constitute the opinion or advice of Tradu or any form of personal or investment advice. Tradu neither endorses nor guarantees offerings of third-party speakers, nor is Tradu responsible for the content, veracity or opinions of third-party speakers, presenters or participants.

XAU/USD(20250725) Today's AnalysisMarket news:
The European Central Bank announced that it would maintain the three key interest rates unchanged, reiterated data dependence, warned that the external environment is highly uncertain, and President Lagarde did not rule out the possibility of future rate hikes. Traders reduced their bets on ECB rate cuts.
Technical analysis:
Today's buying and selling boundaries:
3370
Support and resistance levels
3412
3397
3386
3355
3344
3329
Trading strategy:
If the price breaks through 3370, consider buying in, with the first target price of 3386
If the price breaks through 3355, consider selling in, with the first target price of 3344

AUDJPY: Bullish Structure Shift Signals Institutional Buy ZoneGreetings Traders,
In today’s analysis of AUDJPY, we observe a recent bullish market structure shift (MSS), signaling potential for continued upward movement. With this in mind, we aim to capitalize on buying opportunities at key institutional points of interest to target higher premium prices.
Higher Timeframe Context:
The weekly timeframe maintains a clear bullish narrative. This long-term bias is now supported by a bullish MSS on the H4 timeframe, offering strong confluence and alignment across both macro and intermediate structures. This increases our confidence in expecting further bullish continuation.
Key Observations on H4:
Weekly Fair Value Gap (FVG) Support: Price recently pulled back into a weekly FVG and has rebalanced that inefficiency. This reaction aligns with the H4 MSS, reinforcing the weekly FVG as a strong institutional support zone.
Reclaimed Bullish Order Block: After the MSS, price retraced into a bullish reclaimed order block—an area where previous institutional positioning occurred. Since price has now reclaimed this level, it becomes a high-probability zone for renewed buying interest in the direction of the dominant trend.
Lower Timeframe Confirmation: This reclaimed order block will serve as our primary zone of interest to seek confirmations on the lower timeframes for precise entries.
Trading Plan:
Entry Strategy: Wait for bullish confirmation within the reclaimed H4 order block zone before entering long positions.
Target: The primary objective is the H4 liquidity pool situated at premium prices, which the market is likely to be drawn toward.
For a detailed market walkthrough and in-depth execution zones, be sure to watch this week’s Forex Market Breakdown:
As always, execute with discipline and align your trade management with your overall plan.
Kind Regards,
The Architect 🏛️📈

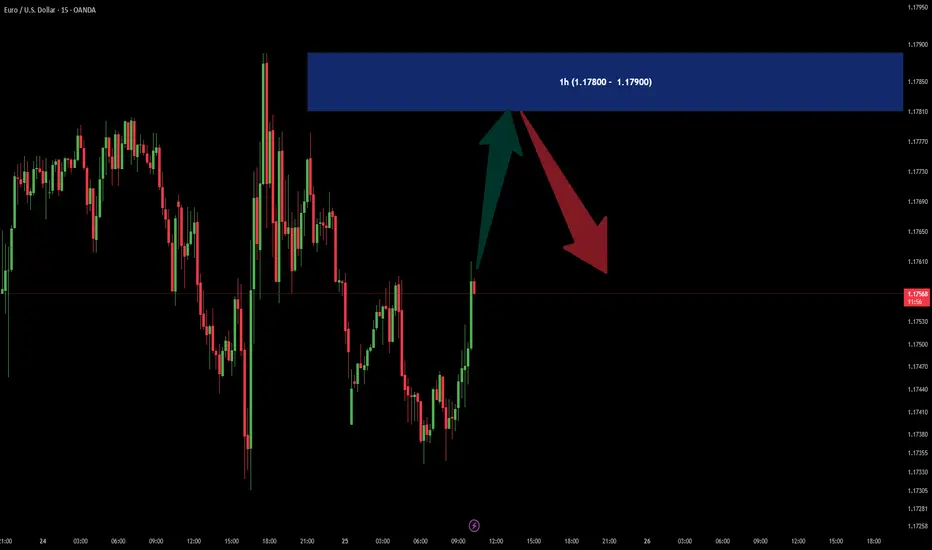
EURUSD SELL OFFERIn 1h time frame there is a SUPPLY area in (1.17800 - 1.17900) price zone.
It could be good for a SELL scalpers.
LONG $WLD MIL:WLD
Price pulled back from the $1.40 resistance and is now reacting to a key demand zone. This area also aligns with the 0.5–0.618 Fib retracement level, where buyers have stepped in previously.
If this support holds, we could see a bounce toward the next major resistance.
Entry Zone: Around $1.08–$1.12
Stop Loss: Below $1.00
Targets:
Target 1: $1.16
Target 2: $1.25
Target 3: $1.33
Target 4: $1.40
Leverage 5X
DYOR, NFA
#TradeSetup #Altseason

XRPEarly Pullback Potential:
Given the overbought RSI (76.45-89.52) and recent 3% price swings, a slight pullback early in the day is plausible, especially during lower-volume pre-market hours before the New York open (8:00 AM EDT). Key support levels to watch are $3.05 (immediate support) and $2.95 (20-day EMA). A drop to $2.90-$2.95 is possible if profit-taking intensifies, as suggested by declining volume and bearish MACD signals.
Pump on New York Open : The New York market open often brings increased liquidity and institutional activity, which could trigger a price pump. XRP’s recent correlation with bullish market sentiment (Fear & Greed Index at 74, Greed) and high futures open interest ($9.25B) supports potential upside. A breakout above $3.25 could target $3.30-$3.50

Will gold continue to fall on July 25?
1. Brief analysis of gold fundamentals
The current gold price is fluctuating downward, and the core driving factors are:
Risk aversion has cooled down:
The United States and Japan reached an agreement on automobile tariffs and promoted an agreement with the European Union, easing previous global trade tensions;
The overall risk appetite of the market has increased, and safe-haven funds have withdrawn from gold.
The US dollar rebounded in stages:
The US dollar index rebounded after the previous decline, which partially offset the safe-haven appeal of gold;
Although there are expectations of interest rate cuts within the Federal Reserve, there are large differences, and the overall trend is still "wait-and-see", which has increased the volatility of the US dollar trend.
2. Technical analysis of gold
Trend characteristics:
Gold has fallen from the high of 3438 and has been under pressure for two consecutive days;
It is currently testing the 0.618 retracement support (about 3360) of the 3310-3438 increase;
The European session continued to fall. If there is a rebound before the US session, there may be a risk of "false breakthrough and real decline";
If the US session still does not rise in the early session, it is necessary to pay attention to the possible V-shaped reversal in the future.
Technical indicators:
The short-term MACD bottom divergence gradually emerges, and the probability of oversold rebound correction increases;
Important support: 3350-3340 range (once lost, it may test the lower track of the 3337 daily triangle);
Key pressure: 3393-3403 range (initial rebound resistance), stronger resistance is around 3416-3418.
III. Short-term operation strategy suggestions
✅ Main idea: shorting on rebound is the main, and long on callback is the auxiliary
Short order layout reference:
If the 3393-3403 area encounters resistance, you can try to short with a light position;
Stop loss is set above 3410, and the target is 3360-3350;
If the market breaks through 3403 strongly and stabilizes, the short order strategy needs to be suspended.
Long position layout reference:
If it drops to 3350-3340 and stabilizes, you can try short-term long with a light position;
Stop loss is set below 3335, and the target is 3375-3385;
If the market quickly breaks below 3337, wait for the lower support to stabilize before intervening.
IV. Trend warning points
If the price does not rebound significantly before the early US market, it is necessary to guard against a sudden V-shaped pull after the US market;
If it directly falls below 3340, the space below opens, it is recommended to stop loss in time and wait for new support points.
✅ Conclusion:
In the short term, gold is still in the downward correction stage, but as the technical oversold signs appear, short-term sharp pull rebound should be guarded against. It is recommended to respond flexibly in operation, pay attention to the response of key support and resistance levels, and avoid chasing up and selling down.
Quick short on the pull back of EURUSDPrice touched a supply zone and formed a break of structure on the 1 hour. I may have missed the entry, but i placed a sell limit with a TP to the imbalance below.

GBP_USD LONG FROM SUPPORT|
✅GBP_USD has been falling recently
And the pair seems locally oversold
So as the pair is approaching
A horizontal support of 1.3399
Price growth is to be expected
LONG🚀
✅Like and subscribe to never miss a new idea!✅
Disclosure: I am part of Trade Nation's Influencer program and receive a monthly fee for using their TradingView charts in my analysis.

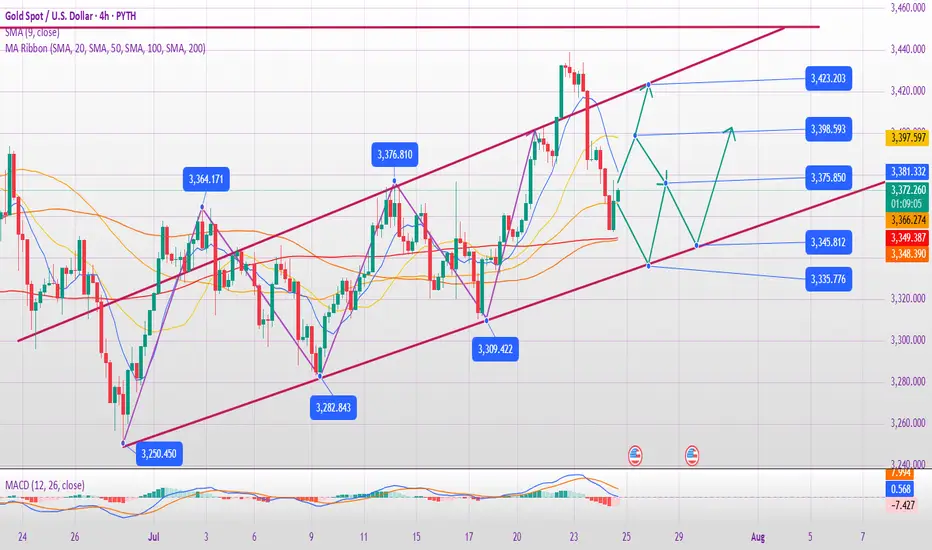
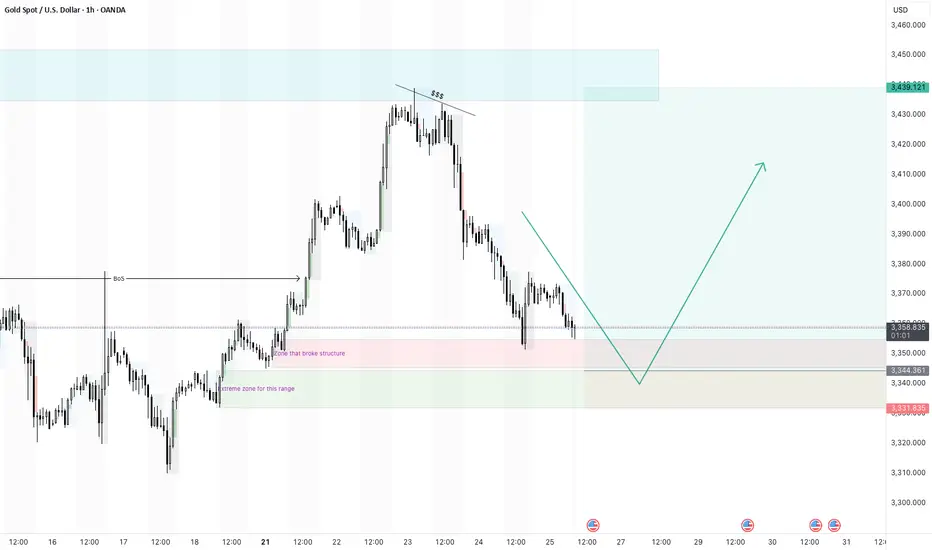
XAUUSD continuation of larger bullish move - 25/7/25Gold did touch the higher timeframe supply zone and pull back. It is now at a point where i am looking for a pivot to form to continue bullish.
I did place a buy limit trade at the extreme zone that started the break of structures.
i will wait a see if it drops and triggers or forms a pivot at the 4H zone that broke structure.
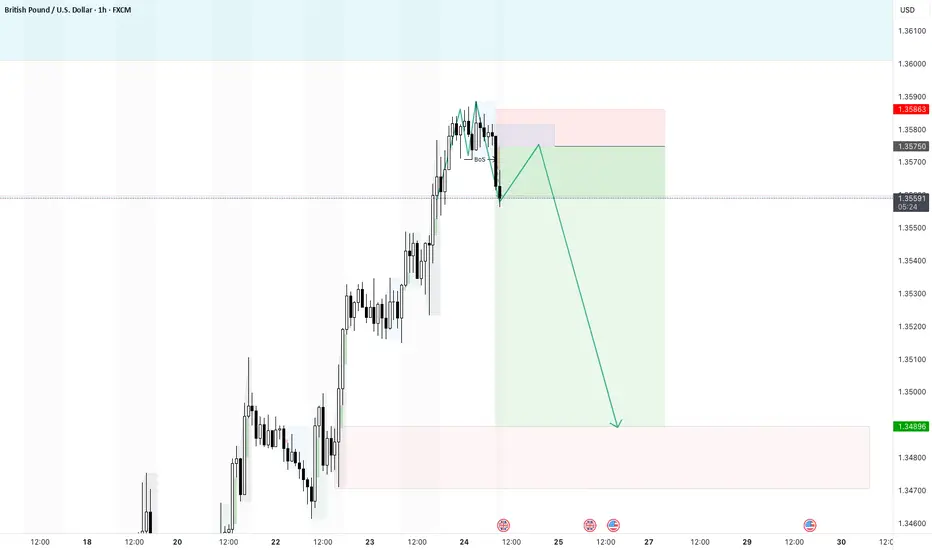
Pull back on GBPUSDThe clear break of structure gives me confidence that a short trade is possible today. Ideally i want a retest of the imbalance and then a push down. My TP is quite far at the moment and i may take profit earlier or move my SL.
USDJPY Breakouts nee level breakouts📊USDJPY Forecast – 4H Timeframe
USDJPY has broken out of the descending channel with bullish momentum and also cleared the key resistance at 147.100 📈
📍 Entry on Retracement:
Waiting for a pullback to the breakout zone for a cleaner entry — structure turning bullish ✅
🎯 Next Resistance / Target Levels:
🔹 147.600
🔹 147.900
🔹 149.000 – key supply zone to watch for reaction
Price action is leading the way — watching for bullish confirmation before continuation
Are you tracking this breakout too? Drop your thoughts below
👍 Like | 🔔 Follow | 💭 Comment for more live trade ideas
#usdjpy

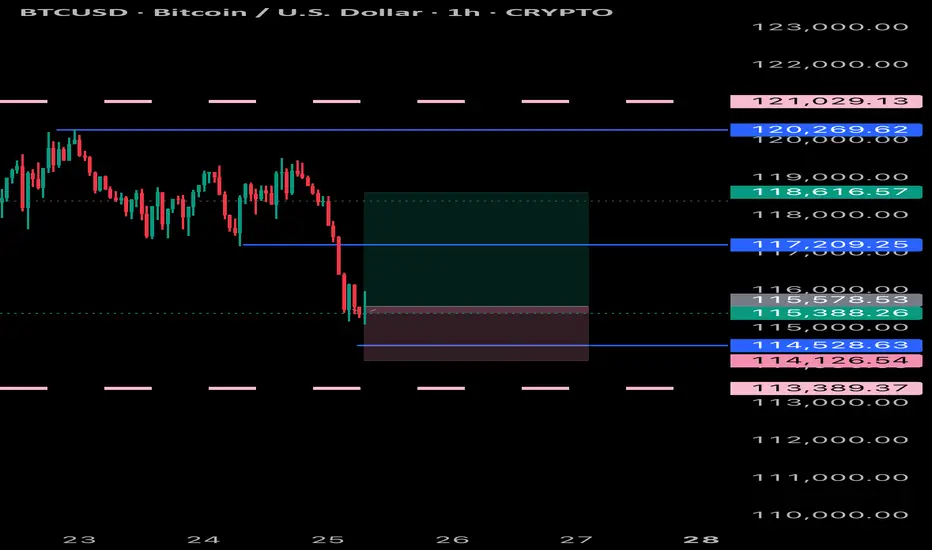
BTCUSD Daily Analysis – Golden Pocket Hold Before a Bullish?🧠 Chart Description & Market Structure:
The BTCUSD daily chart is showing a consolidation phase after forming a local high near $123,231. Currently, the price is retracing and approaching a key Fibonacci retracement zone between the 0.5 level ($115,557) and 0.618 level ($113,740) — also known as the Golden Pocket, which is often a strong reversal area.
---
📈 Bullish Scenario:
If the price holds within or just above the 0.5–0.618 Fibonacci zone (highlighted in yellow) and forms a bullish reversal candlestick (like a hammer, bullish engulfing, or pin bar), there’s a high probability for BTC to resume its uptrend.
Bullish upside targets include:
$119,842 as minor resistance.
$123,231 as the previous swing high and a key breakout confirmation.
A successful break above $123,231 could send BTC toward the next major targets around $128K–$132K.
---
📉 Bearish Scenario:
If the price fails to hold the 0.618 Fibonacci level ($113,740) and breaks down below the key psychological support at $111,500, a deeper correction may occur.
Downside targets:
$108K–$106K as the next major support zone.
A break below this could lead to the formation of a lower high structure and potentially trigger a bearish continuation.
---
📊 Pattern Observations:
Potential Bullish Flag or Rectangle Consolidation: The price action suggests horizontal consolidation after a strong rally — possibly a re-accumulation zone before a bullish continuation.
Golden Pocket Retest: Price is currently testing the Fibonacci 0.5–0.618 zone, often targeted by institutional buyers and technical traders as a potential entry point.
---
🧭 Key Levels to Watch:
Major Resistance: $123,231 (swing high)
Minor Resistance: $119,842
Fibonacci 0.5: $115,557
Fibonacci 0.618: $113,740
Key Support: $111,500
---
🔖 Conclusion:
BTC is currently in a decision zone. Price action within the $115,500–$113,700 range will be crucial. Will this be a healthy retracement before the next leg up — or the beginning of a deeper correction?
#BTCUSD #BitcoinAnalysis #CryptoTA #FibonacciRetracement #CryptoChart #BitcoinDaily #BullishSetup #BearishSetup #CryptoMarket
