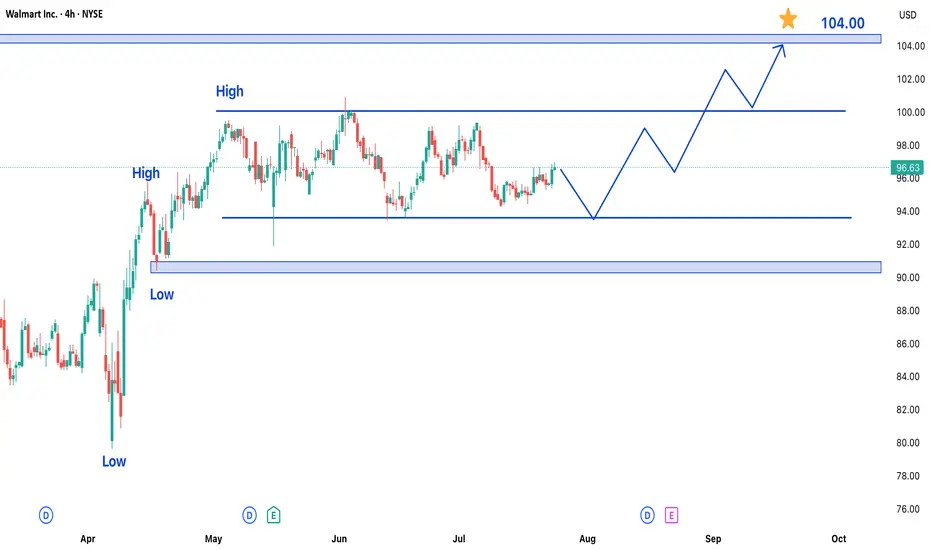
Walmart Stock Trading in Bullish Trend – Upside Potential AheadWalmart Inc. (WMT) shares are currently exhibiting a bullish trend, maintaining upward momentum over recent trading sessions. While the stock has been consolidating in a range over the past few days, the broader outlook remains positive, suggesting potential for further gains in upcoming sessions.
Key Observations:
- Established Uptrend: Walmart's price action reflects sustained buying interest, keeping the stock in a bullish phase.
- Range-Bound Consolidation: Recent sideways movement indicates a temporary pause, often a precursor to the next directional move.
- Strong Support & Resistance Levels: The stock has formed clear reference points for traders to watch.
Price Projections:
- Upside Target at $105: A breakout above the current range could propel WMT toward the $105 resistance level, representing a significant upside opportunity.
- Key Support at $90: On the downside, the $90 level has emerged as a strong support zone. Any pullback is likely to find buying interest near this area.
Market Implications:
1. Bullish Continuation Likely: The consolidation within an uptrend typically resolves in the direction of the prevailing trend—in this case, upward.
2. Breakout Potential: A decisive move above the recent range high could accelerate buying momentum toward $105.
3. Risk Management Consideration: While the bias is bullish, a drop below $90 would signal weakening momentum and potentially invalidate the near-term upside scenario.
Trading Strategy:
- Entry: Consider long positions on a confirmed breakout above the range, or on dips near $90 support.
- Stop Loss: A close below $90 would suggest a trend reversal, warranting exit from bullish positions.
- Target: $105 serves as the primary upside objective, with interim resistance levels to monitor along the way.
Final Thoughts:
Walmart’s stock appears poised for further gains, with $105 as the next key target. Traders should watch for a breakout from the current range while keeping an eye on the $90 support level for risk management. As always, confirmation through price action and volume will be crucial for validating the bullish thesis.
Trend Analysis
AUDJPY: Bullish Structure Shift Signals Institutional Buy ZoneGreetings Traders,
In today’s analysis of AUDJPY, we observe a recent bullish market structure shift (MSS), signaling potential for continued upward movement. With this in mind, we aim to capitalize on buying opportunities at key institutional points of interest to target higher premium prices.
Higher Timeframe Context:
The weekly timeframe maintains a clear bullish narrative. This long-term bias is now supported by a bullish MSS on the H4 timeframe, offering strong confluence and alignment across both macro and intermediate structures. This increases our confidence in expecting further bullish continuation.
Key Observations on H4:
Weekly Fair Value Gap (FVG) Support: Price recently pulled back into a weekly FVG and has rebalanced that inefficiency. This reaction aligns with the H4 MSS, reinforcing the weekly FVG as a strong institutional support zone.
Reclaimed Bullish Order Block: After the MSS, price retraced into a bullish reclaimed order block—an area where previous institutional positioning occurred. Since price has now reclaimed this level, it becomes a high-probability zone for renewed buying interest in the direction of the dominant trend.
Lower Timeframe Confirmation: This reclaimed order block will serve as our primary zone of interest to seek confirmations on the lower timeframes for precise entries.
Trading Plan:
Entry Strategy: Wait for bullish confirmation within the reclaimed H4 order block zone before entering long positions.
Target: The primary objective is the H4 liquidity pool situated at premium prices, which the market is likely to be drawn toward.
For a detailed market walkthrough and in-depth execution zones, be sure to watch this week’s Forex Market Breakdown:
As always, execute with discipline and align your trade management with your overall plan.
Kind Regards,
The Architect 🏛️📈

Gold selling pressure decreased at the end of the week⭐️GOLDEN INFORMATION:
Gold price (XAU/USD) remains under modest pressure during Friday’s Asian session, unable to build on the previous rebound from the mid-$3,300s. Renewed strength in the US Dollar, which extends its recovery from a multi-week low, acts as a headwind for the non-yielding metal. Additionally, fresh optimism surrounding the US-Japan trade agreement has dampened safe-haven demand, keeping gold on the defensive for the third consecutive day.
That said, lingering uncertainty over the Federal Reserve’s rate-cut trajectory, along with concerns about its independence amid growing political pressure, could limit the USD's upside. Meanwhile, rising geopolitical tensions—this time along the Thailand-Cambodia border—may lend some support to bullion. Investors now await US Durable Goods Orders data, which could influence the greenback’s direction and provide short-term cues for the XAU/USD pair going into the weekend.
⭐️Personal comments NOVA:
Gold prices are consolidating and starting to fall below 3400 to stabilize. The momentum for an early rate cut is waning.
⭐️SET UP GOLD PRICE:
🔥SELL GOLD zone: 3399- 3401 SL 3406
TP1: $3390
TP2: $3380
TP3: $3370
🔥BUY GOLD zone: $3310-$3312 SL $3305
TP1: $3325
TP2: $3333
TP3: $3345
⭐️Technical analysis:
Based on technical indicators EMA 34, EMA89 and support resistance areas to set up a reasonable SELL order.
⭐️NOTE:
Note: Nova wishes traders to manage their capital well
- take the number of lots that match your capital
- Takeprofit equal to 4-6% of capital account
- Stoplose equal to 2-3% of capital account

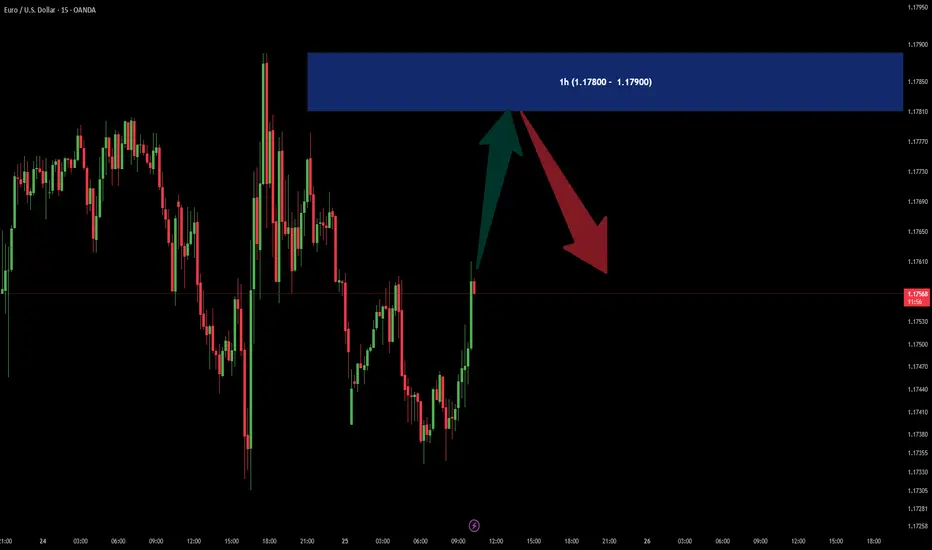
EURUSD SELL OFFERIn 1h time frame there is a SUPPLY area in (1.17800 - 1.17900) price zone.
It could be good for a SELL scalpers.
LONG $WLD MIL:WLD
Price pulled back from the $1.40 resistance and is now reacting to a key demand zone. This area also aligns with the 0.5–0.618 Fib retracement level, where buyers have stepped in previously.
If this support holds, we could see a bounce toward the next major resistance.
Entry Zone: Around $1.08–$1.12
Stop Loss: Below $1.00
Targets:
Target 1: $1.16
Target 2: $1.25
Target 3: $1.33
Target 4: $1.40
Leverage 5X
DYOR, NFA
#TradeSetup #Altseason

XRPEarly Pullback Potential:
Given the overbought RSI (76.45-89.52) and recent 3% price swings, a slight pullback early in the day is plausible, especially during lower-volume pre-market hours before the New York open (8:00 AM EDT). Key support levels to watch are $3.05 (immediate support) and $2.95 (20-day EMA). A drop to $2.90-$2.95 is possible if profit-taking intensifies, as suggested by declining volume and bearish MACD signals.
Pump on New York Open : The New York market open often brings increased liquidity and institutional activity, which could trigger a price pump. XRP’s recent correlation with bullish market sentiment (Fear & Greed Index at 74, Greed) and high futures open interest ($9.25B) supports potential upside. A breakout above $3.25 could target $3.30-$3.50

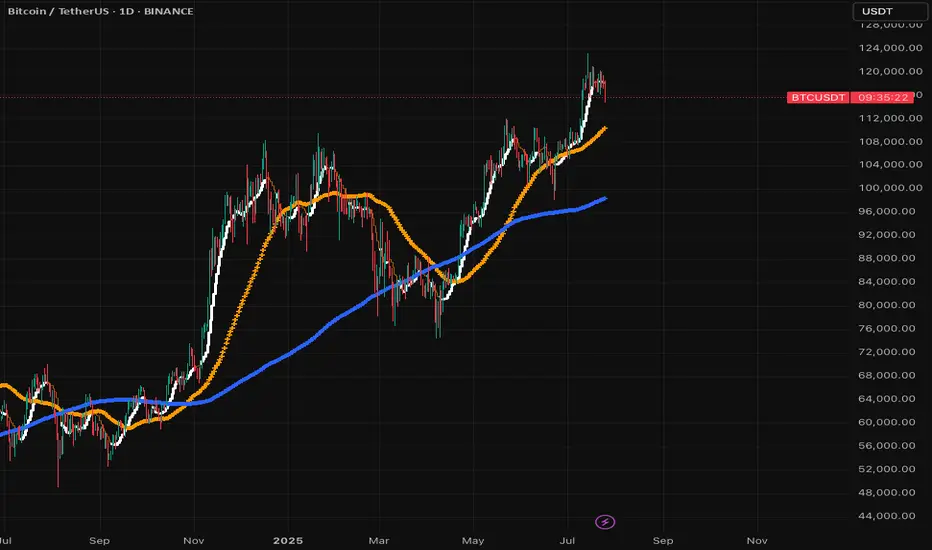
BTC dropping like a brick....bound to happen sooner or laterHard drops follow big spikes. Happens every time, just look back in time. But this time it's different? Maybe to some extent, but as long as there are short term profit takers and insane volatility this trend will continue. Only 2 cents is to not SHORT SELL. You will only contribute to the potential squeeze and will lose money. If you're up now, your priority should be to retain value and sell before it goes down to it's next support level which is under 100k! Maybe it does or not, but the dips do happen and with automated trading bots it could hit more aggressively and faster. If anything, but the dip when there's sufficient support. Best of luck!
ANET new positionStarted a feeler position in ANET today with 110 shares. Sold a low delta covered call and added a CSP on the monthly a bit lower. I believe this will be the range of interest here. I wanted to slowly diversify a bit away from small caps as I have made a lot on the risk account the last two years. Arista is heavily positioned to benefit from energy, cloud, and Ai expansion and it has some of the best growth financials I have ever seen.
My plan:
Repeat covered calls at a lower delta to capture share appreciation.
Buy 100 more shares if it gets closer to 100 and continue to sell CSP

Quick short on the pull back of EURUSDPrice touched a supply zone and formed a break of structure on the 1 hour. I may have missed the entry, but i placed a sell limit with a TP to the imbalance below.

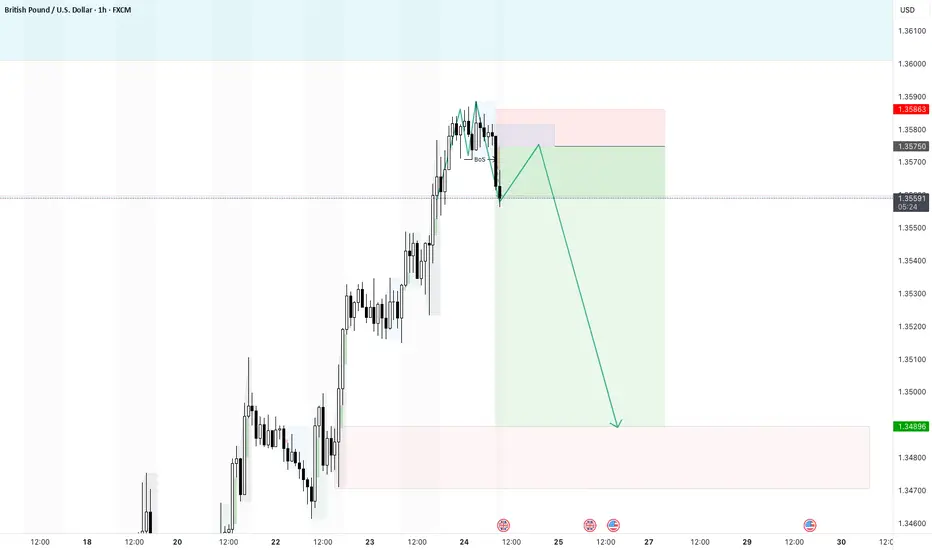
Pull back on GBPUSDThe clear break of structure gives me confidence that a short trade is possible today. Ideally i want a retest of the imbalance and then a push down. My TP is quite far at the moment and i may take profit earlier or move my SL.
USDJPY Breakouts nee level breakouts📊USDJPY Forecast – 4H Timeframe
USDJPY has broken out of the descending channel with bullish momentum and also cleared the key resistance at 147.100 📈
📍 Entry on Retracement:
Waiting for a pullback to the breakout zone for a cleaner entry — structure turning bullish ✅
🎯 Next Resistance / Target Levels:
🔹 147.600
🔹 147.900
🔹 149.000 – key supply zone to watch for reaction
Price action is leading the way — watching for bullish confirmation before continuation
Are you tracking this breakout too? Drop your thoughts below
👍 Like | 🔔 Follow | 💭 Comment for more live trade ideas
#usdjpy

BTCUSD Daily Analysis – Golden Pocket Hold Before a Bullish?🧠 Chart Description & Market Structure:
The BTCUSD daily chart is showing a consolidation phase after forming a local high near $123,231. Currently, the price is retracing and approaching a key Fibonacci retracement zone between the 0.5 level ($115,557) and 0.618 level ($113,740) — also known as the Golden Pocket, which is often a strong reversal area.
---
📈 Bullish Scenario:
If the price holds within or just above the 0.5–0.618 Fibonacci zone (highlighted in yellow) and forms a bullish reversal candlestick (like a hammer, bullish engulfing, or pin bar), there’s a high probability for BTC to resume its uptrend.
Bullish upside targets include:
$119,842 as minor resistance.
$123,231 as the previous swing high and a key breakout confirmation.
A successful break above $123,231 could send BTC toward the next major targets around $128K–$132K.
---
📉 Bearish Scenario:
If the price fails to hold the 0.618 Fibonacci level ($113,740) and breaks down below the key psychological support at $111,500, a deeper correction may occur.
Downside targets:
$108K–$106K as the next major support zone.
A break below this could lead to the formation of a lower high structure and potentially trigger a bearish continuation.
---
📊 Pattern Observations:
Potential Bullish Flag or Rectangle Consolidation: The price action suggests horizontal consolidation after a strong rally — possibly a re-accumulation zone before a bullish continuation.
Golden Pocket Retest: Price is currently testing the Fibonacci 0.5–0.618 zone, often targeted by institutional buyers and technical traders as a potential entry point.
---
🧭 Key Levels to Watch:
Major Resistance: $123,231 (swing high)
Minor Resistance: $119,842
Fibonacci 0.5: $115,557
Fibonacci 0.618: $113,740
Key Support: $111,500
---
🔖 Conclusion:
BTC is currently in a decision zone. Price action within the $115,500–$113,700 range will be crucial. Will this be a healthy retracement before the next leg up — or the beginning of a deeper correction?
#BTCUSD #BitcoinAnalysis #CryptoTA #FibonacciRetracement #CryptoChart #BitcoinDaily #BullishSetup #BearishSetup #CryptoMarket

Gold Analysis and Trading Strategy | July 25✅ Fundamental Analysis:
🔹 Political Pressure on the Federal Reserve Increases Safe-Haven Demand
President Trump made a rare visit to the Federal Reserve, pressuring it to cut interest rates. At the same time, his political allies filed a lawsuit against Fed Chair Jerome Powell, demanding a public meeting. These events have raised concerns over the Fed’s independence and the outlook for U.S. monetary policy, increasing long-term uncertainty. This serves as a medium- to long-term bullish factor for safe-haven assets like gold.
🔹 Rising Geopolitical Tensions Fuel Safe-Haven Demand
The U.S. has withdrawn from the Doha ceasefire negotiations, accusing Hamas of insincerity. Meanwhile, military tensions between Thailand and Cambodia have escalated, with cross-border clashes intensifying. Should the conflict broaden, safe-haven buying of gold could be triggered, further supporting prices.
✅ Technical Analysis:
🔸 On the daily chart, gold has closed lower for two consecutive sessions, forming a “two black crows” pattern—an indication that bearish momentum is gradually taking control and market sentiment is turning pessimistic. Although a short-term consolidation or rebound is possible, the broader trend remains bearish.
🔸 The $3340 level on the daily chart is a key support zone. It marks not only a crucial dividing line for the previous uptrend but also a critical battleground for bulls and bears. If this level holds, a technical rebound could follow; if it breaks, gold may continue its decline toward the $3310 area.
🔴 Resistance Levels: 3373–3375 / 3382–3390
🟢 Support Levels: 3340–3335 / 3330–3310
✅ Trading Strategy Reference:
🔻 Short Position Strategy:
🔰Consider entering short positions in batches if gold rebounds to the 3365-3370 area. Target: 3355-3345;If support breaks, the move may extend to 3340.
🔺 Long Position Strategy:
🔰Consider entering long positions in batches if gold pulls back to the 3335-3340 area. Target: 3365-3375;If resistance breaks, the move may extend to 3380.
🔥Trading Reminder: Trading strategies are time-sensitive, and market conditions can change rapidly. Please adjust your trading plan based on real-time market conditions. If you have any questions or need one-on-one guidance, feel free to contact me🤝

EUR/USD - Sells on H1EUR/USD broke an Ascending Channel and have also shifted the trend downwards.
We will wait for a pullback to 0.5 - 0.618 Fib level for entry with the SL placed above the last high

GOLD - at Cut n Reverse Region, whats next ??#GOLD - market just reached at his ultimate area and keep in mind that if market break his current region than it will go further and nose dive..
NOTE: cut n reverse below our mentioned region..
BTC USDT ANALYSIS CRYPTOCAP:BTC is currently correcting after a long bull ride and knowing your entry level as a trader is very important. Look at this chart and make informed decision

EURUSD: Will Go Up! Long!
My dear friends,
Today we will analyse EURUSD together☺️
The price is near a wide key level
and the pair is approaching a significant decision level of 1.17201 Therefore, a strong bullish reaction here could determine the next move up.We will watch for a confirmation candle, and then target the next key level of 1.17348.Recommend Stop-loss is beyond the current level.
❤️Sending you lots of Love and Hugs❤️

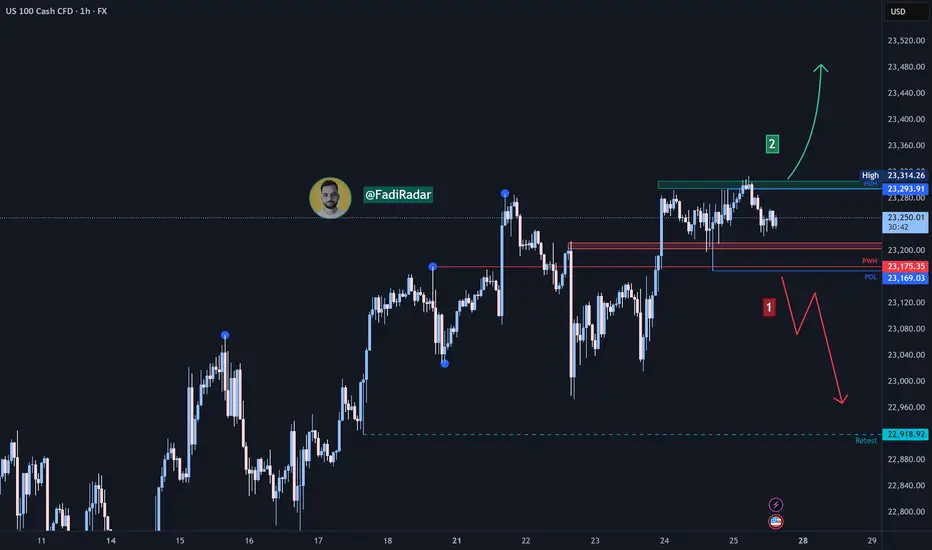
Nasdaq Index (US100 / NASDAQ) Technical Analysis:The Nasdaq index continues its medium- to long-term uptrend. Yesterday, it tested the 23,170$ level and rebounded upward, reaching 23,310$.
🔹 Bearish Scenario:
If the price breaks and closes below 23,200$, it may decline toward 23,000$, followed by 22,920$.
🔹 Bullish Scenario:
If the price holds above 23,300$, the uptrend is likely to continue toward a new high near 23,400$.
⚠️ Disclaimer:
This analysis is for educational purposes only and does not constitute financial advice. Always monitor the markets and perform your own analysis before making any trading decisions.
CHECK GBPJPY SIGNAL UPDATE GO READ CAPTAINEntry Point: Around 198.650 TO 198.550
Take Profit 1: 199.050
Take Profit 2: 199.500
Last Target: 199.900
Stop Loss: 198.050

USDCHF – The Wind Still Blows South!USDCHF remains trapped below the descending trendline since June. Every bullish attempt has been sharply rejected – showing sellers are still in control.
Fresh U.S. data just released:
Jobless claims dropped → strong labor market → Fed likely to keep rates high → USD gains strength.
Manufacturing PMI beat expectations → resilient economy → more reason for a hawkish Fed.
But don’t forget: CHF is attracting safe-haven flows, adding downward pressure on USD!
If price fails to break above 0.7990 and gets rejected at the trendline, a drop toward 0.7890 is likely.
Strategy: Look to SELL around the trendline – follow the trend, not your emotions!

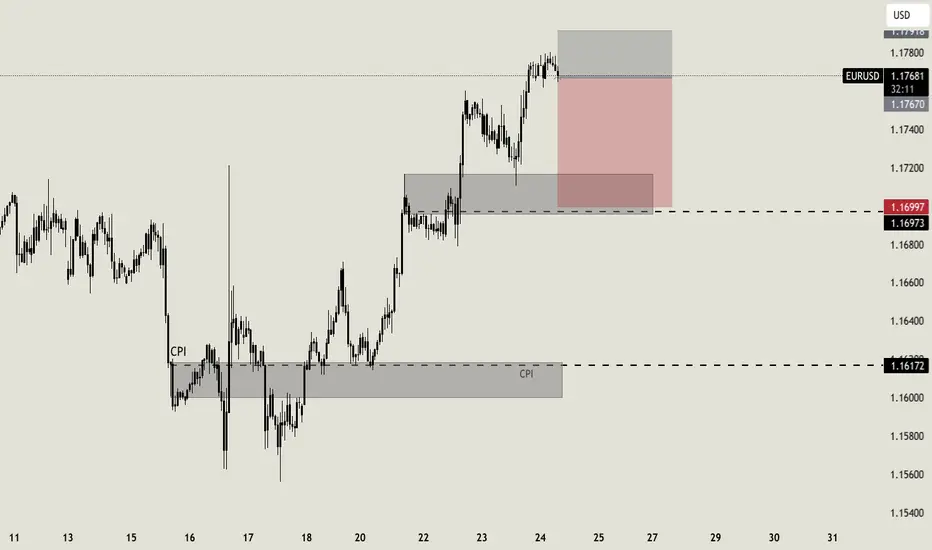
EURUSD Intraweek tradeI know, it's Thursday, but i still think that this can be a good intraweek trade. I expect the price to perform a correction here, till the support area at 1.17. If my analysis is correct i expect the price to be there later today or tomorrow morning
XAU / USD 4 Hour ChartHello traders. Happy Friday. Taking a look at the 4 hour chart, I have marked my current area of interest for potential scalp buy / sell trade set ups for gold today. We are curretnly retesting / revisiting the area where gold originally broke out from. Let's see if we move back up to take out any short positions in profit, or do we keep pushing down and break past the bottom of the channel. Trade the trend and never try to force or rush a trade. Shout out to Big G. Let's see how things play out over the next hour or so. If I take a trade, I will post a chart or update this one. Otherwise, have a great weekend. Be well and trade the trend.

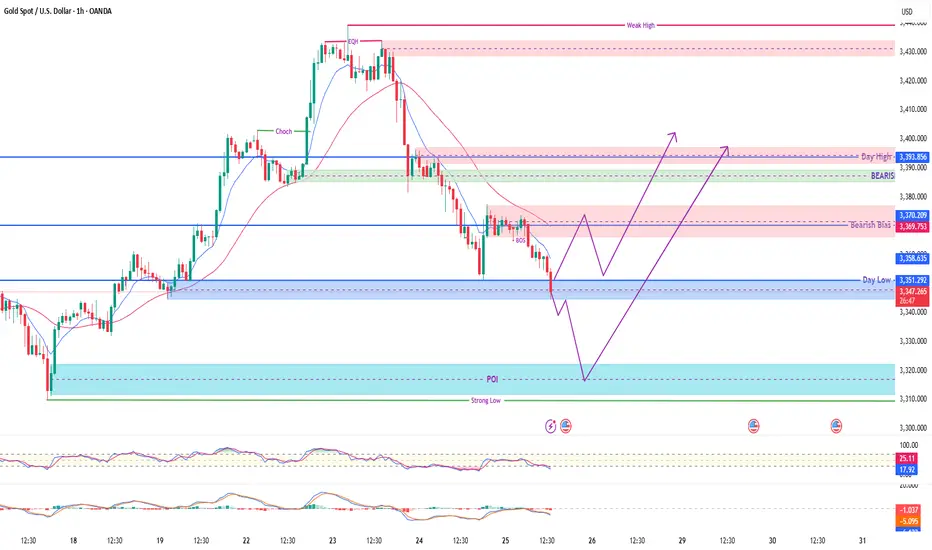
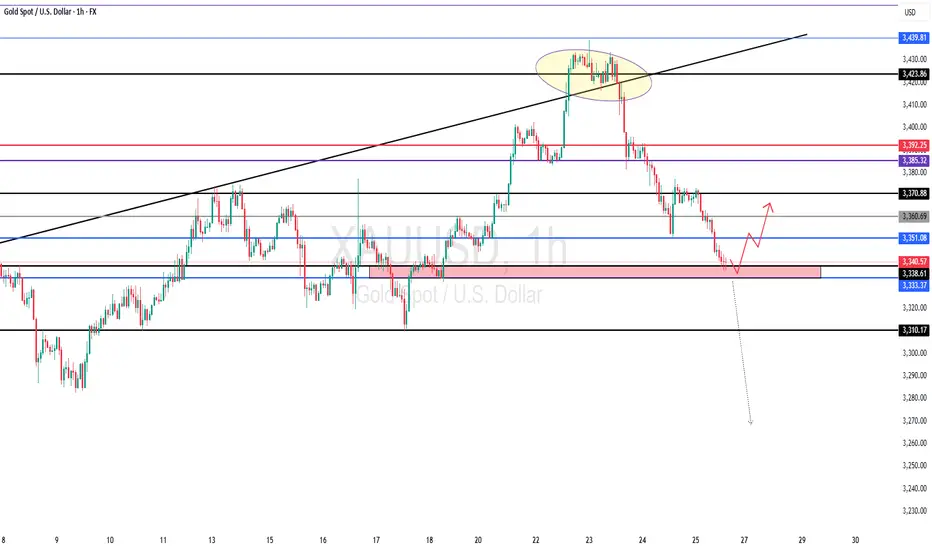
GOLD SPOT STRUCTURAL OUTLOOK & TRADE PLANCurrent Market Overview:
Gold is currently trading around 3345, sitting just above a strong intraday pivot point and previous Day Low support. Price recently experienced a Break of Structure (BOS) confirming bearish pressure from the higher OB (Order Block) and rejection near the bearish breaker zone.
📍 Key Levels to Watch:
🔴 Bearish OB (Resistance): 3369 – 3370
🟣 Bearish Breaker Zone: ~3380
🔵 Day High OB (Major Supply): 3393 – 3395
🟢 POI / Strong Low: 3310 – 3320 (Reversal Zone)
🔵 Day Low & Pivot: 3351 – 3345 (Short-Term Support)
📈 Possible Scenarios:
Scenario A – Bounce from Pivot (Aggressive Entry):
If price respects the pivot at 3345–3351, we may see a short-term bullish reversal toward 3369–3370, with extended targets at the Day High OB.
Scenario B – Deeper Sweep & Bullish Reversal:
A liquidity sweep below 3340 into the POI zone (3310–3320) may offer a premium long opportunity targeting 3370 → 3395.
⚠️ Bias:
🔻 Short-Term Bearish below 3370
🔼 Potential Bullish Reversal from 3320–3350 zones
✅ Technical Confluence:
✅ BOS confirms supply control
✅ POI aligned with historical reaction zones
✅ RSI and MACD showing signs of divergence – early reversal signals
✅ Multiple OBs mapped out for precision entries
🎯 Trade Setup Example (Scenario B):
Buy Limit: 3318
SL: 3305 (Below Strong Low)
TP1: 3370
TP2: 3393 (Day High OB)
Risk-Reward: ~1:4+