SPK Market Update – Key Levels Ahead 🚨 SPK Market Update – Key Levels Ahead 🔄📉📈
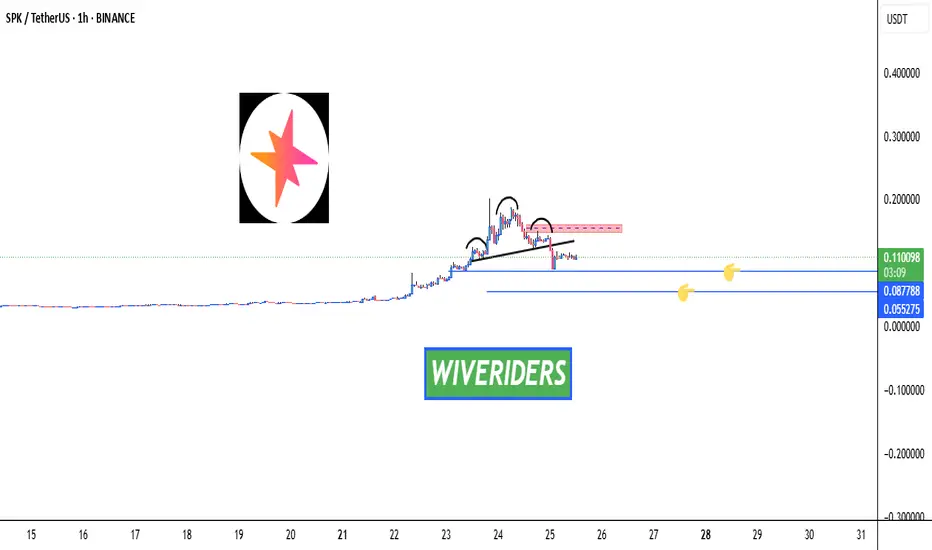
SPK previously formed a bearish Head and Shoulders pattern, which was confirmed by a breakdown. So, what’s next?
🔹 Option 1:
Price could move down to the two blue support levels — these zones may offer potential long entries, as buyers were active here before. Watch for confirmation! 👀
🔺 Option 2:
We also have a red resistance zone, located around the right shoulder of the H&S.
If INDEX:SPK breaks above this zone, it may signal the return of buyers and a potential bullish reversal.
Trend Analysis
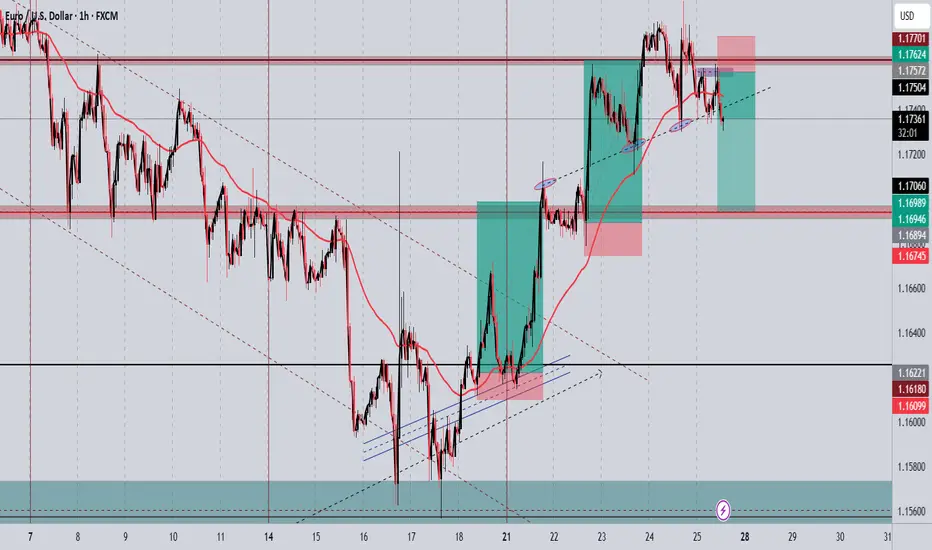
EURUSD | Time For A Pullback?The week kicked off with strong impulsive moves to the upside, leaving no room for deeper correction. Then slowly from Wednesday, we started to see a decline in strength in the bullish run.
Now, with price edging toward the next swing low for a possible bearish change of character, is this a good way to ride the stream to the downside?
Keep your A-game on as we watch price unfold, and trade reactively to price movement.
Do not forget to guard your capitals with risk management.
Good luck traders. 👍
Follow me for more and more of these analyses.
See you on the next one. 🫡


BMRI IDEA PLANDO YOUR OWN RESEARCH!
BMRI will looking for near bottom price which is make a refersal pattern. Still wait the bottom and Buy More and HOLD HOLD!

CONFLUENCE We might see GOLD using this confluence to go up. Gold is currently trending upwards, therefore we might see it continuing with that trend

EUR/USD Short Setup – Bearish Reversal OpportunityPrice has rejected near resistance, forming lower highs.
Potential bearish divergence on momentum indicators (RSI/MACD).
Market sentiment suggests euro strength may be cooling after recent ECB hold.
Dollar shows signs of stabilization, adding downward pressure to the pair.
🔹 Trade Details:
Entry: 1.17572
Take Profit: 1.16946
SHORT ON EUR/NZDEZ Has given a nice CHOC to the downside with plenty of sell side liquidity to be collected.
I will be selling EZ to the next level of demand looking to catch 300-500 pips

GOLD BUYI will be looking for buys as shown on the chart. If you agree, please show some love, and if you disagree, also show some love and let me know why you are not. Happy Trading, Happy Friday.

idea gpbusd Momentum LongWE here in position long based 3 min CHOCH and it reached zone Demmand in H1. i search around 6 to 1 , Best luck Traders

USD/JPY Bearish Setup Activated - Short from 148.00 Zone!💙 USD/JPY Resistance Rejection ! SELL Setup Activated!
👩💻 Dear traders,
USD/JPY is reacting to a strong supply zone between 147.85 – 148.15. After a sharp bullish move, price is showing early signs of rejection from this area — signaling a possible short setup.
Bias – Bearish
🎯 Target – 147.20
🎯 Target – 146.90
🎯 Final Target – 146.30
🛑 Safe Stop Loss – 148.20
📊 Reasoning:
– Price tapped into a clear resistance zone
– Previous rejections seen around the same level
– Two yellow arrows indicate short-term downside path
– Bearish setup forming after exhaustion push
– High R:R potential for intraday traders
🍀 Stay patient, wait for confirmation, and trade the reaction!

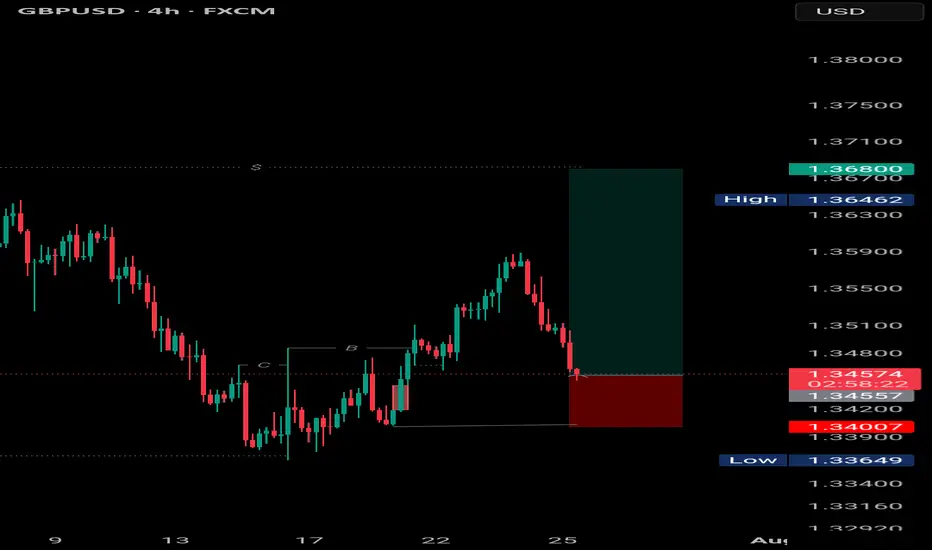
GBPUSD | Bullish Reversal Setup GBPUSD | Bullish Reversal Setup
Price tapped into previous demand zone after forming a clear BOS (Break of Structure). Anticipating a bullish move towards 1.36800.
Entry at key support with a clean RR. Watching closely for momentum confirmation.
#GBPUSD #SmartMoney #ForexTrading #PriceAction #EranseCapital
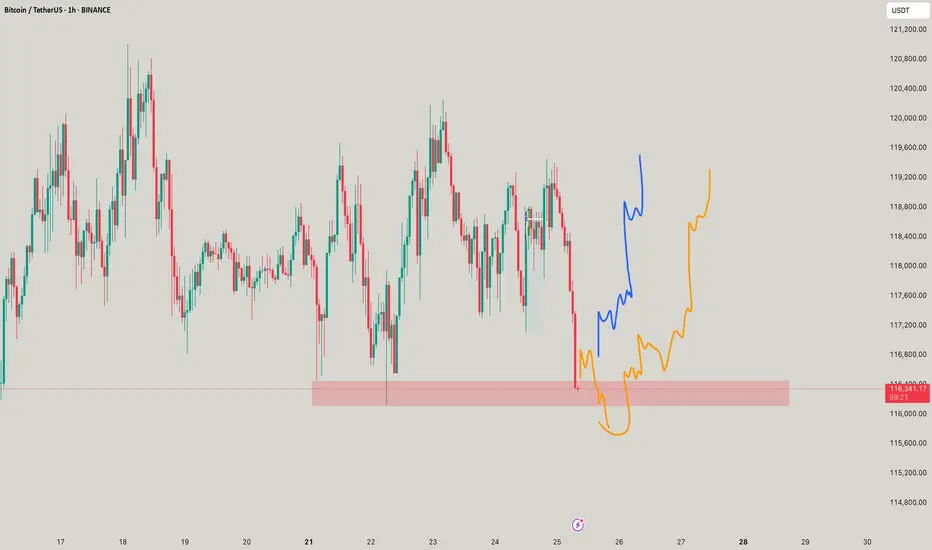
key area for bullsif bulls cant hold this we're going to test previous range VAH which is 110k
holding this will need to reclaim VAL
if it rejects Range VAL as a bearish retest we may lose this area.
if VAH (which is a CME gapfill) wont hold (imo if we go this far down it will nuke) theres a likelyhood to 103k
Im bullish i think we reclaim here but thought is not edge.
for now we have decent oscilator data.
SP will be king here, if it will pump btc will pump also.
i longed here

Looking like an immediate buy on IBM! OptionsMastery:
🔉Sound on!🔉
📣Make sure to watch fullscreen!📣
Thank you as always for watching my videos. I hope that you learned something very educational! Please feel free to like, share, and comment on this post. Remember only risk what you are willing to lose. Trading is very risky but it can change your life!

EURUSD –Bearish Pressure Below 1.1780 |Channel Structure HoldingEURUSD | UPDATE
The price is currently respecting the descending channel, failing to close above the pivot zone (1.1780 – 1.1750) and rejecting from the upper boundary of the structure.
Bias: Bearish While Below 1.1780
As long as price remains under the pivot zone and inside the descending channel, the bearish pressure is likely to persist. A potential correction may retest 1.1750 – 1.1730 levels before continuation.
Next Targets:
1.1700 – Minor support
1.1684 – Short-term level
1.1627 – Mid-target
1.1557 – Main support zone and channel bottom
Invalidation:
Clear breakout and H4 close above 1.1780 would invalidate the short bias and open a path toward 1.1820 and possibly 1.1882.
Structure: Bearish inside descending channel

Gold on the magic level, pullback?Gold reached a key level i was waiting for more than a week. The area from 3325 till 3350 is the real support zone that could lead the price to pullback. In H1 and M15 timeframe i can see a reversal pattern, that let me join this trade with a small risk (due to the RR ratio). I will increase my size if NY will give us a better scalp opportunity

Chart Analysis Gold (XAU/USD)Chart Analysis Gold (XAU/USD)
**Bearish Outlook (Short-Term)**
* **Price is below EMA 7 and EMA 21**, showing short-term bearish momentum.
* Strong **resistance zone** around **\$3,430–\$3,440** was rejected sharply.
* Price has broken below **\$3,405–\$3,395** support and is now **consolidating above \$3,385–\$3,380**, a critical support area.
* Volume is rising on red candles, supporting **selling pressure**.
**Key Support Zone:**
\$3,380 – If broken, next downside targets:
→ **\$3,370**
→ **\$3,360**
*Bullish Scenario (If Support Holds)**
* If **\$3,380** holds and price reclaims above **\$3,395**, a **bounce toward \$3,405–\$3,410** is possible.
* Look for a **break above EMA21 (currently near \$3,402)** for bullish confirmation.

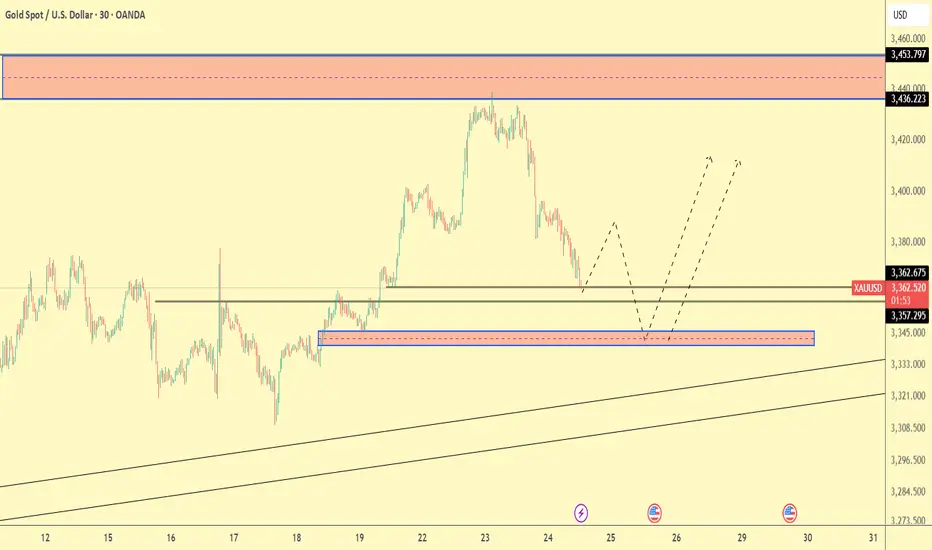
Gold Trade Plan 24/07/2025Dear Traders,
The price is currently near the demand zone in the range of 3358-3362. If the price holds above the support line, it could rise towards the 3388-3390 zone and then enter a correction again. However, if the 3362-3358 zone is broken, I expect a drop towards around 3350, followed by a potential rise towards the 3400 zone.
regards,
Alireza!
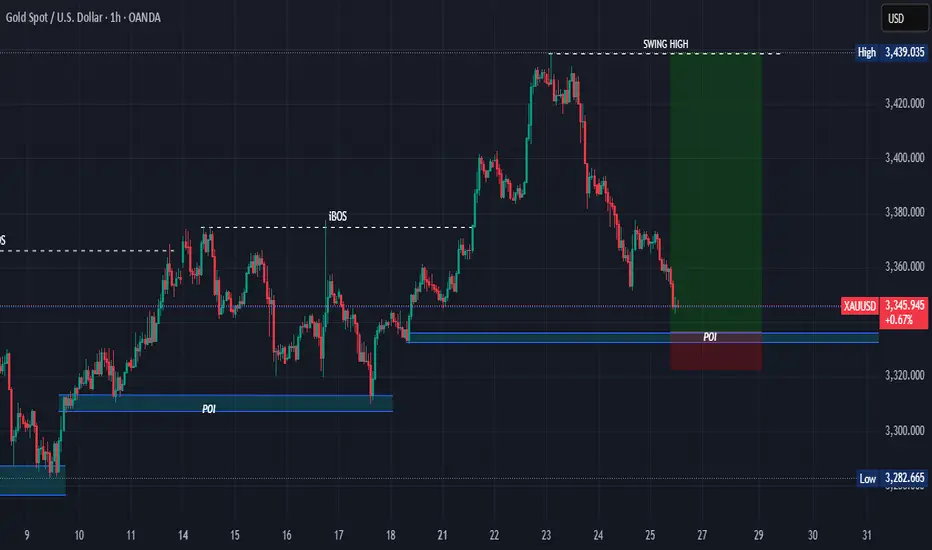
XAU/USD 25 July 2025 Intraday AnalysisH4 Analysis:
-> Swing: Bullish.
-> Internal: Bullish.
You will note that price has targeted weak internal high on three separate occasions which has now formed a triple top, this is a bearish reversal pattern and proving this zone is a strong supply level. This is in-line with HTF bearish pullback phase.
Remainder of analysis and bias remains the same as analysis dated 23 April 2025.
Price has now printed a bearish CHoCH according to my analysis yesterday.
Price is now trading within an established internal range.
Intraday Expectation:
Price to trade down to either discount of internal 50% EQ, or H4 demand zone before targeting weak internal high priced at 3,500.200.
Note:
The Federal Reserve’s sustained dovish stance, coupled with ongoing geopolitical uncertainties, is likely to prolong heightened volatility in the gold market. Given this elevated risk environment, traders should exercise caution and recalibrate risk management strategies to navigate potential price fluctuations effectively.
Additionally, gold pricing remains sensitive to broader macroeconomic developments, including policy decisions under President Trump. Shifts in geopolitical strategy and economic directives could further amplify uncertainty, contributing to market repricing dynamics.
H4 Chart:
M15 Analysis:
-> Swing: Bullish.
-> Internal: Bullish.
H4 Timeframe - Price has failed to target weak internal high, therefore, it would not be unrealistic if price printed a bearish iBOS.
The remainder of my analysis shall remain the same as analysis dated 13 June 2025, apart from target price.
As per my analysis dated 22 May 2025 whereby I mentioned price can be seen to be reacting at discount of 50% EQ on H4 timeframe, therefore, it is a viable alternative that price could potentially print a bullish iBOS on M15 timeframe despite internal structure being bearish.
Price has printed a bullish iBOS followed by a bearish CHoCH, which indicates, but does not confirm, bearish pullback phase initiation. I will however continue to monitor, with respect to depth of pullback.
Intraday Expectation:
Price to continue bearish, react at either M15 supply zone, or discount of 50% internal EQ before targeting weak internal high priced at 3,451.375.
Note:
Gold remains highly volatile amid the Federal Reserve's continued dovish stance, persistent and escalating geopolitical uncertainties. Traders should implement robust risk management strategies and remain vigilant, as price swings may become more pronounced in this elevated volatility environment.
Additionally, President Trump’s recent tariff announcements are expected to further amplify market turbulence, potentially triggering sharp price fluctuations and whipsaws.
M15 Chart:

SOLUSD at Strong SUPPORT SOLUSD was trading down trend the and is current at the support which was its resistance earlier and this is a strong support and expect further growth or up movement of for SOL. 2010-215.

XAUUSD For Swing Trade It has broken out of a symmetrical triangle and looking good for a swing trade.

BTC - Nuke down to 104k?Hahhaa noo, but payttern shall commence in orange for a good move altogether!