XAU/USD 25 July 2025 Intraday AnalysisH4 Analysis:
-> Swing: Bullish.
-> Internal: Bullish.
You will note that price has targeted weak internal high on three separate occasions which has now formed a triple top, this is a bearish reversal pattern and proving this zone is a strong supply level. This is in-line with HTF bearish pullback phase.
Remainder of analysis and bias remains the same as analysis dated 23 April 2025.
Price has now printed a bearish CHoCH according to my analysis yesterday.
Price is now trading within an established internal range.
Intraday Expectation:
Price to trade down to either discount of internal 50% EQ, or H4 demand zone before targeting weak internal high priced at 3,500.200.
Note:
The Federal Reserve’s sustained dovish stance, coupled with ongoing geopolitical uncertainties, is likely to prolong heightened volatility in the gold market. Given this elevated risk environment, traders should exercise caution and recalibrate risk management strategies to navigate potential price fluctuations effectively.
Additionally, gold pricing remains sensitive to broader macroeconomic developments, including policy decisions under President Trump. Shifts in geopolitical strategy and economic directives could further amplify uncertainty, contributing to market repricing dynamics.
H4 Chart:
M15 Analysis:
-> Swing: Bullish.
-> Internal: Bullish.
H4 Timeframe - Price has failed to target weak internal high, therefore, it would not be unrealistic if price printed a bearish iBOS.
The remainder of my analysis shall remain the same as analysis dated 13 June 2025, apart from target price.
As per my analysis dated 22 May 2025 whereby I mentioned price can be seen to be reacting at discount of 50% EQ on H4 timeframe, therefore, it is a viable alternative that price could potentially print a bullish iBOS on M15 timeframe despite internal structure being bearish.
Price has printed a bullish iBOS followed by a bearish CHoCH, which indicates, but does not confirm, bearish pullback phase initiation. I will however continue to monitor, with respect to depth of pullback.
Intraday Expectation:
Price to continue bearish, react at either M15 supply zone, or discount of 50% internal EQ before targeting weak internal high priced at 3,451.375.
Note:
Gold remains highly volatile amid the Federal Reserve's continued dovish stance, persistent and escalating geopolitical uncertainties. Traders should implement robust risk management strategies and remain vigilant, as price swings may become more pronounced in this elevated volatility environment.
Additionally, President Trump’s recent tariff announcements are expected to further amplify market turbulence, potentially triggering sharp price fluctuations and whipsaws.
M15 Chart:
Trend Analysis

potential here with a bearish moveThis is a continuation pattern to the downside that we are watching for a good short entry on. It could still push up to around 201.125 ish area, so no move yet, just on the radar.

XAUUSD For Swing Trade It has broken out of a symmetrical triangle and looking good for a swing trade.


GBPUSD LongWe are in a key Fibonacci Level, Where it falls in line with a fair value gap. We are Looking to Go long to the yesterdays high of 1.35880. Lets see how it goes

#3,377.80 Resistance remains strongMy position: I have Bought Gold many times above #3,400.80 benchmark however as it got invalidated, I Bought #3,390.80 again late U.S. session and closed my set of Buying orders on #3,395.80 nearby extension. I left one runner (#3,390.80 entry point) with Stop on breakeven expecting Asian session to recover #3,400.80 benchmark, however it was closed on break-even as Gold extended Selling sequence. I will continue Selling every High's on Gold and if #3,357.80 gives away, expect #3,352.80 and #3,342.80 contact points to be met.
As expected Gold delivered excellent #3,372.80 and especially #3,365.80 - #3,352.80 Selling opportunities throughout yesterday's session which I utilized to it's maximum. I have also Bought Gold on late U.S. session with #3,372.80 as an entry point / however since Gold was ranging, I closed my order on break-even and met Gold below #3,352.80 benchmark this morning personally on my surprise (I did expected #3,377.80 to be invalidated to the upside).
Technical analysis: Gold’s Price-action is performing well below both the Hourly 4 chart’s and Daily chart’s Resistance zones for the cycle. Selling direction of today’s session is directly correlated with Fundamentals leaving the scene which found Sellers near the Intra-day #3,377.80 Resistance and most likely DX will close the Trading week in green, however struggling to make Bullish comeback and if #3,327.80 - #3,342.80 reverses the Selling motion, Gold’s Daily chart’s healthy Technicals which preserved core uptrend values. If the Price-action gets rejected at #3,352.80 - #3,357.80 Resistance zone, then further decline (under conditions where I will have more information with U.S.’s session candle) is possible and cannot be ruled out. Notice that at the same time and manner, Bond Yields are on consecutive Selling spree as well which Fundamentally has a diagonal correlation with Gold. The slightest uptrend continuation there, should add enormous Selling pressure on Gold.
My position: I am Highly satisfied with recent results and will take early weekend break (no need to Trade more). If however you decide to Trade today, Sell every High's on Gold / no Buying until Monday's session (my practical suggestion).

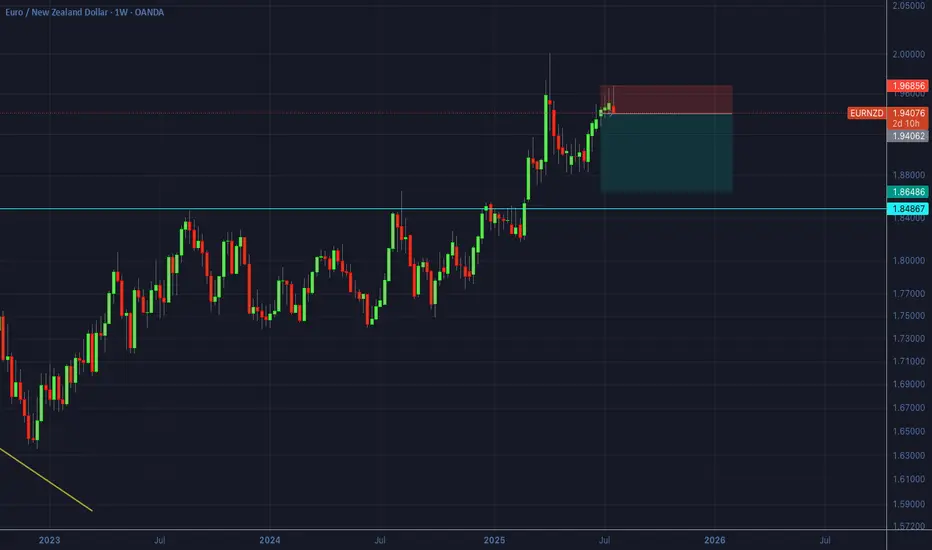
EURNZD - Weekly shortFor those who want to try and keep a weekly operation, this is a potential candidate.
Levels on the chart. Remember that whether you are intra day trading or trading daily and weekly swings, money management rules do not change: should the be hit, that loss should not be greater than 0.5 or 1% of your free equity, so calculate your position size accordingly.
GBPUSD Long, 25 JulyHigh Risk HL Play from 5m OB + D EMA Support
We’re reacting off a Daily Bearish OB, but price got rejected precisely into the D 50EMA, creating a potential HL. Confluence comes from DXY aligning for a bounce and a 5m OB entry on GU, even though LTF structure isn’t ideal.
📈 HTF Confluence:
✅ Rejection from Daily OB → back to D 50EMA
🔄 Trend unclear, but EMA tap suggests short-term buy opportunity
📍 EMA sits right in the same zone as our LTF POI → stacked confluence
📉 LTF Context:
✅ Asia range formed
✅ DXY also in its Asia + 15m POI zone → supports GU long bias
❌ No LTF BOS or strong structure shift on GU yet
🎯 D Imbalance on GU still unfilled = TP area
🎯 Entry Plan:
✅ 50% position already in from 5m OB tap, which aligns with HTF EMA + DXY 15m POI
⏳ Waiting for 1m BOS to confirm the rest of the entry
❗ This is the last unmitigated OB before invalidation – strong RR if it holds
🛡 SL: Placed below 5m OB to protect structure
📌 TP: D Imbalance above, aligns well with a clean 1:5 RR, but will take partials at asia high or 1:3

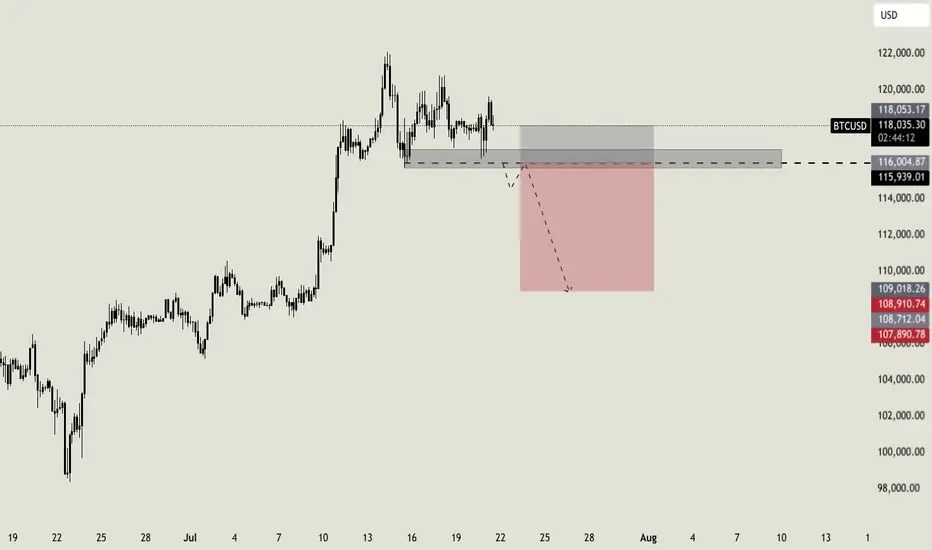
Bitcoin short setupBTC is ranging on top, this means next leg is preparing. Most traders are positioned long, that's why i think price will sink after a break below my key area. I will wait a break and a retrace before entering short, targeting the $109.000 area

Gold – 25 July: Watching M15 Demand for Bullish Reversal📍 Gold – 25 July Outlook
Early Signs of Reversal from H4 OB Zone – Wait for Clear Continuation
🔍 Market Recap & Context:
Yesterday, the H4 Order Block zone (3359–3345) was retested and showed signs of holding. A visible M15 structure shift (ChoCH) suggests the market may be preparing to resume the uptrend.
However, the M15 Break of Structure (BoS) has not yet occurred — so this is not a confirmed reversal .
📍 Current Zone to Watch:
M15 Demand Zone: 3359.5 – 3351.5
Price is retracing into this zone. If respected, it could be the base for the next bullish leg.
📌 Trade Setup Possibility:
If price holds the M15 demand zone and M1 gives confirmation (e.g., micro-ChoCH + micro-BoS , a long trade could be considered.
But keep in mind — this would be an aggressive entry , because the M15 BoS is still pending.
This setup would rely on:
• Candlestick behavior
• Volume spikes or reaction
• Price action psychology
✅ Strategy Note:
Wait for signals like:
– Bullish engulfing on M1 or M5
– Micro ChoCH + demand hold
– Volume absorption or imbalance reaction
Only act if the market shows strength — not just a zone tap.
📝 Summary:
• Bias: Early bullish reversal watch
• Zone in Play: 3359.5–3351.5 (M15 demand)
• Confirmation: M1 LTF shift + strong candlesticks
• Caution: No M15 BoS yet — be precise and patient
• Risk Management: 1:3 RR — 40 pip SL / 120 pip TP
Let the chart speak first — observe with stillness, execute with precision.
📘 Shared by @ChartIsMirror

US30 bearish setup; Price at key resistance _ Target at 44400Technically, US30 price is currently challenging a significant resistance level at 44830. This area has historically been a strong turning point, suggesting a potential reversal. Our entry at 44830 is positioned to capitalize on a confirmed rejection from this level. The stop loss at 44952 provides a tight risk management, placed just above the resistance to invalidate the setup if price breaks higher. The target at 44400 aligns with a prior key support level, representing a likely area for profit taking as the market corrects.
Fundamentally, While the long term outlook for US equities remains largely positive, recent economic indicators suggest some short term headwinds. Reports of a potential slowdown in the services sector and cautious rhetoric from central banks regarding interest rates are creating an environment ripe for profit taking in overextended markets. Additionally, ongoing discussions around trade tariffs introduce a layer of uncertainty that could dampen investor sentiment, providing a fundamental justification for a temporary pullback from current highs.
Entry: Sell at 44824
Stop Loss: 44952
Target: 44400
This is for educational purposes, not a financial advice.

GBPUSD ENTRY CHARTOn this Pair, We are bullish, as the Dollar is still weak and the POUNDS DOLLAR is still in an UPTREND, on the HTF and the MID-TERM-TF, also on the Hourly, we got a Zone with additional confluences that are in align with the Trend, then on our Entry TF, We got a Sweep of LIQ, BOS and IND close to our POI, so we are IN, and if this matches with your TRADE IDEA, i advise you add a good risk management to manage your Trade, THANK YOU.

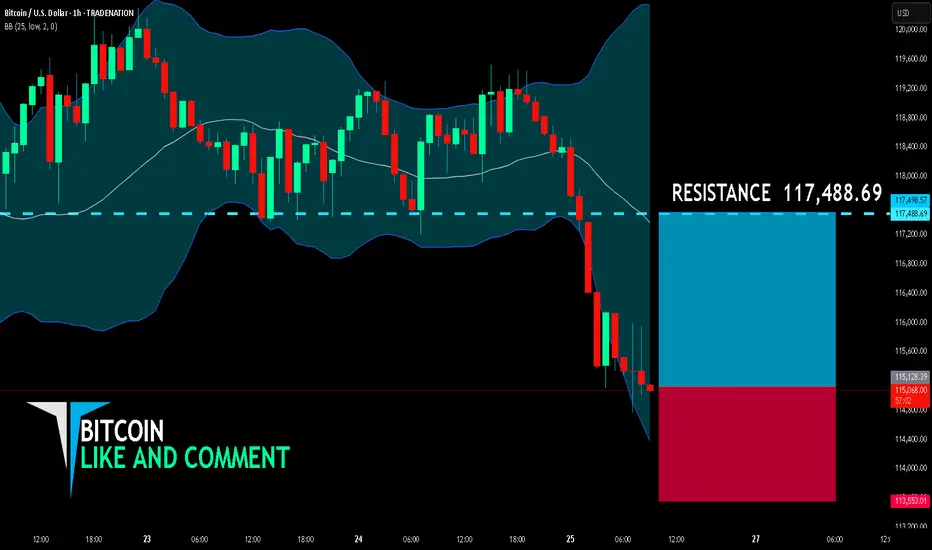
BITCOIN BULLS ARE GAINING STRENGTH|LONG
BITCOIN SIGNAL
Trade Direction: long
Entry Level: 115,128.39
Target Level: 117,488.69
Stop Loss: 113,553.01
RISK PROFILE
Risk level: medium
Suggested risk: 1%
Timeframe: 1h
Disclosure: I am part of Trade Nation's Influencer program and receive a monthly fee for using their TradingView charts in my analysis.
✅LIKE AND COMMENT MY IDEAS✅
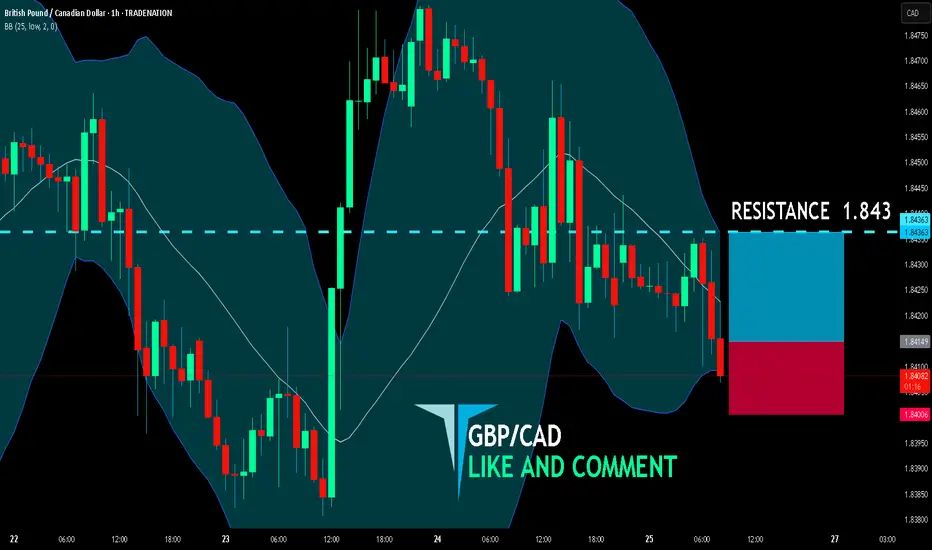
GBP/CAD BUYERS WILL DOMINATE THE MARKET|LONG
GBP/CAD SIGNAL
Trade Direction: long
Entry Level: 1.841
Target Level: 1.843
Stop Loss: 1.840
RISK PROFILE
Risk level: medium
Suggested risk: 1%
Timeframe: 1h
Disclosure: I am part of Trade Nation's Influencer program and receive a monthly fee for using their TradingView charts in my analysis.
✅LIKE AND COMMENT MY IDEAS✅
350pips Secured — Focus Shifts to Dip-Buying StrategyToday's trading was very successful, and the grasp of the long and short rhythm was very accurate. Today's trading situation is as follows:
1. Close the short position with an overnight entry price of around 3386 near 3380, with a loss of 60 pips, and the loss amount exceeded $6K;
2. Directly short gold near 3380, manually close the position near 3366, profit 130pips, profit amount exceeded $12K;
3. Long gold near 3356, hit TP: 3372 and end the transaction, profit 160pips, profit amount exceeded $8K;
4. Long gold near 3362, hit TP; 3375 and end the transaction, profit 120pips, profit amount exceeded $6K.
Intraday trading summary: Today, the long and short sides completed a total of 4 transactions, one of which suffered a loss, but the net profit was 350pips, and the profit amount exceeded $20K. For short-term trading, I think I can submit a satisfactory answer to myself today!
How to execute the transaction next? Gold started to pull back from around 3438 and has now reached a low of around 3351, with a retracement of more than 870pips. The retracement space is not small. However, gold has stabilized above 3350 and has started a technical rebound repair, and the upward force is not weak, so gold may have completed the retracement. Under the support of these two technical conditions, gold may regain its upward momentum and hit 3400 again.
At present, the short-term resistance is obvious, located in the area near 3380. Once gold breaks through 3380, gold will inevitably continue to rise and hit 3400 again; but I think as long as gold stabilizes above 3350, it is not difficult to break through the short-term resistance of 3380, so gold will inevitably test the 3400 mark again; and the short-term support below is in the 3365-3355 area. Gold may still retreat to this area first during the rise in order to increase liquidity and accumulate momentum, helping gold to break through 3380 more easily.
So for the next short-term trading, I think it is feasible to go long on gold in the 3365-3355 area, first looking at the target area of 3380-3390, and then 3400.

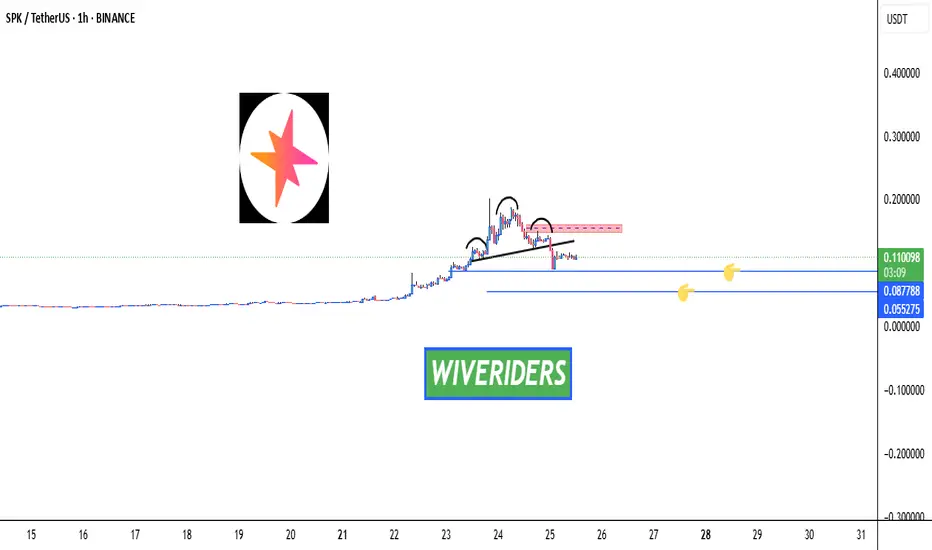
SPK Market Update – Key Levels Ahead 🚨 SPK Market Update – Key Levels Ahead 🔄📉📈
SPK previously formed a bearish Head and Shoulders pattern, which was confirmed by a breakdown. So, what’s next?
🔹 Option 1:
Price could move down to the two blue support levels — these zones may offer potential long entries, as buyers were active here before. Watch for confirmation! 👀
🔺 Option 2:
We also have a red resistance zone, located around the right shoulder of the H&S.
If INDEX:SPK breaks above this zone, it may signal the return of buyers and a potential bullish reversal.
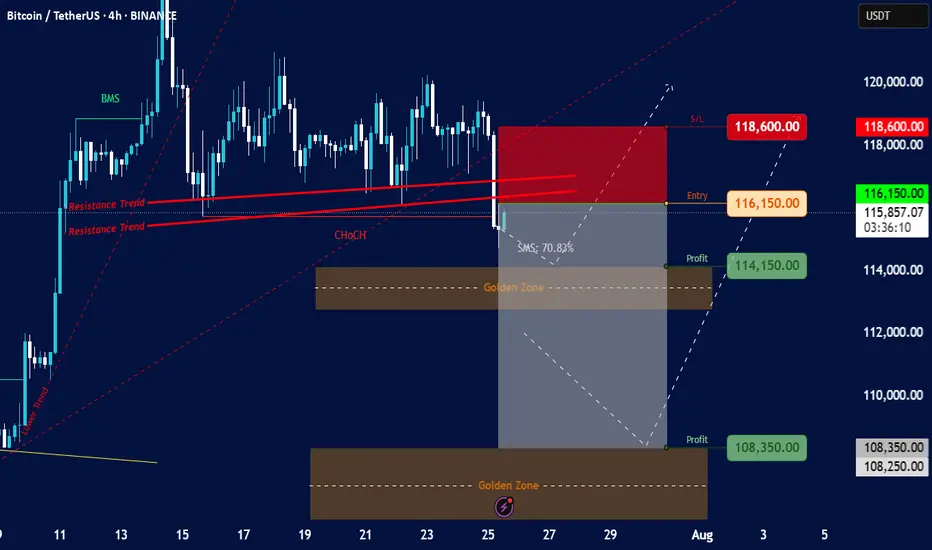
Bitcoin/TetherUS (BTC/USDT) on a 4-hour timeframeOverall Trend & Price Action:
Prior Uptrend: The chart shows a clear uptrend leading up to around July 15th, marked by an "Order Trend" line (dashed green).
Break of Market Structure (BMS): A "BMS" (Break of Market Structure) label is visible, suggesting a significant shift in market dynamics, likely indicating the end of the previous uptrend or a strong pullback.
Consolidation/Distribution: After the initial uptrend, the price appears to have entered a period of consolidation or potential distribution between approximately $115,000 and $120,000.
Resistance Trends: Several "Resistance Trend" lines (red) are drawn, indicating areas where the price has faced selling pressure. A recent breakdown below these resistance lines is evident.
Change of Character (ChoCH): A "ChoCH" label is present, which often signifies a change in the prevailing market sentiment or trend, confirming the shift away from the strong bullish momentum.
Current Price & Trading Setup:
Current Price: The current price is around $115,849.44.
Proposed Entry: The chart suggests an "Entry" point at $116,150.00. This is positioned just above the current price and within a potential retest zone of the broken resistance.
Stop Loss (S/L): The "S/L" is set at $118,600.00, indicating a risk management level if the trade goes against the intended direction.
Profit Targets (Profit):
First Profit Target: $114,150.00, located just above the first "Golden Zone."
Second Profit Target: $108,350.00, situated within the second "Golden Zone."
Golden Zones: Two "Golden Zones" (brown shaded areas) are identified, which are typically areas of significant support/demand or Fibonacci retracement levels where price is expected to react. The current setup seems to target these zones for profit-taking.
SMS: 70.83%: This "SMS" value (likely referring to "Smart Money Score" or a similar metric) of 70.83% suggests a strong bearish bias or conviction in the current setup.
Interpretation & Potential Strategy:
The analysis suggests a bearish trading setup for BTC/USDT.
The presence of BMS, ChoCH, and the breakdown below resistance trends indicate a potential shift from bullish to bearish sentiment or a significant correction.
The proposed short entry at $116,150.00 aims to capitalize on further downward movement.
The profit targets align with identified "Golden Zones," suggesting that these are anticipated areas of support where the bearish momentum might temporarily stall or reverse.
The significant "SMS" value reinforces the bearish outlook.
Risks & Considerations:
Reversal from Golden Zones: While profit targets are set at Golden Zones, these are also potential areas for price reversals if strong buying interest emerges.
False Breakout/Breakdown: The market can always surprise, and a re-entry above the stop-loss level would invalidate the current bearish setup.
Market Volatility: Cryptocurrency markets are highly volatile, and rapid price movements can occur.
News Events: Unforeseen news or macroeconomic events could significantly impact price action.
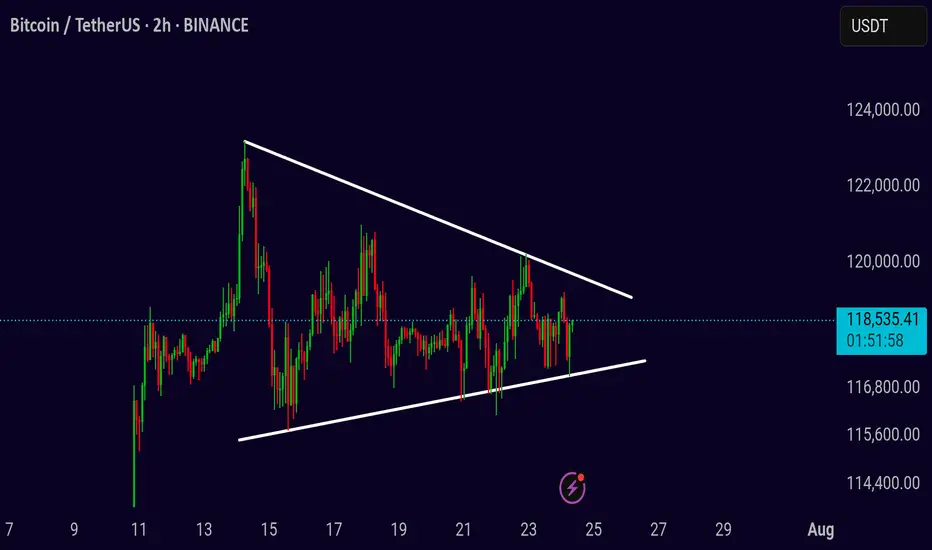
BTC Symmetrical Triangle – Decision Time Soon
BTCUSDT Idea (2H Chart)
BTC is consolidating inside a symmetrical triangle, creating pressure for a breakout. Price is currently ranging between 116K–120K, with volatility compressing.
Patience is key here — don’t rush entries.
A confirmed breakout or breakdown will give the real direction.
Break above the triangle = bullish continuation
Break below = further correction ahead
Wait for 2H close outside the pattern with volume
Watch levels:
* Upside: 120K → 124K → 128K
* Downside: 116K → 112K → 108K
Setup is maturing — breakout is just a matter of time. Let the chart lead, not emotions.
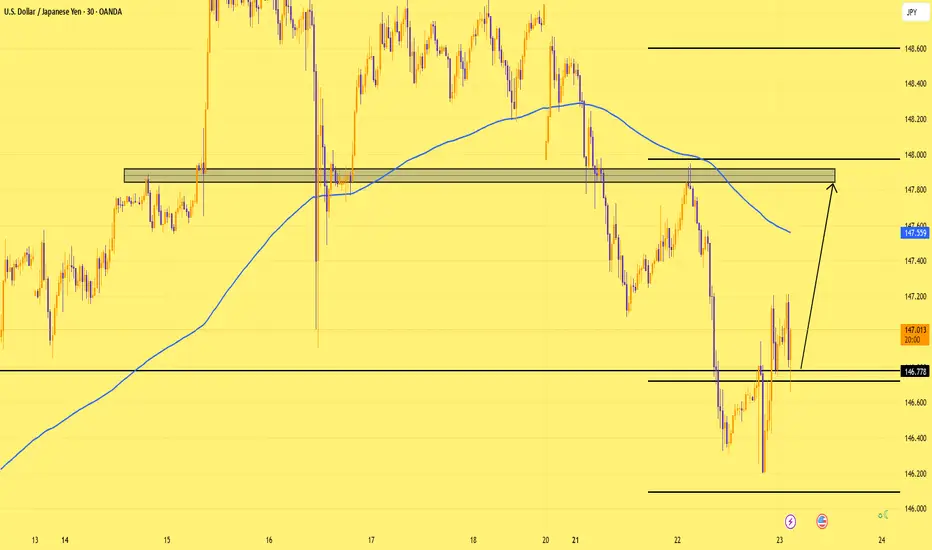
USDJPY: Back to the Shelf Before Lift-Off?Price might drop a little at the open, but I don’t expect it to go far.
Support is around 146.77—if it holds, we could see a move back up toward 147.80.
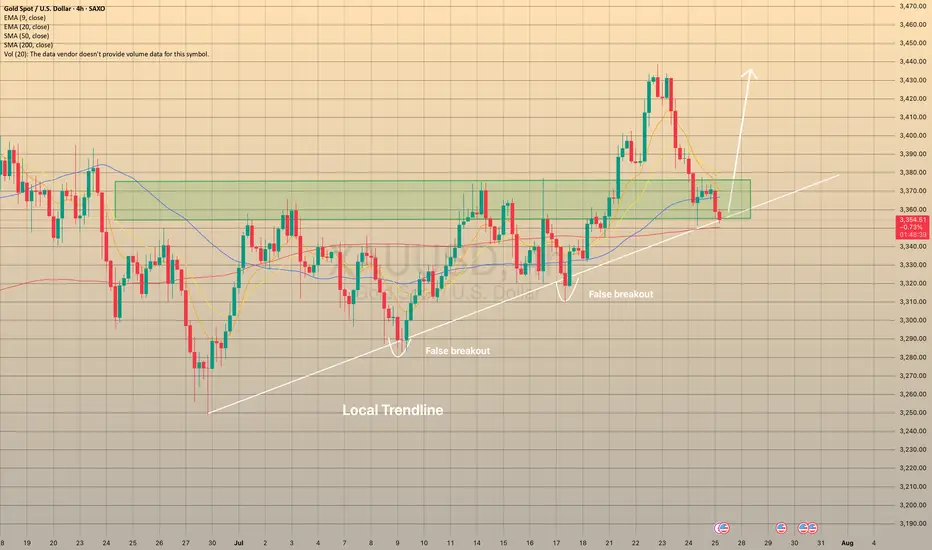
XAUUSD REACHED THE LOCAL TRENDLINEXAUUSD REACHED THE LOCAL TRENDLINE
On July 24 the U.S. Manufacturing PMI report came out way below forecasted (49.5 actual vs 52.6 forecasted). A number below 50 causes concerns among investors and could be a sign of an overall economic slowdown or recession. So, as a result, it could lead to an increase in demand for safe assets like gold.
However, today the price, despite the recent rebound from the trendline after report, came to the trendline once again. There is a high possibility that the price will rebound in nearest future: besides the local trendline we may observe the sma200 on 4-h chart. Additionally, we entered the price zone of 3,350.00-3,375.00, which used to be a resistance zone, now may play out as a support. In case of rebound, the price may go to local highs of 3,440.00 at least.
Is the DXY finally changing its trend?It seems that the DXY is showing a tendency to change its trend, but we have to see whether the sellers will allow it or not.

